
Social Commerce Market Size and Share
Social Commerce Market Analysis by Mordor Intelligence
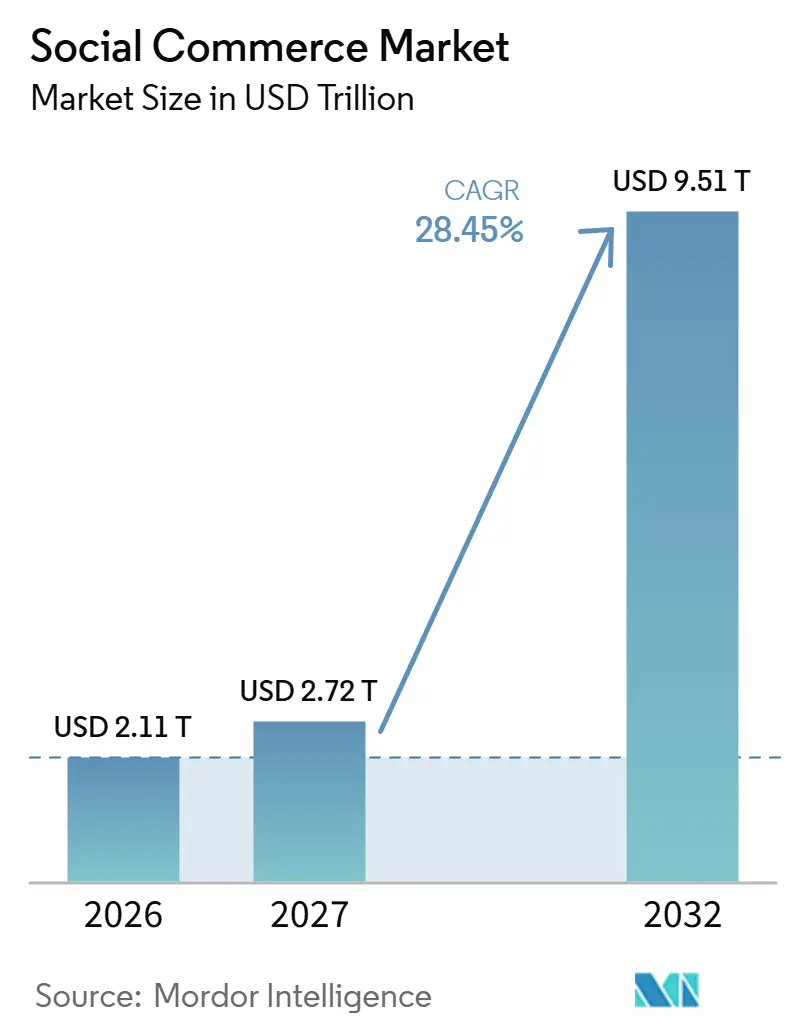
The social commerce market size was valued at USD 2.11 trillion in 2026 and estimated to grow from USD 2.72 trillion in 2027 to reach USD 9.51 trillion by 2032, at a CAGR of 28.45% during the forecast period (2027-2032).
The commercial opportunity connects creator-led discovery with in-app product links and personalized product feeds. In China, established online buying habits give live shopping an operating retail base. In Europe, personalized fashion discovery can connect content distribution with merchandise relevance. Broader merchant participation and data-permission choices are changing how platforms serve sellers and potential buyers. Advertising-cost pressure makes those choices commercially consequential, as sellers need to turn audience reach into profitable purchases.
Key Report Takeaways
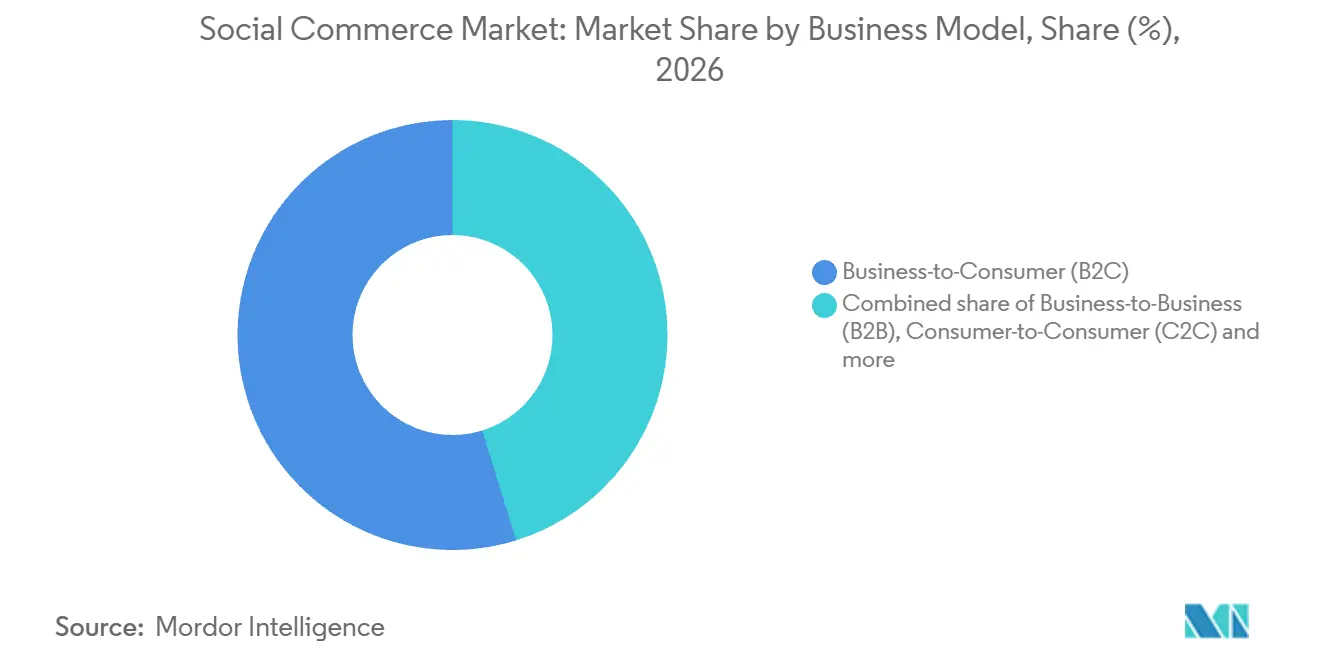
- By business model, business-to-consumer (B2C) led with a 54.79% social commerce market share in 2026, while consumer-to-consumer (C2C) is forecast to grow fastest at a 33.1% CAGR during 2027-2032.
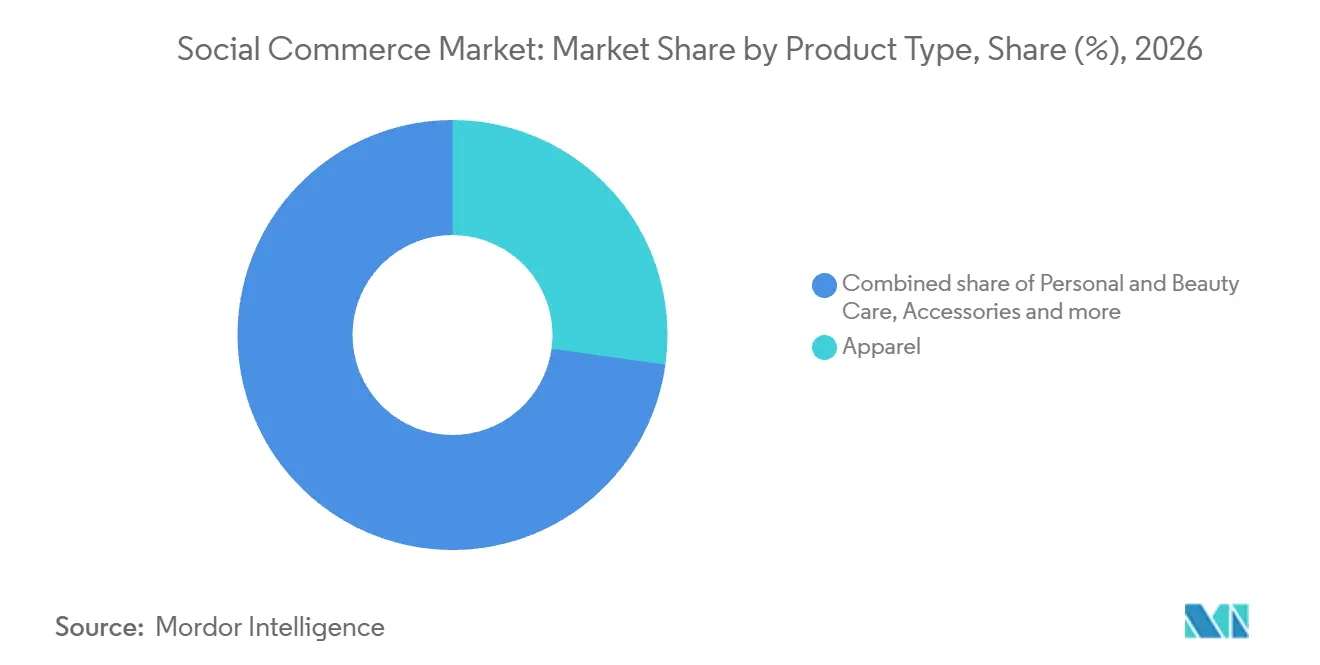
- Across product types, apparel led with a 27.2% share of the social commerce market size in 2026, and personal and beauty care is forecast to grow fastest at a 32.5% CAGR during 2027-2032.
- Among devices, smartphones led with 91.82% of market revenue in 2026 and are also forecast to grow fastest at a 29.6% CAGR during 2027-2032.
- By sales channel, video commerce held 42.62% of market revenue in 2026, while social reselling is forecast to grow fastest at a 33.6% CAGR during 2027-2032.
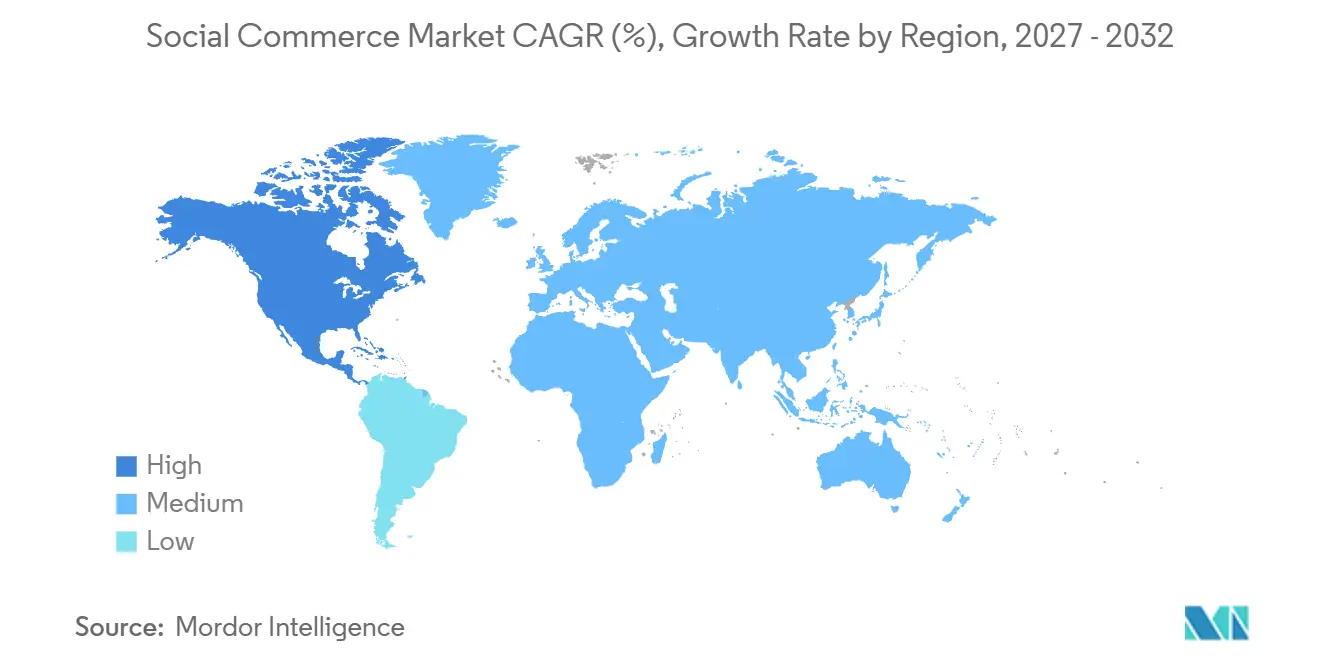
- Geographically, Asia-Pacific led with 34.15% of market revenue in 2026, and North America is forecast to grow fastest at a 30.5% CAGR during 2027-2032.
Note: Market numbers in this report are based on Mordor Intelligence's proprietary estimation framework, which combines nine months of actuals with Q4 projections for base year 2026.
Market Trends and Insights
Drivers Impact Analysis of Social Commerce Market*
| Driver | (~) % Impact on CAGR Forecast | Geographic Relevance | Impact Timeline |
|---|---|---|---|
| Accelerated Adoption of In-App One-Click Payments Across Southeast Asia | +8% | Indonesia, Malaysia, the Philippines, Singapore, Thailand, and Vietnam | Short term (≤ 2 years) |
| Live-stream Video Shopping Surge Among Gen-Z in China and the U.S. | +7.5% | China, United States, United Kingdom, and Germany | Short term (≤ 2 years) |
| Hyper-Personalized AI Recommendation Engines Boosting AOV in Europe | +6% | Across European markets | Medium term (2-4 years) |
| Social-First DTC Brand Proliferation in North America | +5.5% | Across the United States | Medium term (2-4 years) |
| Cross-Border Social Shopping Enabled by Embedded Logistics APIs | +4% | Germany, Spain, Italy, and France | Medium term (2-4 years) |
| Integration of Social Wallets (e.g., WeChat Pay, KakaoPay) Driving Conversion | +3% | Nationwide in Malaysia | Short term (≤ 2 years) |
| Source: Mordor Intelligence | |||
Accelerated Adoption of In-App One-Click Payments Across Southeast Asia
A route from product videos to an in-app purchase makes payment readiness relevant to social sellers. After product approval, TikTok Shop’s video links let shoppers in Indonesia, Malaysia, the Philippines, Singapore, Thailand, and Vietnam make purchases in the app. Malaysian e-payment transactions rose 25% to 18.4 billion in 2025 across cards, e-money, FPX, and DuitNow Online Banking/Wallets.[1] FPX and DuitNow Online Banking/Wallets commonly serve e-commerce purchases. Because the product page is where a viewer who tapped a link can place an order, the payment rails shoppers already use in Malaysia shape the opportunity to convert those taps into purchases.
Live-stream Video Shopping Surge Among Gen-Z in China and the U.S.
China’s live-commerce user base totaled 660 million in 2025. In an October 2026 Censuswide survey across the United States, United Kingdom, and Germany, 47% of Gen Z respondents said they shop live more than they did a year earlier. A 2025 live-commerce study of 390 respondents associated streamer expertise, demonstration, and interaction with perceived product value and trust, which were linked to purchase intentions. For brands, this makes presenter selection a merchandising decision as well as a choice about audience reach. Because the study links presenter skill to perceived product value and trust, and those to purchase intention, presenter capability is the lever a brand controls once a stream has reached its audience.
Hyper-Personalized AI Recommendation Engines Boosting AOV in Europe
Personalized discovery can connect a social shopping session with a broader selection of relevant products. On October 15, 2025, Zalando reported its AI-powered discovery feed operating in 22 markets, combining personalized fashion and lifestyle recommendations with shoppable video and livestreams.[2] This followed an initial rollout in 6 markets in July 2025. The feed brought brand and creator content together in a personal stream tailored close to real time. For fashion sellers, combining recommendation and content distribution creates a route to cross-selling within the same discovery experience. Any expansion in basket value would depend on those additional recommendations being useful to the shopper, making product relevance commercially more important than content volume alone.
Social-First DTC Brand Proliferation in North America
For established brands, social storefronts can complement an existing retailer network. In September 2025, Wet Brush, owned by Beauty By Imagination, relaunched direct-to-consumer shopping for its brushes in the United States and launched on TikTok Shop. Consumers could buy directly from the brand as well as through major e-commerce and omnichannel retailers. For the brand, this creates a channel-allocation decision between its own site, its TikTok Shop storefront, and retailer distribution. Because Wet Brush retained retailer distribution while adding its own site and TikTok Shop, this expansion illustrates how established brands can broaden direct social commerce beyond newly formed social-first labels.
Restraints Impact Analysis of Social Commerce Market*
| Restraint | (~) % Impact on CAGR Forecast | Geographic Relevance | Impact Timeline |
|---|---|---|---|
| Rising User Acquisition Costs on Mature Platforms | -2.5% | United States and Canada | Short term (≤ 2 years) |
| Fragmented Data-Privacy Mandates (EU-DMA, CPRA, PDPA) | -1.8% | European Union, California, and Singapore | Medium term (2-4 years) |
| Creator-Platform Revenue Tussle Curtailing Content Supply | -0.8% | Across the United Kingdom | Short term (≤ 2 years) |
| Livestreaming Commerce Regulation Caps in China | -0.6% | Nationwide in China | Short term (≤ 2 years) |
| Source: Mordor Intelligence | |||
Rising User Acquisition Costs on Mature Platforms
Higher advertising prices make conversion performance more important to the economics of acquiring a social shopper. Meta’s worldwide average price per ad across its apps increased 12% year over year in Q2 2026. For a merchant converting an unchanged proportion of paid exposures into purchases, higher exposure costs would reduce the contribution left from each order. Meta reported that its average price per ad rose 20% year over year in Q2 2026 for its combined United States and Canada user-geography category. Paid audience access can therefore become a constraint on profitable expansion even without a decline in shopper interest.
Fragmented Data-Privacy Mandates (EU-DMA, CPRA, PDPA)
Privacy fragmentation constrains the data combinations a social seller can use to connect audiences with products. California’s CCPA rules effective January 1, 2026, bar a clothing seller’s social-media service provider from using supplied customer email lists to target consumers who opted out of sale or sharing. The rules permit aggregate or demographic ads. The EU Digital Markets Act restricts designated gatekeepers’ cross-service personal-data combination or reuse without specific user consent and requires a less-personalized alternative. Singapore generally requires actual or deemed consent for personal-data collection, use, or disclosure unless the PDPA or another written law authorizes it without consent. Sellers consequently bear the continuing cost of adapting audience activation to each applicable permission regime.
*Our forecasts treat driver/restraint impacts as directional, not additive. The impact forecasts reflect baseline growth, mix effects, and variable interactions.
Social Commerce Market Segment Analysis
By Business Model:
Small Brands and Peer Selling Broaden ParticipationBusiness-to-consumer (B2C) accounted for a 54.79% share of the social commerce market size in 2026. U.S. small businesses with less than USD 15 million in annual revenue on TikTok Shop increased sales 66% in 2025 compared with 2024. These businesses sell directly to consumers, so their sales growth illustrates the merchant participation behind the leading model.
Consumer-to-consumer (C2C) is the fastest-growing segment, with a projected CAGR of 33.1% during 2027-2032. In a June 2025 U.S. survey of 1,109 secondhand sellers, 57% preferred peer-to-peer selling, with a margin of error of ±3 percentage points. Consignment services instead handle listings and pricing for a larger fee, giving sellers a different service proposition. For social platforms, peer selling creates an opportunity to support individual listing decisions and direct buyer contact without adopting the full consignment model. Tools that preserve the seller’s role in the transaction can consequently address a distinct preference, rather than treating every individual seller as a customer for managed resale services.

By Product Type:
Apparel Leads While Beauty ExpandsApparel represented a 27.2% social commerce market share in 2026. TikTok Shop reported average weekly revenue growth of 78% since July 2025 for Creamy Fabrics, a German shapewear brand using creator affiliates. At its first Black Friday on TikTok Shop in Germany in 2025, Creamy Fabrics also recorded its highest average daily revenue to date. The result shows an apparel brand converting seasonal shopper traffic into record average daily sales on the platform.
Personal and beauty care is the fastest-growing segment, with a projected CAGR of 32.5% during 2027-2032. In the 52 weeks ending March 29, 2026, NIQ’s beauty grouping represented 41% of TikTok Shop Europe’s fast-moving consumer goods (FMCG) value sales. It comprised cosmetics, hair care, fragrances, skin conditioning and moisturizing, facial cleansing, and sun care. By Q1 2026, TikTok Shop ranked among the top online beauty retailers in the United Kingdom, Spain, Ireland, Germany, Italy, France, and the United States.
By Device:
Smartphone Convenience Shapes Channel ChoiceThe smartphone segment was the largest and fastest-growing segment, with a 91.82% share of market revenue in 2026 and a projected 29.6% CAGR during 2027-2032. SOTI’s 2025 survey of 12,000 consumers aged 18 to 65 across 10 countries found that 65% considered phones the most convenient way to make purchases. That preference gives social sellers a practical reason to connect product discovery with a purchase experience designed around phone use.
In Salsify’s January 31, 2025 survey, 12% selected social media apps as a preferred smartphone shopping method in a multiple-response question. The sample comprised 557 U.S. and 558 U.K. shoppers, totaling 1,115 respondents. That limited preference means a phone-first seller still has to attract shoppers to its social commerce channel. For merchants, device access and social-app preference require distinct decisions about how the product is discovered and presented. Smartphone reach supplies an access point, while a useful social shopping experience must earn a place within the customer’s choice of mobile purchasing methods.
By Sales Channel:
Video Scale Meets Messaging-Led SellingVideo commerce was the largest segment, accounting for 42.62% of market revenue in 2026. TikTok Shop Malaysia said in 2026 that LIVE and video each accounted for about one-third of its platform sales. These separate contributions show that the channel’s scale on this Malaysian platform does not depend on livestreams alone.
Social reselling is the fastest-growing segment, with a projected CAGR of 33.6% during 2027-2032. In India’s FY2025 direct-selling industry, WhatsApp and digital messaging platforms were emerging as primary sales channels for direct sellers and consumers. Messaging brings seller communication into the route to purchase, allowing product explanation and customer contact to develop through the same exchange. For social reselling, this offers a mechanism for extending selling activity through conversations without relying entirely on a centrally operated shopfront. Providers can therefore support a seller-led commercial relationship while preserving the direct contact that gives conversational selling its distinct operating model.
Geography Analysis
Asia-Pacific Social Commerce Market
Asia-Pacific held a 34.15% share of the social commerce market size in 2026. China’s online physical-goods sales represented 26.1% of total retail sales of consumer goods in 2025, illustrating an established online buying environment. China’s livestream-commerce transaction value grew more than 10% in 2025.[3] With more than a quarter of China’s consumer-goods retail already online, livestream operators can connect viewers to existing merchant catalogs, making merchant integration a route to scale alongside audience expansion.
North America Social Commerce Market
North America is the fastest-growing geography, with a projected CAGR of 30.5% during 2027-2032. TikTok Shop reported nearly 50% more U.S. shoppers made a purchase during its 2025 4-day Black Friday and Cyber Monday period than during the 2024 event. For U.S. sellers, this connects social storefront activity with a concentrated retail calendar, giving product demonstrations and promotional content a defined period in which to address purchasing customers. Those purchases create an opening for continued product discovery after the event, allowing a social storefront to develop a selling relationship beyond the promotion itself.
Europe’s creator route was prominent in Germany, France, Spain, and Italy, where affiliates accounted for nearly 70% of estimated TikTok Shop merchandise volume in the 90 days ending July 9, 2026. In South America, CNDL and SPC Brasil’s 2025 survey found that 49% of Brazilian respondents reported buying directly through social networks in the preceding 12 months. The Middle East’s UAE example highlights trust risk, with 38% of respondents who experienced a financial scam in the prior 12 months placing the incident on social media in Visa’s 2026 survey. In Africa, 27% of around 3,000 digitally active South Africans surveyed for Stitch’s 2026 report selected social commerce as a preferred channel, with multiple responses permitted. Social media’s lead among reported scam venues in the UAE makes trust a conversion issue, whereas affiliate-led sales in the 4 European countries make creator access a distribution decision.
Mordor Intelligence provides coverage of the social commerce market across other key regional markets. Detailed country-level analysis extends to India, Brazil, Canada, China, and France incorporating local coverage and market participation, as required.
Regulatory Framework and Outlook
The comparison assesses selected jurisdictions from the perspective of a compliant consumer-facing marketplace operator. Marketplace duties turn on the service offered, with exemptions in Germany and Brazil and activity-specific requirements in the UAE. Clear obligations can support compliant participation, although broader verification and recordkeeping responsibilities require more platform work.
Regulatory Table of Social Commerce Market
| Decision factor | United States | Germany | China | Brazil | United Arab Emirates | Nigeria |
|---|---|---|---|---|---|---|
| Primary authority | Federal Trade Commission | Bundesnetzagentur, the Digital Services Coordinator | State Administration for Market Regulation and Cyberspace Administration of China | SENACON, with technical support from SEDIGI and SPDIGI | Ministry of Economy and competent federal or local authorities | Federal Competition and Consumer Protection Commission for consumer law; Federal Ministry of Communications, Innovation and Digital Economy for platform harmonization |
| Key instruments or direction | Consumer Reviews and Testimonials Rule; October 2026 platform-scam rulemaking notice | EU Digital Services Act (DSA); draft trusted-flagger guidance | Livestream-commerce measures effective February 1, 2026; July 2026 E-Commerce Law draft, with consultation closed August 4, 2026 | Consumer Defense Code; marketplace exclusion from September 2026 paid-ad Portaria | Federal Decree-Law No. 14/2023 on Trading by Modern Technological Means | Federal Competition and Consumer Protection Act; draft 2026 sales-promotion amendments; July 2026 platform-harmonization direction |
| Commercial effect | Purchasing or procuring indicators that materially misrepresent commercial influence is prohibited when the buyer knew or should have known they were fake | Trader traceability and compliant interface design for qualifying marketplaces, excluding small and micro enterprises | Identity verification, risk management, and transaction-record duties for livestream-commerce platform operators | Marketplace providers retain consumer-law and other applicable duties while excluded from the special paid-ad requirements | Covered activities require applicable licensing, secure systems, public transaction terms, and digital invoices | Statutory mandates remain enforceable; July 2026 direction deferred specified cross-cutting requirements under harmonization |
| Current policy attractiveness | High | Medium | Low | Medium | Medium | Medium |
| Future direction of policy attractiveness | Hardening | No change | Hardening | No change | No change | No change |
| Source: Mordor Intelligence | ||||||
The United States’ targeted fake-influence controls contrast with China’s broader platform duties, while policy proposals in October 2026 and July 2026, respectively, support hardening judgments. Germany’s existing DSA procedures and draft guidance support continuity, as does Brazil’s marketplace exclusion during paid-ad phase-ins, with consumer-law duties preserved. The UAE’s Medium and No change judgments reflect applicable licensing and consumer-facing duties under the operative decree, with a 2025 resolution addressing administrative penalties for its violations. Nigeria’s Medium and No change ratings reflect its July 2026 direction to preserve statutory mandates while deferring specified requirements under harmonization, with a separate September draft addressing promotion rules and notification fees.
Value Chain Stages
The value-chain comparison follows the handoffs from merchant systems to social discovery and order fulfillment. Supplier earnings arise from different commitments, with merchants paying for platform access and creators receiving commissions only when a sale occurs. This gives a seller a reason to separate the cost of maintaining a channel from the cost triggered by a transaction. Operational resilience depends on coordinating those handoffs so wider content distribution can be served by the merchandise and fulfillment operation behind it.
Value Chain Analysis Table of Social Commerce Market
| Primary activity | Key participants | Value capture | Bottleneck | Resilience response |
|---|---|---|---|---|
| Merchant catalog and channel integration | Commerce-platform providers such as Shopify | Commerce-platform subscriptions | Consistent product data across selling channels | Maintain a shared catalog with channel-specific validation |
| Social discovery and affiliate distribution | Affiliate-program operators such as TikTok Shop in the United States, alongside participating creators | Creator commissions when a sale occurs | Creator earnings depend on sales rather than exposure alone | Match products and creators, then adjust content using sales feedback |
| Social-order storage and fulfillment | Fulfillment providers such as TikTok Shop through Fulfilled by TikTok (FBT) in the United Kingdom | Seller-paid storage and per-item operation fees | Longer storage creates additional holding-cost exposure | Align inbound stock with sell-through and review slow-moving items |
| Source: Mordor Intelligence | ||||
U.K. FBT storage charges vary with inventory duration and quantity and apply per cubic meter, stock-keeping unit, and day, while operation fees are per item based on size and weight. That makes stock dwell time a different cost exposure from creator compensation, which is payable on a sale. Providers connecting catalog accuracy, sale attribution, and fulfillment planning can help merchants expand distribution while retaining visibility over which activity creates each cost.
Competitive Landscape
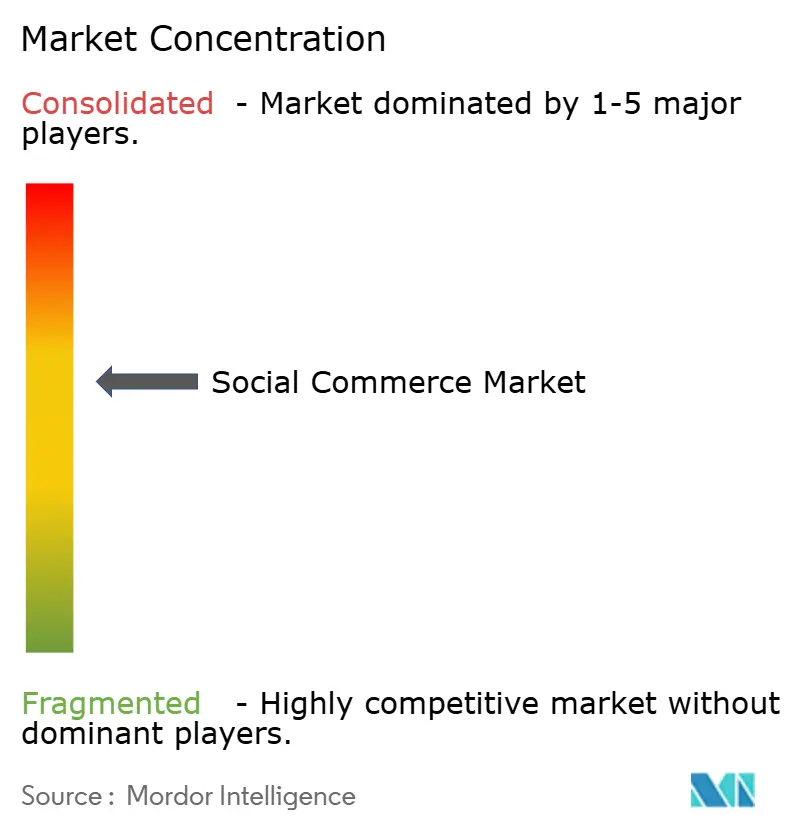
Meta Platforms Inc. operates Facebook Marketplace, and ByteDance Ltd. owns TikTok, which operates TikTok Shop, connecting sellers with potential buyers through different social-commerce environments. Alibaba Group Holding Ltd.’s Taobao and Tmall hosted livestream selling during the 2025 6.18 festival, while PDD Holdings Inc. connects social sharing with lower-priced team purchases on Pinduoduo. Pinterest Inc. connects visual discovery with shoppable products and reported 619 million global monthly active users in 2025, up 12% year over year. The structure is platform-led, combining large discovery networks with merchant participation and distinct buying mechanisms, so transaction design matters alongside the scale of the audience a service can reach.
TikTok Shop had more than 215,000 small businesses actively selling in the United States in May 2026, up 25% year over year, with annual revenue below USD 15 million. A larger merchant base increases the potential assortment, while making seller differentiation a more concrete issue than simply gaining access to the service. PDD Holdings’ revenue from online marketing services and others, plus transaction services, rose 9.7% in 2025 compared with 2024, with substantially all revenue coming from third-party merchants in China. For sellers, the competitive question is how effectively a platform turns discovery into merchant economics, rather than whether audience access or the active seller base alone is expanding.
Regulatory positioning also becomes part of a platform’s commercial design. By the end of January 2026, Meta had offered EU users the choice of sharing all their data for fully personalized ads or less data for more limited personalized ads. The choice was offered in addition to Meta’s paid no-ads option. Pinterest announced Pinterest Assistant in October 2025, combining conversational visual search with shoppable product recommendations. Discovery quality is consequently a competitive lever alongside the user-dependent data depth available for ad targeting.
Social Commerce Industry Leaders
-
Meta Platforms Inc.
-
ByteDance Ltd.
-
Alibaba Group Holding Ltd.
-
PDD Holdings Inc.
-
Pinterest Inc.
- *Disclaimer: Major Players sorted in no particular order
Social Commerce Market Companies Covered in this Report
- Meta Platforms Inc.
- ByteDance Ltd.
- Alibaba Group Holding Ltd.
- PDD Holdings Inc.
- Pinterest Inc.
- Amazon.com Inc.
- Snap Inc.
- X Corp. (Twitter)
- Shopify Inc.
- Etsy Inc.
- Tencent Holdings Ltd. (WeChat)
- Kakao Corp.
- Meesho Limited (Meesho)
- Roposo (Glance InMobi)
- LY Corporation
- PT Bukalapak.com Tbk
- MercadoLibre Inc.
- SIA Joom
- Depop Ltd.
- JD.com Inc.
- Kuaishou Technology
Key Opportunities for Market Participants
The opportunities compare creator-led selling routes across retail assortments, marketplace catalogs, and video-platform affiliates. Their commercial value depends on linking a useful product demonstration to a purchase route that the relevant seller can actually serve. This favors focused content and catalog work over treating every additional social surface as an equally ready sales channel.
Market Opportunities Table of Social Commerce Market
| Opportunity | Why now | Buyer / lead segment | Recommended play | Main barrier | Likely beneficiaries |
|---|---|---|---|---|---|
| Creator demonstrations for selected technology products | Best Buy announced nearly 10,000 selected products for a planned late-October 2026 TikTok Shop launch | Technology brands in Best Buy’s selected assortment | Build product-specific demonstrations for shoppable videos and photos | Producing useful demonstrations across diverse technology categories | Best Buy, TikTok Shop, participating creators |
| Affiliate merchandising for Indian marketplace products | Flipkart Group’s June 2026 announcement identified Instagram as the planned phase after Facebook | Creators promoting Flipkart and Myntra products in India | Prepare accurate product tags and content around a focused catalog | Maintaining product-to-content accuracy across marketplace catalogs | Flipkart, Myntra, Meta, participating creators |
| French video affiliate selling | YouTube Shopping launched its French affiliate program in October 2026 with easing eligibility criteria and expanding catalogs, including Amazon’s | Eligible French video creators | Connect demonstrations in videos, Shorts, and live streams with relevant product tags | Maintaining accurate product matches as catalogs expand | YouTube, Amazon, participating creators |
| Source: Mordor Intelligence | |||||
The central opening is commercially reusable creator content with accurate product links. Best Buy’s planned route puts order fulfillment with the retailer, while creators present the selected assortment through shoppable content. Best Buy, Flipkart and Myntra, and Amazon supply the assortments behind these creator routes, positioning catalog providers to capture demand generated through another company’s social platform.
Recent Industry Developments in Social Commerce Market
- Oct 2026: Google launched YouTube Shopping’s affiliate program in France, allowing eligible creators to tag products in videos, Shorts, and live streams, with Amazon named as a catalog partner.
- Sep 2026: Best Buy announced a planned late-October TikTok Shop launch with nearly 10,000 selected technology products, supported by creator-led shoppable videos and photos.
- Sep 2026: Pinterest announced Visual Search Ads, with beta availability for eligible advertisers in its ad markets planned for the following weeks.
Social Commerce Market Report Scope and Research Methodology
Market Definition and Coverage
The social commerce market measures annual spending on goods and services purchased through social media-led journeys where discovery, engagement, and purchase occur in a social environment. It covers demand globally.
Scope exclusions: Traditional e-commerce purchases that use social media only for broad advertising and complete checkout outside social or social-linked shopping flows, social platform advertising revenue, and sales of laptops, desktops, and smartphones as devices are excluded.
Segments Covered in This Report
- By Business Model
- Business-to-Consumer (B2C)
- Business-to-Business (B2B)
- Consumer-to-Consumer (C2C)
- By Product Type
- Apparel
- Personal and Beauty Care
- Accessories
- Home Products
- Health Supplements
- Food and Beverages
- Other Product Types
- By Device
- Laptops and Desktops
- Smartphone
- By Sales Channel
- Video Commerce
- Social Network-Led Commerce
- Social Reselling
- Group Buying / Team Purchase
- Product Review and Discovery Platforms
- By Geography
- North America
- United States
- Canada
- Mexico
- Europe
- Germany
- United Kingdom
- France
- Spain
- Rest of Europe
- Asia-Pacific
- China
- India
- Japan
- South Korea
- Rest of Asia-Pacific
- South America
- Brazil
- Argentina
- Rest of South America
- Middle East
- Saudi Arabia
- United Arab Emirates
- Rest of Middle East
- Africa
- South Africa
- Nigeria
- Rest of Africa
- North America
Data Sources, Market Sizing, and Validation
Desk Research
Public and official sources such as the International Telecommunication Union's Facts and Figures series, UN Trade and Development's e-commerce measurement work and Digital Economy Report, and the U.S. Census Bureau's retail e-commerce series can inform digital access, e-commerce measurement, and retail context. These sources provide context and cross-checks for transaction spending, with attention to their geography, coverage, and definitions.
Company filings, investor materials, platform announcements, and reputable business press such as Modern Retail's reporting on social-platform sellers can be reviewed for disclosed commerce activity, seller participation, channel changes, and operating conditions, then checked against public retail and connectivity indicators. The named sources are illustrative rather than exhaustive, and further sources inform collection, validation, and clarification.
Primary Interviews and Surveys
Interviews and structured surveys would include social platform, merchant, creator-commerce, payment, and fulfillment specialists across the global market, with respondents selected across company sizes and functional responsibilities. Respondents would test secondary-source interpretations of qualifying purchase journeys, transaction values, channel and product mix, and regional operating conditions, while highlighting missing or non-comparable information. Analysts would reconcile these views with public evidence and use follow-up questions where reported definitions or estimates conflict.
Distribution of primary research fieldwork respondents
| Company type | Respondent position | Region |
|---|---|---|
| Top tier: 30% | CXOs: 20% | APAC: 40% |
| Mid tier: 45% | Functional/Unit leaders: 35% | EMEA: 30% |
| Smaller Players: 25% | Managers: 45% | Americas: 30% |
Market-Sizing & Forecasting
The top-down estimate starts with global online retail and e-commerce activity, then isolates purchases in which discovery, engagement, and purchase occur in a social environment. Historical e-commerce sales, internet and mobile access, social platform use, and disclosed platform or seller commerce activity indicate the addressable transaction pool and how quickly social shopping is becoming a purchase route. Product mix, business model, device, sales channel, and regional retail conditions inform allocation of that total. A multivariate regression can relate those indicators to historical market movement, while scenario analysis carries forward differences in adoption, merchant participation, and checkout integration over the forecast period. Analysts can check selected regional or channel estimates against disclosed seller volumes and sampled average order values multiplied by transaction counts where those inputs are available, without treating such checks as the full model. When a source does not separate social-led purchases from general e-commerce, the model uses the closest comparable series as a bound, documents the unresolved component internally, and tests the effect across scenarios. Respondents with relevant operating roles would be asked to assess the direction and plausibility of individual drivers and segment patterns, with conflicting accounts compared against public evidence before model assumptions are adjusted.
Data Validation & Update Cycle
Analysts triangulate published market estimates, retail and connectivity indicators, company disclosures, and primary responses, checking that each observation fits the transaction boundary, geography, and period. They investigate material variances, breaks in series, and implausible segment or regional movements against the original source and independent signals, then document the resolution and obtain a second analyst review before sign-off. Re-contact is triggered when a respondent's definition, period, or reported operating change is unclear or conflicts materially with other evidence. The model is refreshed annually, reviewed between cycles after material market or regulatory events, and given a fresh source and calculation review before delivery.
Mordor Intelligence's Social Commerce Market Size Versus Other Published Estimates
Published estimates can differ in the transactions and products they count and the inputs used to model demand. The social commerce market measures annual spending on goods and services purchased through social media-led journeys where discovery, engagement, and purchase occur in a social environment.
Key Gap Drivers include the study's defined coverage and market-specific modeling choices. A multivariate regression can relate those indicators to historical market movement, while scenario analysis carries forward differences in adoption, merchant participation, and checkout integration over the forecast period.
Benchmark comparison
| Source | Market Size | Gaps in Research Methodology |
|---|---|---|
| Mordor Intelligence | USD 2.72 T (2027) | |
| Global Consultancy A | USD 2.52 T (2025) | At its 2025 base, this estimate is 7.4% below this report's 2027 value of USD 2.72 T, 2 years later. Its earlier global base precedes the report's current comparison year, which contributes to a lower comparison value. |
| Global Consultancy B | USD 1.48 T (2025) | At its 2025 base, this estimate is 45.6% below this report's 2027 value of USD 2.72 T, 2 years later. Its earlier global base precedes the report's current comparison year, which contributes to a lower comparison value. |
Mordor Intelligence's analysts triangulate published market estimates, retail and connectivity indicators, company disclosures, and primary responses, checking that each observation fits the transaction boundary, geography, and period.
Key Questions Answered in the Report
What is the social commerce market size and forecast growth?
It was valued at USD 2.11 trillion in 2026. It is estimated to grow from USD 2.72 trillion in 2027 to USD 9.51 trillion by 2032, at a 28.45% CAGR during 2027-2032.
What drives purchases through social platforms?
In-app links for approved products, live shopping, and personalized discovery connect content with purchasing. China’s 660 million live-commerce users in 2025 illustrate the audience base for live selling.
Which product category leads social commerce sales?
Apparel led with 27.2% of market revenue in 2026. Personal and beauty care is the fastest-growing segment, with a projected 32.5% CAGR during 2027-2032.
Which companies shape competition in social commerce?
Major participants include Meta Platforms Inc., ByteDance Ltd., Alibaba Group Holding Ltd., PDD Holdings Inc., and Pinterest Inc.
What can constrain profitable growth in social commerce?
Meta’s average price per ad increased 12% year over year in Q2 2026, raising a cost input for paid customer acquisition. EU gatekeeper consent rules also affect cross-service personalized advertising.
Which regions lead in size and projected social commerce growth?
Asia-Pacific led with 34.15% of market revenue in 2026. North America is forecast to grow fastest at a 30.5% CAGR during 2027-2032.