Market Overview
| Study Period | 2020 - 2031 |
|---|---|
| Forecast Data Period | 2026 - 2031 |
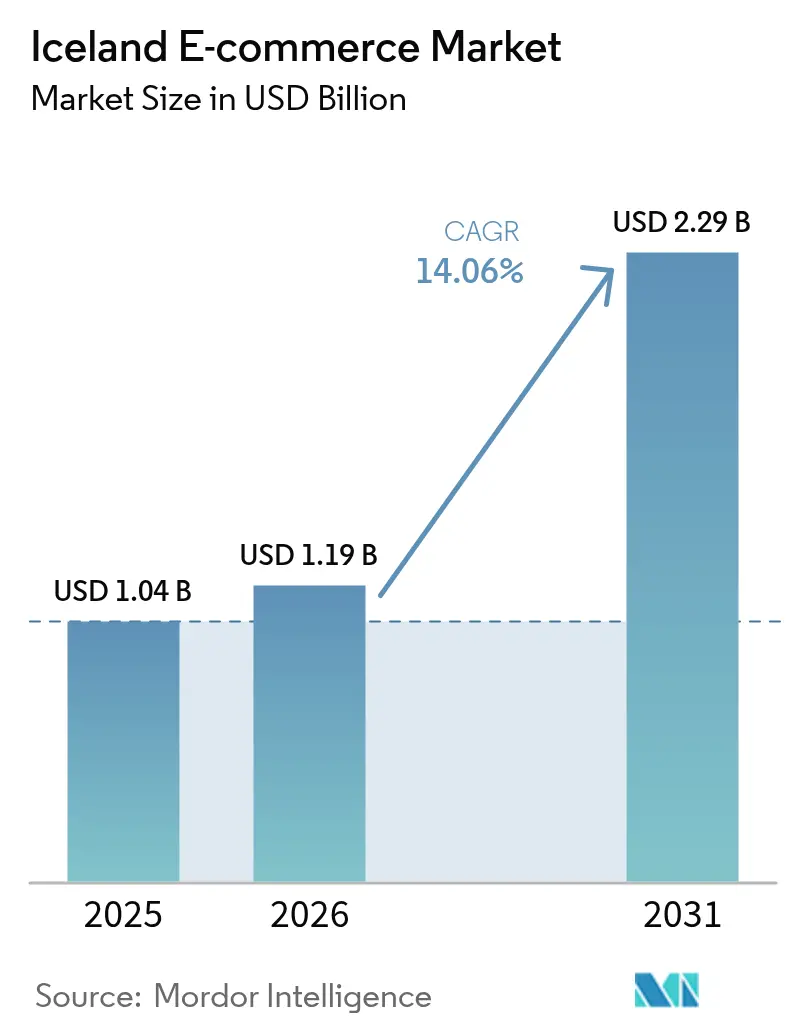
| Base Year Market Size (2025) | USD 1.04 Billion |
| Market Size (2026) | USD 1.19 Billion |
| Market Size (2031) | USD 2.29 Billion |
| Growth Rate (2026 - 2031) | 14.06% CAGR |
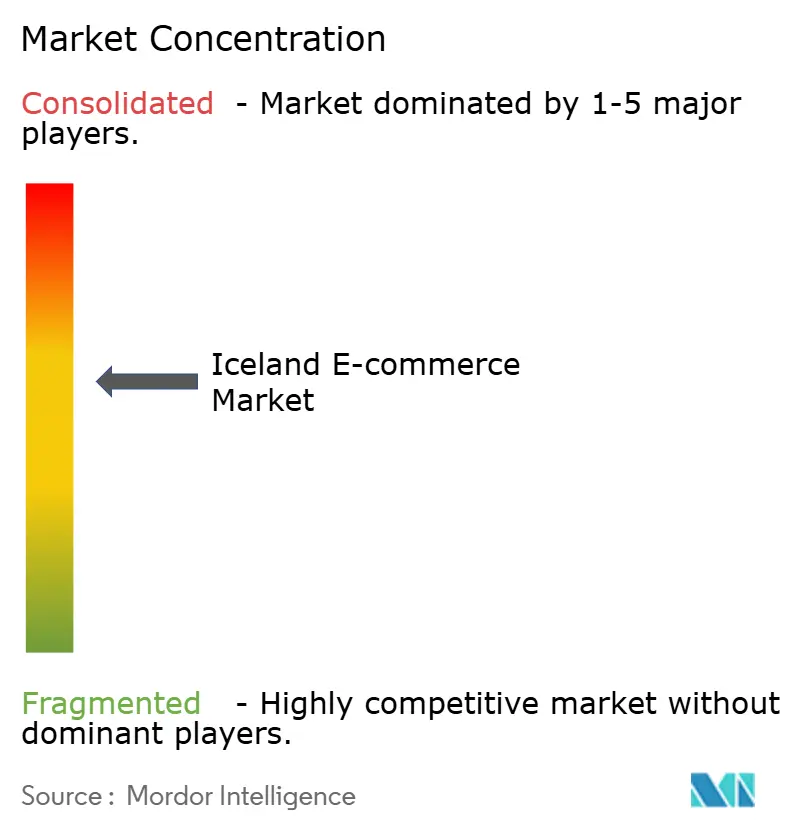
| Market Concentration | Medium |
Major Players *Disclaimer: Major Players sorted in no particular order Image © Mordor Intelligence. Reuse requires attribution under CC BY 4.0. | |
Iceland E-commerce Market Analysis by Mordor Intelligence
The Iceland e-commerce market size in 2026 is estimated at USD 1.19 billion, growing from 2025 value of USD 1.04 billion with 2031 projections showing USD2.29 billion, growing at 14.06% CAGR over 2026-2031. Consistent 99.8% internet penetration, the country’s cash-lite payment culture, and a mobile-first shopping mindset underpin this expansion. Robust domestic card turnover, which topped ISK128.5 billion (USD 1.06 billion) in April 2025, confirms the strong consumer appetite for online transactions.[1]Central Bank of Iceland, “Payment Intermediation in April 2025,” cb.is International retailers benefit from a government VAT rebate on low-value imports, yet local merchants counter with Iceland Post’s same-day Reykjavik service and tailored loyalty programs. B2B digital procurement is accelerating as firms pursue efficiency gains, while tourism-fuelled demand for niche Icelandic goods opens cross-border revenue streams. Despite its momentum, the Iceland e-commerce market continues to battle scale constraints, volatile logistics costs, and import duties on non-EEA parcels.
Key Report Takeaways
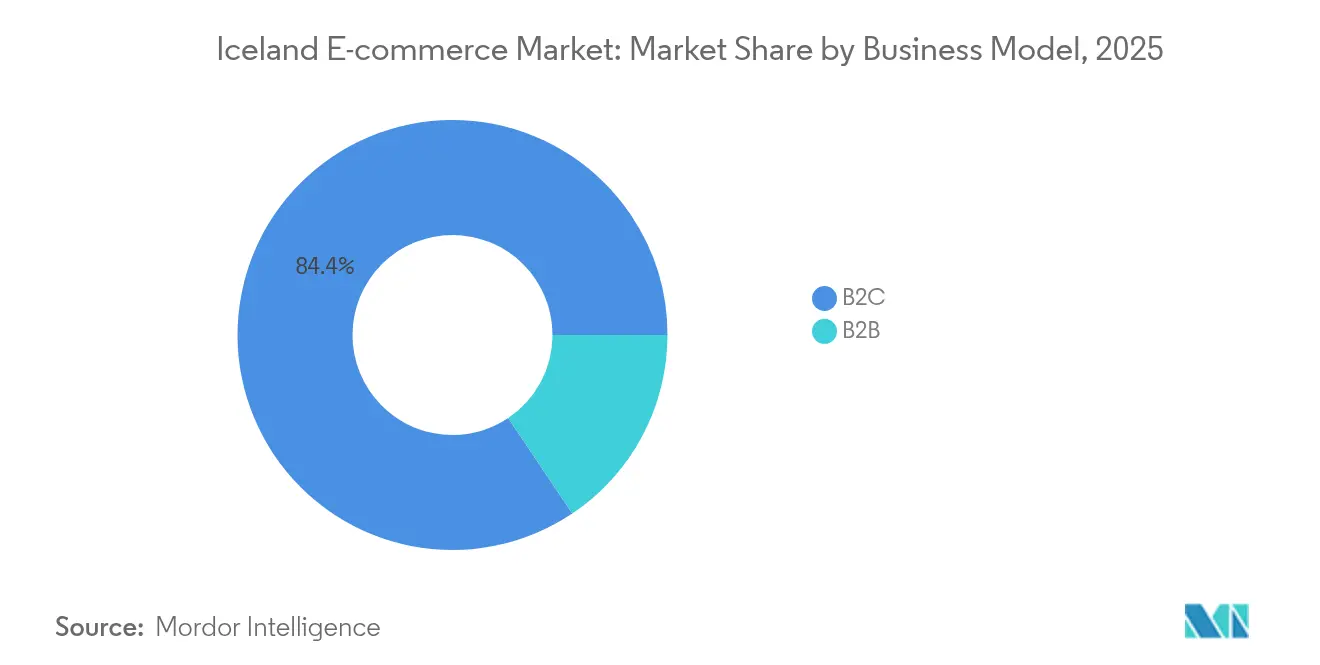
- By business model, the B2C segment led with an 84.40% Iceland e-commerce market share in 2025; B2B is forecast to grow at a 14.34% CAGR through 2031.
- By device type, mobile commerce captured 71.35% of 2025 sales and is pacing an annual 13.55% rise to 2031.
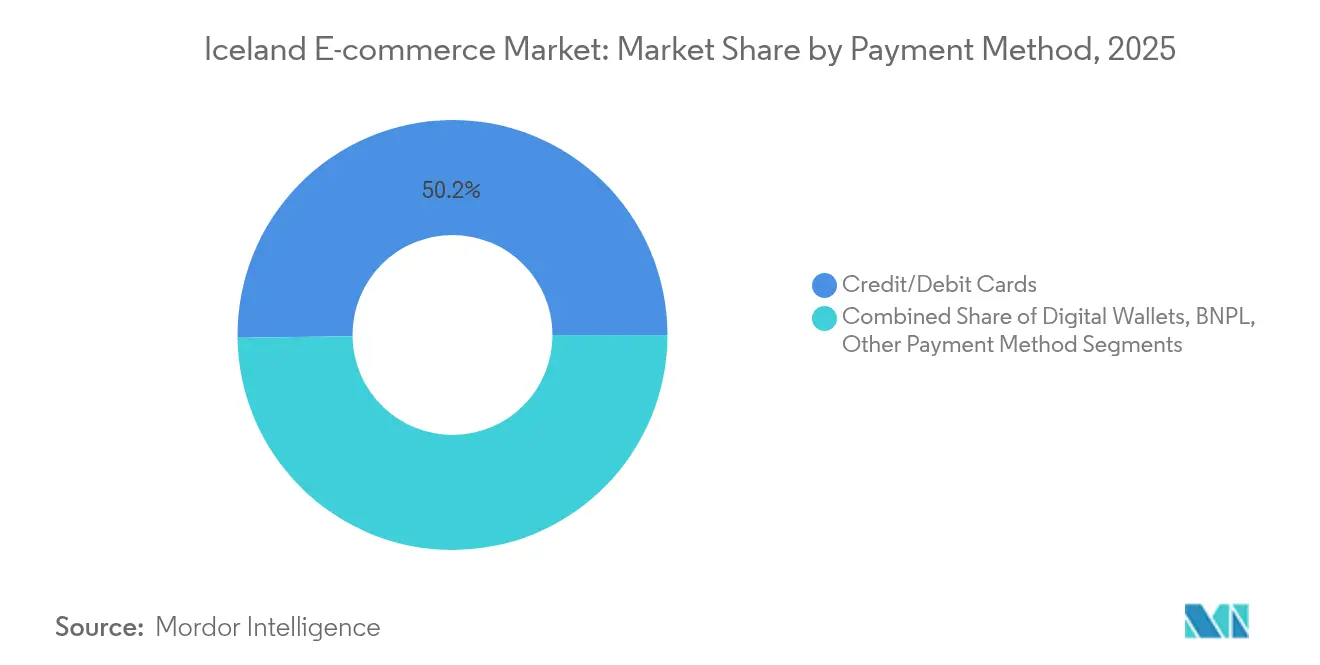
- By payment method, cards secured 50.20% share of transactions in 2025, while digital wallets are advancing at an 17.95% CAGR.
- By product category, Fashion & Apparel dominated with 27.45% revenue in 2025; Food & Beverages is expanding at a 14.31% CAGR to 2031.
Note: Market size and forecast figures in this report are generated using Mordor Intelligence’s proprietary estimation framework, updated with the latest available data and insights as of 2026.
Iceland E-commerce Market Trends and Insights
Drivers Impact Analysis*
| Driver | (~) % Impact on CAGR Forecast | Geographic Relevance | Impact Timeline |
|---|---|---|---|
| Hyper-digitised Population with 99% Internet Penetration | +3.6% | National | Long term (≥ 4 years) |
| Universal Bank-ID Adoption Enabling Frictionless Checkout | +3.1% | National | Medium term (2-4 years) |
| Government VAT-rebate on Cross-border Purchases Below ISK 2,000 | +2.6% | National, with early gains in Reykjavik | Medium term (2-4 years) |
| Iceland Post's Same-Day Reykjavik Network | +2.1% | Reykjavik metropolitan area | Short term (≤ 2 years) |
| Tourism-Driven Demand for Icelandic Niche Goods Online | +1.7% | National, with concentration in tourist destinations | Medium term (2-4 years) |
| Source: Mordor Intelligence | |||
Hyper-digitised Population with 99.8% Internet Penetration
Universal high-speed connectivity has produced digitally fluent shoppers who comfortably execute end-to-end purchases on smartphones, driving 72% of 2024 online sales. The state-backed Digital Iceland program deepened this readiness, with 38% of citizens adopting the government service app and 60% of driving licences now digital.[2]AWS Institute, “Iceland's Digital Modernizers Collaborate to Innovate,” d1.awsstatic.com Such infrastructure enables merchants to scale traffic without heavy customer-education costs and supports rapid diffusion of emerging formats like live shopping.
Universal Bank-ID Adoption Enabling Frictionless Checkout
Bank-ID, embedded across public and private services, streamlines log-ins and reduces payment friction, shrinking cart abandonment. The central Fast Payment System clears ISK payments in under 40 milliseconds and operates round-the-clock with zero downtime since launch.[3]World Bank, “Case Study: Iceland Fast Payment System,” fastpayments.worldbank.org Plans to pilot a rafkróna digital currency promise to embed instant settlement directly into the checkout flow, potentially lifting conversion and merchants’ working-capital efficiency.
Government VAT-Rebate on Cross-Border Purchases Below ISK2,000
The 24% standard VAT ordinarily lifts import prices, yet the rebate for low-value consignments removes that hurdle and spurs frequency of small-ticket overseas orders. International sellers of accessories and specialty foods have gained share, compelling domestic retailers to refine loyalty perks and private-label strategies to offset price gaps.
Iceland Post’s Same-Day Reykjavik Network
Posturinn’s dense urban routes enable same-day drops that overseas rivals struggle to match. For perishables and meal kits, this reliability directly shields repeat-purchase rates. Pending postal reforms that shift deliveries to community locker hubs could further cut last-mile cost and emissions, prompting merchants to recalibrate fulfilment options.
Restraints Impact Analysis*
| Restraint | (~) % Impact on CAGR Forecast | Geographic Relevance | Impact Timeline |
|---|---|---|---|
| Small Domestic Customer Base Limits Economies of Scale | -2.1% | National | Long term (≥ 4 years) |
| Volatile Air-freight Costs Owing to Weather & Volcanic Disruptions | -1.7% | National, with greater impact on remote regions | Medium term (2-4 years) |
| High Import Duties on Non-EEA Parcels ≥ ISK 10,000 | -1.1% | National | Medium term (2-4 years) |
| Source: Mordor Intelligence | |||
Small Domestic Customer Base Limits Economies of Scale
With fewer than 400,000 residents, local order volume can seldom amortize platform, marketing, and fulfilment investments. Operators therefore pivot to cross-border sales and membership schemes to lift average revenue per user. Fiscal tightening measures such as kilometre-based taxation may also temper discretionary spending, heightening the urgency of geographic diversification.
Volatile Air-Freight Costs Owing to Weather & Volcanic Disruptions
Unpredictable storms and ash clouds inflate shipping premiums and lengthen delivery windows beyond the usual 5-7 days to Europe, impacting SKUs with low margins or freshness requirements. Firms mitigate by holding buffer stock in key EU hubs and shifting slow-moving items to sea freight, though that strategy ties up capital.
*Our forecasts treat driver/restraint impacts as directional, not additive. The impact forecasts reflect baseline growth, mix effects, and variable interactions.
Segment Analysis
By Business Model: B2B Segment Accelerates Beyond Consumer Market
Iceland e-commerce market for B2C stood at 84.40% Iceland e-commerce market share in 2025, yet B2B digital trade is predicted to grow 14.34% annually to 2031, surpassing the mainstream channel. Public and private tenders increasingly specify e-procurement, shifting overall purchase cycles online.
Large hospitality chains now source perishables via integrated portals that reconcile invoices directly with accounting software, compressing payables lead time. Cloud-based marketplaces facilitate cross-dock consolidation, cutting inbound freight charges for small wholesalers. Alignment of VAT rules with EU place-of-supply standards from 2026 is anticipated to streamline compliance and encourage more SMEs to adopt e-procurement.


By Device Type: Mobile-First Strategy Reshapes User Experience
Mobile commerce processed 71.35% of transactions in 2025 and is rising at 13.55% CAGR, underscoring a decisive shift in shopper behavior. Responsive sites with biometric log-ins are now baseline, while in-app push campaigns drive higher order frequency.
Desktop maintains relevance for complex purchases such as multi-item B2B carts, but conversion lags mobile on fashion and grocery baskets. Wearables and in-car interfaces remain nascent; however, 5G rollout across major routes positions them for future growth. A potential rafkróna CBDC native to mobile wallets could further accelerate mobile checkout penetration.
By Payment Method: Digital Wallets Disrupt Card Dominance
Cards retained 50.20% share of 2025 online payments, yet wallet transactions are growing 17.95% each year. Tokenized wallet rails enhance security and support one-tap mobile orders, crucial for impulse purchases.
Bank transfers serve B2B invoices, while BNPL providers capture millennials seeking budgeting flexibility. The CBDC exploration aims to reduce cross-border fees and settlement delay, potentially lowering merchant service charges and inviting greater small-ticket volume.
By B2C Product Category: Food & Beverages Outpace Traditional Leaders**
Fashion & Apparel generated 27.45% of 2025 turnover, but Food & Beverages is on track for the fastest 14.31% CAGR. Grocery chains deploy dark-store picking and chilled lockers, raising delivery reliability and basket value.
Consumer Electronics holds solid rank supported by franchise operator Elko, while Beauty and DIY categories cultivate subscription programs to stabilize demand. Tourists sustain overseas reorder flows for wool and skincare, extending category life-cycle revenue.
Geography Analysis
Reykjavik accounted for more than 60.20% of the Iceland e-commerce market in 2025 thanks to population density, 1-day delivery, and the prevalence of digital wallets at checkout. Same-day coverage allows grocers to capture evening meal orders and electronics retailers to promise next-day repairs, cementing loyalty.
Beyond the capital, the West and North regions show mid-teen growth as logistics routes improve; rural households increasingly rely on online channels for specialty items unavailable locally. Delivery windows of 2-3 days remain acceptable for apparel and books but hinder perishable categories, sparking trials of community freezer hubs.
Internationally, outbound cross-border sales help local merchants magnify scale. Orders to the EU enjoy duty-free treatment under EEA terms, while shipments to North America rely on air-freight capacity tied to tourism passenger volumes. Conversely, inbound higher-value non-EEA parcels face the ISK10,000 (USD 82.5) duty barrier, moderating average-ticket size yet encouraging frequency of micro-orders.
Competitive Landscape
The Iceland e-commerce market features a blend of global marketplaces and agile domestic specialists. Amazon and eBay serve cross-border segments, leveraging price breadth; however, local players such as Heimkaup differentiate through curated Icelandic SKUs and next-day delivery promises. Elko’s 2024 revenue rose 2.5% to NOK 47.15 billion (USD 4.5 billion) and the chain scales click-and-collect to keep freight costs predictable.
Samkaup pioneers online grocery since 2017 and now layers recipe-based baskets to raise unit economics. Fintech startups simplify multi-currency settlement, critical for exporters of niche goods. Meanwhile, the government’s crackdown on unsafe imports from ultralow-cost apps like Temu elevates compliance overhead, benefiting established retailers with documented supply chains.
Private-equity capital is entering: the EIF’s EUR 30 million (USD 33 million) allocation to Alfa Framtak’s new fund seeks to scale logistics tech and sustainability-oriented SMEs, signaling confidence in the addressable upside. Overall, competition centres on order-to-door speed, payment optionality, and depth of Iceland-branded assortments.
Iceland E-commerce Industry Leaders
Amazon.com, Inc.
Inter IKEA Systems B.V
Elko ehf
eBay Inc.
ASOS plc
- *Disclaimer: Major Players sorted in no particular order

Recent Industry Developments
- May 2025: The Environment Ministry detailed coordinated Nordic measures to hold payment providers and shippers accountable for non-compliant imports, aiming to level safety standards and protect local merchants.
- April 2025: The European Investment Fund committed EUR30 million (USD33 million) to Alfa Framtak’s AF3 private-equity vehicle, targeting digital transformation plays including fulfilment automation and cross-border warehousing.
- March 2025: The IMF Article IV mission projected a 1.3% fiscal deficit and highlighted taxation shifts that could raise last-mile fuel costs, informing merchants’ pricing strategy.
- February 2025: Íslandsbanki underscored heavy investment in personalised digital services and data infrastructure, strengthening credit pipelines for e-commerce SMEs.


Iceland E-commerce Market Report Scope
The Iceland e-commerce market is segmented by B2C e-commerce (beauty and personal care, consumer electronics, fashion and apparel, food and beverage, furniture and home), and B2B e-commerce.
By Business Model
| B2C |
| B2B |
By Device Type
| Smartphone / Mobile |
| Desktop and Laptop |
| Other Device Types |
By Payment Method
| Credit / Debit Cards |
| Digital Wallets |
| BNPL |
| Other Payment Method |
By B2C Product Category
| Beauty and Personal Care |
| Consumer Electronics |
| Fashion and Apparel |
| Food and Beverages |
| Furniture and Home |
| Toys, DIY and Media |
| Other Product Categories |
| By Business Model | B2C |
| B2B | |
| By Device Type | Smartphone / Mobile |
| Desktop and Laptop | |
| Other Device Types | |
| By Payment Method | Credit / Debit Cards |
| Digital Wallets | |
| BNPL | |
| Other Payment Method | |
| By B2C Product Category | Beauty and Personal Care |
| Consumer Electronics | |
| Fashion and Apparel | |
| Food and Beverages | |
| Furniture and Home | |
| Toys, DIY and Media | |
| Other Product Categories |


Key Questions Answered in the Report
What is the current size of the Iceland e-commerce market?
It is valued at USD1.19 billion in 2026 and is projected to double to USD2.29 billion by 2031.
Which segment is growing fastest in the Iceland e-commerce market?
B2B digital commerce is expanding at a 14.34% CAGR, outpacing the consumer channel.
How important is mobile shopping in Iceland?
Mobile accounts for 71.35% of transactions and is still rising at 13.55% annually, making a mobile-first strategy essential.
What payment methods are gaining ground?
Digital wallets are the quickest-growing method, posting an 17.95% CAGR, although cards remain the single largest medium.
How do government policies influence cross-border shopping?
A VAT rebate on imports under ISK 2,000 (USD 16.47) encourages small-value overseas orders, while duties on parcels above ISK 10,000 (USD 82.37) temper larger purchases.
Which product categories present the best growth prospects?
Food & Beverages leads growth at 14.31% CAGR due to improved cold-chain logistics and changing consumer preferences.
Page last updated on:


