Digital Goods Market Size and Share
Market Overview
| Study Period | 2020 - 2031 |
|---|---|
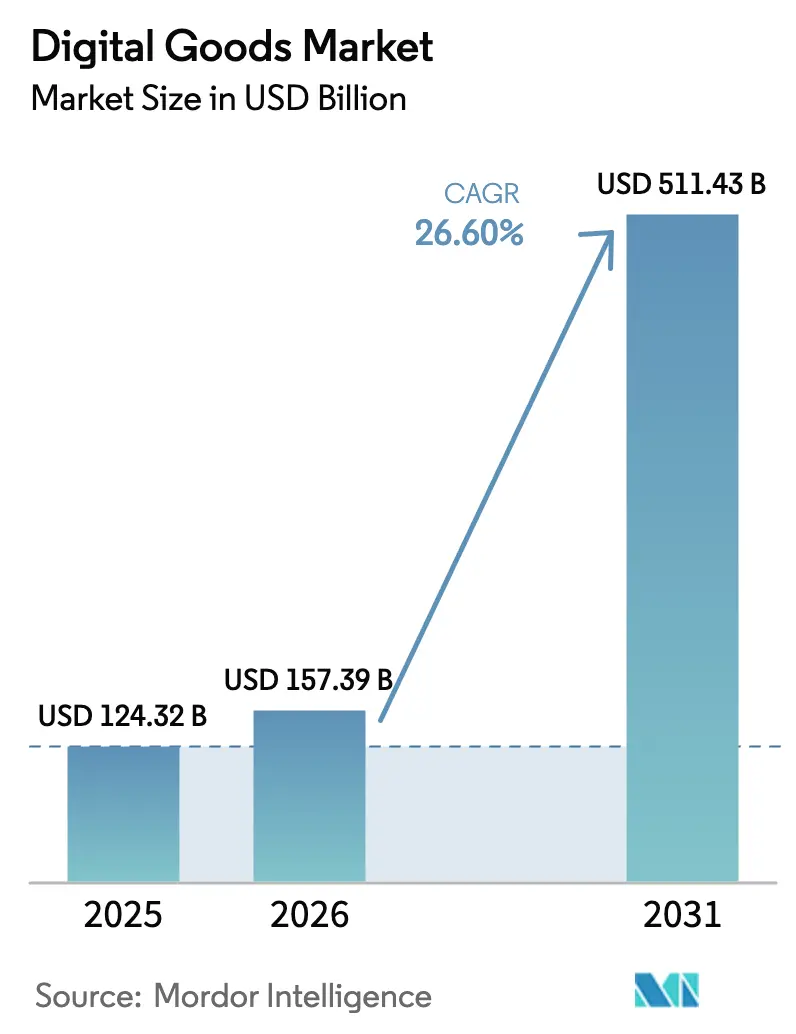
| Market Size (2026) | USD 157.39 Billion |
| Market Size (2031) | USD 511.43 Billion |
| Growth Rate (2026 - 2031) | 26.60% CAGR |
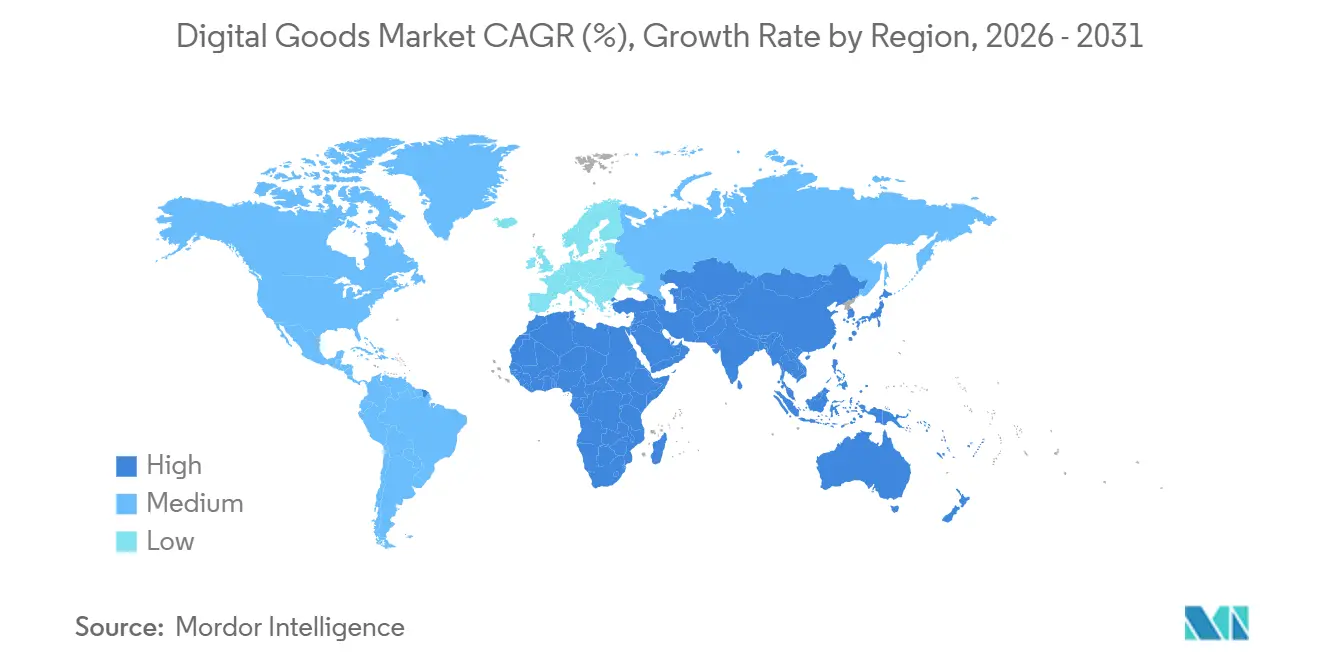
| Fastest Growing Market | Asia Pacific |
| Largest Market | North America |
| Market Concentration | Medium |
Major Players *Disclaimer: Major Players sorted in no particular order Image © Mordor Intelligence. Reuse requires attribution under CC BY 4.0. | |
Digital Goods Market Analysis by Mordor Intelligence
The digital goods market size was valued at USD 124.32 billion in 2025 and estimated to grow from USD 157.39 billion in 2026 to reach USD 511.43 billion by 2031, at a CAGR of 26.60% during the forecast period (2026-2031). Rapid smartphone penetration, cloud-first gaming, and the rising monetisation of creator-led ecosystems are widening revenue pools across entertainment, education, and productivity content. Regulation that lowers app-store barriers is drawing new entrants while forcing incumbents to rethink commission structures, especially in the European Union. Blockchain-enabled ownership models such as non-fungible tokens are unlocking secondary trading opportunities and reshaping lifetime value calculations for digital assets. Finally, telco-bundled offers in mobile-first economies are accelerating paid adoption in regions that once relied on ad-supported or pirated content.
Key Report Takeaways
- By type, online games and virtual goods captured 37.45% of digital goods market share in 2025; the segment is forecast to expand at a 28.9% CAGR through 2031.
- By payment model, subscriptions held 56.20% of digital goods market share in 2025, whereas alternative payment models are set to grow at a 30.1% CAGR to 2031.
- By device, smartphones and tablets accounted for 62.10% share of the digital goods market size in 2025, while the other devices category is projected to rise at a 24.6% CAGR.
- By gender, male consumers represented 51.30% share of the digital goods market size in 2025; the other genders segment is advancing at a 30.85% CAGR to 2031.
- By geography, North America led with 32.40% revenue share in 2025, and Asia-Pacific is forecast to record the highest regional CAGR at 26.9% through 2031.
Note: Market size and forecast figures in this report are generated using Mordor Intelligence’s proprietary estimation framework, updated with the latest available data and insights as of 2026.
Global Digital Goods Market Trends and Insights
Drivers Impact Analysis*
| Driver | (~) % Impact on CAGR Forecast | Geographic Relevance | Impact Timeline |
|---|---|---|---|
| Explosive Mobile-First Adoption in Emerging Asia-Pacific | +6.8% | Asia-Pacific, with spillover to MEA | Medium term (2-4 years) |
| Monetisation of Creator-Economy Marketplaces (e.g., NFTs, in-app tipping) | +6.0% | Global, with concentration in North America and East Asia | Medium term (2-4 years) |
| Cloud-Gaming and Cross-Platform Play Catalysing In-Game Purchases | +5.5% | North America, Europe, East Asia | Short term (≤ 2 years) |
| Audio-Streaming Bundling with Podcast and Audiobook Add-ons | +4.9% | North America, Europe | Medium term (2-4 years) |
| Regulatory Push for e-Books in K-12 EdTech in North America and Nordics | +4.1% | North America, Nordic countries | Long term (≥ 4 years) |
| Telco-Bundled Subscription Models Driving Uptake in MEA | +3.3% | Middle East and Africa | Medium term (2-4 years) |
| Source: Mordor Intelligence | |||
Explosive Mobile-First Adoption in Emerging Asia-Pacific
Surging smartphone ownership has placed 3.1 billion mobile subscribers—72% of regional population—online by 2025. [1] GSMA, “The Mobile Economy Asia Pacific 2024,” gsma.com Friction-free carrier billing lets first-time customers purchase premium games, music, and learning apps without credit cards, lifting conversion rates for local and global publishers. Streaming platforms tailor lower-price micro-packs to suit varying disposable incomes, while short-form content optimised for low-bandwidth environments keeps churn in check. Regional developers such as Tencent localise storylines and payment bundles, further entrenching mobile in daily media habits. As 5G rolls out across Indonesia, India, and the Philippines, higher bandwidth catalyses migration from casual titles to cloud-delivered AAA experiences, raising average revenue per paying user.
Monetisation of Creator-Economy Marketplaces
Direct-to-fan platforms now enable video-game modders, podcasters, and independent educators to retain a larger share of revenue. In gaming, micro-transactions already generate the majority of publisher income, and tipping features on live-streaming portals are widening earnings for individual creators. NFTs secure verifiable digital ownership and allow perpetual royalty tracking, which encourages artists to issue limited-run collectibles that appreciate in secondary markets. Major record labels have begun licensing catalogue fragments for fractional ownership sales, diversifying income beyond streaming royalties. As Gen Z prioritises authenticity, brands are co-creating in-app merchandise alongside influencers, driving incremental spend without heavy user-acquisition budgets.
Cloud-Gaming and Cross-Platform Play Catalysing In-Game Purchases
Edge servers combined with 5G latency reductions remove hardware hurdles, letting mid-tier smartphones run console-quality titles. Cross-platform progression means a cosmetic item bought on mobile appears instantly on PC or console, lifting purchase intent. Cooperative gameplay accounted for 46% of copies sold on Steam in 2024. [2]devtodev, “Game Market Overview,” devtodev.com Publishers leverage this engagement by offering season passes that bundle skins, experience boosts, and event access, generating predictable revenue arcs. Hardware makers are responding with Bluetooth controllers designed for cloud services, further smoothing onboarding. The model expands lifetime value as players invest continuously rather than in one-off boxed titles.
Audio-Streaming Bundling with Podcast and Audiobook Add-Ons
Podcast advertising revenue jumped 26.4% in 2024, [3] Insider Radio, “Podcast Ad Spend Accelerates,” insideradio.com breaching USD 2 billion. Music services respond by integrating audiobooks and exclusive talk content into single subscriptions, elevating average revenue per user. Bundling reduces churn because listeners shift seamlessly between formats during commutes, workouts, and household routines. Dynamic ad-insertion plus first-party user data improves targeting, boosting CPMs for advertisers. Labels are experimenting with bundled concert presales inside streaming apps, creating a flywheel that links recorded and live revenues. The model positions audio platforms as comprehensive entertainment destinations rather than commodity music libraries.
Restraints Impact Analysis*
| Restraint | (~) % Impact on CAGR Forecast | Geographic Relevance | Impact Timeline |
|---|---|---|---|
| Consumer Fatigue from Subscription Stacking in OECD Markets | -4.9% | North America, Europe, Australia | Short term (≤ 2 years) |
| Rising App-Store Commission Scrutiny and Alternative Billing Mandates | -4.1% | Global, with concentration in EU and US | Medium term (2-4 years) |
| Piracy Surge in "Unlimited" Digital Libraries Hinders the Market | -3.3% | Global, with higher impact in emerging markets | Medium term (2-4 years) |
| Fragmented Digital-Asset Standards Hindering Cross-Platform Portability | -2.7% | Global | Long term (≥ 4 years) |
| Source: Mordor Intelligence | |||
Consumer Fatigue from Subscription Stacking in OECD Markets
The average U.S. household spends USD 924 annually on media subscriptions, prompting 33% of consumers to plan cutbacks. Households juggle up to four video or game services, amplifying perceived overlap and driving churn. Aggregator super-bundles are re-emerging, but lower per-service pricing compresses margins unless usage-based models offset revenue loss. Loyalty programmes that integrate commerce vouchers show early promise in containing cancellations. Still, value-seekers migrate to ad-supported tiers, reducing immediate cash flow, even as it opens new ad sales inventory for platforms.
Rising App-Store Commission Scrutiny and Alternative Billing Mandates
The EU Digital Markets Act obliges gatekeepers to allow external payment links. Apple’s compliance framework still charges a service fee, but developers now manage tax, refunds, and security, raising operational costs. Parallel lawsuits in the United States intensify uncertainty, delaying product roadmaps that rely on in-app purchases. Payment-service providers see an opportunity to sign direct agreements, but must also assume fraud-screening liability. Short term, consumers face multiple checkout flows, potentially harming conversion rates; long term, lowered platform fees could widen margins for content creators that scale their own billing pipes.
*Our forecasts treat driver/restraint impacts as directional, not additive. The impact forecasts reflect baseline growth, mix effects, and variable interactions.
Segment Analysis
By Type: Online Games Sustain Leadership Amid Content Convergence
Online games and virtual goods generated the single-largest revenue pool, holding 37.45% of digital goods market share in 2025. The segment is forecast to expand at 28.9% CAGR, ensuring it remains the primary growth engine for the digital goods market. Publishers are doubling down on live-service titles that drip seasonal content, which spreads development costs across multi-year windows and lifts average spend per user. Esports leagues are widening audiences that previously engaged only via passive viewership, translating fandom into micro-transaction uptake. Generative AI accelerates level design and character creation, shortening go-to-market timelines and freeing studios to test niche narratives. Regulatory approval of cross-border virtual-item trading in South Korea signals new liquidity channels for skins and collectibles, potentially mirroring stock-market style secondary activity. The segment’s competitive intensity is rising as console stalwarts port back catalogues to cloud services, targeting mobile-first gamers who never owned dedicated hardware. Developers also explore dynamic pricing that adapts to regional purchasing-power parity, strengthening monetisation in emerging economies without sparking arbitrage.
Complementary segments are converging around interactive storytelling. Digital music platforms license gaming soundtracks as exclusive playlists, while audiobook publishers experiment with choose-your-own-adventure formats that leverage branching narratives familiar to gamers. Such cross-media experiences fuel bundled offers that raise retention across verticals. As creators repackage assets into mixed-reality settings, intellectual-property owners can amortise development expense across multiple categories, reinforcing the flywheel that underpins the broader digital goods market.


By Payment Model: Subscriptions Remain Dominant but Alternatives Scale Quickly
Subscriptions controlled 56.20% of the digital goods market in 2025, reflecting their stable recurring-revenue appeal to both investors and operators. The subscription economy has grown 435% over the past decade, and at current traction the digital goods market size tied to subscriptions is projected to exceed USD 3 trillion in 2025. Family plans, student discounts, and device-bundled trials all lower entry barriers, in turn powering network effects for social and cloud features. However, emerging markets showcase different behaviours: prepaid wallet credits and telco carrier billing allow consumers to sample premium tiers without long-term contracts. Alternative payment models—including pay-per-use, lifetime licences, and dynamic micro-transactions—are forecast to outpace subscriptions at a 30.1% CAGR, trimming the latter’s share over time. Regulatory interventions that force transparent cancellation flows also curb involuntary churn defences, pushing platforms to optimise content release calendars around renewal cycles.
Stablecoins and token-gated access are entering mainstream use within games and collectibles. These blockchain-predicated options enable global reach without traditional card networks, cutting settlement fees and improving cross-border accessibility. Some publishers now airdrop trial content to crypto wallets, driving near-zero acquisition cost in Web3-savvy communities. Payment diversity ultimately positions the digital goods market to serve heterogeneous consumer preferences rather than defaulting to a single billing paradigm.
By Device: Mobile Extends Reach While New Form-Factors Gain Traction
Smartphones and tablets represented 62.10% of the digital goods market revenue in 2025. Daily mobile screen time surpasses four hours in many economies, anchoring discovery funnels for games, music, ebooks, and productivity tools. Integrated biometric authentication and one-click wallets reduce checkout friction, pushing average conversion rates above desktop benchmarks. The digital goods market size attributable to mobile screens is poised to keep expanding as 5G-enabled cloud compute streams console-grade visuals without on-device silicon, reducing the performance gap between handset tiers.
The other devices category, encompassing smart TVs, wearables, connected cars, and mixed-reality headsets, is projected to post a 24.6% CAGR, adding meaningful incremental reach by 2031. Smart-watch users already purchase meditation content and audiobooks tailored to short, glanceable sessions. In-vehicle infotainment systems bundle games and streaming apps for passengers, forming an additional subscription touchpoint. Vision-pro class headsets, despite limited unit volume, command premium price points that inflate average transaction values, illustrating how diverse hardware unlocks new consumption contexts. Seamless profile synchronisation keeps users engaged across screens, further reinforcing lifetime value for the digital goods market.

By Gender: Inclusion Strategies Expand Addressable Spend
Male consumers accounted for 51.30% of revenue in 2025, a legacy of early gaming demographics. Nonetheless, equal participation rates between men and women in U.S. gaming demonstrate that the ceiling is artificial rather than structural. Studios now invest in robust moderation tools and diverse character representation, aiming to create safe communities that broaden engagement. Inclusive design principles correlate with longer session times and higher propensity to purchase cosmetic items among women users, partially offsetting the historical spend gap.
The other gender segment, covering non-binary and gender-fluid identities, records the fastest growth at a 30.85% CAGR. Brands that authentically represent LGBTQ+ communities enjoy elevated loyalty metrics; 40% of Gen Z gauge inclusivity as a buying factor. As language preferences and avatar customisation options expand, this cohort is translating visibility into sustained transactions across content types. The convergence of social audio and digital fashion enables users to express identity beyond traditional binary frameworks, encouraging incremental spending in virtual environments. The result is a structural uplift in the total addressable audience for the digital goods market, underscoring inclusivity as both a social imperative and a commercial opportunity.
Geography Analysis
North America generated 32.40% of 2025 revenue, underpinned by high disposable income and ubiquitous broadband. Eighty-three percent of U.S. households subscribe to at least one video-on-demand service, and digital wallets handled 31% more transactions in 2023 than the prior year. Antitrust scrutiny, exemplified by the 2024 Department of Justice lawsuit targeting Apple, may open additional distribution channels as platform exclusivity eases, leading to more price competition and potentially lower barriers to entry for mid-tier creators.
Asia-Pacific is the fastest-growing region with a projected 26.9% CAGR through 2031. China’s gaming industry generated CNY 147.26 billion (USD 20.7 billion) in sales in 2024, 73.01% of which came from mobile formats. Regional super-apps integrate payments, social feeds, and streaming, cementing user lock-in and raising switching costs. India’s Unified Payments Interface processes over 10 billion transactions monthly, illustrating how real-time settlements enable micro-transaction-driven models. Telco partnerships that bundle game passes with data plans further compress acquisition costs across Southeast Asia’s price-sensitive segments, expanding the digital goods market.
Europe balances opportunity with regulatory complexity. The Digital Markets Act introduces side-loading rights, reducing store commissions yet imposing compliance overhead on security and privacy. Cash still accounted for 52% of point-of-sale spend in 2024, but online transaction share rose to 21%, signalling accelerating behavioural change. Nordic governments fund e-textbook adoption in K-12 curricula, propelling digital reading formats. Meanwhile, stringent data-protection rules compel publishers to adopt anonymised analytics, delaying feature deployment but safeguarding consumer trust—an essential currency in the digital goods market.
Latin America showcases youthful demographics and high social-media uptake, supporting a 22% e-commerce growth forecast between 2023 and 2026. Brazil’s Pix instant-payment network processed more transactions in 2024 than credit and debit cards combined, enabling sub-USD purchases that underpin episodic content models. Content localised to regional dialects and affordable pricing tiers resonates strongly, though currency volatility necessitates dynamic hedging strategies for multinational providers.
The Middle East and Africa leverage telco billing to leapfrog traditional card infrastructure. Operators bundle streaming and cloud-gaming passes with data plans, capturing subscribers in countries where bank-account penetration trails smartphone ownership. Turkey’s gaming revenue reached USD 580 million in 2023, evidencing resilience despite macroeconomic headwinds. Local studios increasingly collaborate with global publishers, exporting culturally relevant IP and importing monetisation frameworks, further expanding the digital goods market footprint.

Competitive Landscape
Incumbent ecosystems Apple, Google, Amazon, and Microsoft continue to anchor consumer access through operating systems, stores, and cloud backbones. Apple captured more than 50% of 2024 VR headset revenue despite shipping only 350,000 units, proving the leverage of premium hardware tied to a frictionless content store. Amazon doubles down on its Prime flywheel, integrating games and audiobooks to nurture retention beyond retail margins. Microsoft’s acquisition strategy augments Game Pass with first-party titles, creating a moat that extends into PC, console, and cloud endpoints.
Disruptors exploit regulatory tailwinds and alternative billing. Epic Games pushes its self-serve launcher onto mobile, challenging 30% fee structures with litigation and cross-platform network effects. ByteDance’s TikTok Shop experiments with direct content tipping, converting attention to revenue without legacy storefronts. Unity and Adobe invest in AI tooling that auto-generates assets, lowering production costs and courting independent creators away from closed ecosystems. Cross-platform identity standards remain fragmented, but early alliances between blockchain wallets and game engines hint at interoperable inventories and an opening for new market entrants.
Strategic moves increasingly emphasise vertical integration. Spotify licenses audiobooks to diversify beyond music, Apple produces original films to keep Vision Pro users inside its garden, and Tencent buys minority stakes in overseas studios to secure global IP rights. M&A appetite remains strong, particularly for middleware that adds flexible payment orchestration or granular personalisation engines, signalling that control over the checkout and discovery layers will determine future bargaining power within the digital goods market.
Digital Goods Industry Leaders
Apple Inc.
Netflix, Inc.
Walt Disney Company
FastSpring, Inc.
Skillshare Inc.
- *Disclaimer: Major Players sorted in no particular order


Recent Industry Developments
- May 2025: ITG acquired PureRed to expand AI-enabled content production in omnichannel marketing.
- April 2025: The European Commission terminated its investigation into Apple’s user-choice practices after the company revised its terms. Closure reduces legal overhang for developers and signals that Brussels may focus next on systemic fee levels, compelling all gatekeepers to reassess revenue-share mechanics.
- March 2025: Global recorded music revenue reached USD 29.6 billion in 2024, up 4.8% year-on-year, with paid subscriptions climbing to 752 million. Labels are reallocating marketing budgets toward short-form video placement, illustrating how user-generated content loops amplify catalogue streams and reinforce the subscription funnel.
- March 2025: Global recorded music revenue reached USD 29.6 billion in 2024, up 4.8% year-on-year, with paid subscriptions climbing to 752 million. Labels are reallocating marketing budgets toward short-form video placement, illustrating how user-generated content loops amplify catalogue streams and reinforce the subscription funnel.


Global Digital Goods Market Report Scope
Digital goods are commodities or products that exist in a digital form, something that can be sold and consumed online. These products or services can only be purchased, transferred, and delivered online. As a result, they lack physical presence and are thus intangible.
The digital goods market is segmented by type (e-books, downloadable music, online games, other types), by gender (male, female, others), by geography (North America, Europe, Asia-Pacific, Latin America, Middle East and Africa). The market sizes and forecasts are provided in terms of value (USD) for all the above segments.
| e-Books |
| Digital Music and Podcasts |
| Video and OTT Streaming |
| Online Games and Virtual Goods |
| Other Digital Content (Stock Photos, Templates, Software Keys) |
| One-Time Purchase/Download |
| Subscription |
| Other Payment Models |
| Smartphones and Tablets |
| PCs and Laptops |
| Other Devices |
| Male |
| Female |
| Others |
| North America | United States |
| Canada | |
| Mexico | |
| Europe | United Kingdom |
| Germany | |
| France | |
| Italy | |
| Spain | |
| Rest of Europe | |
| Asia-Pacific | China |
| Japan | |
| India | |
| South Korea | |
| Rest of Asia-Pacific | |
| South America | Brazil |
| Argentina | |
| Mexico | |
| Rest of South America | |
| Middle East | United Arab Emirates |
| Saudi Arabia | |
| Turkey | |
| Rest of Middle East | |
| Africa | South Africa |
| Rest of Africa |
| By Type | e-Books | |
| Digital Music and Podcasts | ||
| Video and OTT Streaming | ||
| Online Games and Virtual Goods | ||
| Other Digital Content (Stock Photos, Templates, Software Keys) | ||
| By Payment Model | One-Time Purchase/Download | |
| Subscription | ||
| Other Payment Models | ||
| By Device | Smartphones and Tablets | |
| PCs and Laptops | ||
| Other Devices | ||
| By Gender | Male | |
| Female | ||
| Others | ||
| By Geography | North America | United States |
| Canada | ||
| Mexico | ||
| Europe | United Kingdom | |
| Germany | ||
| France | ||
| Italy | ||
| Spain | ||
| Rest of Europe | ||
| Asia-Pacific | China | |
| Japan | ||
| India | ||
| South Korea | ||
| Rest of Asia-Pacific | ||
| South America | Brazil | |
| Argentina | ||
| Mexico | ||
| Rest of South America | ||
| Middle East | United Arab Emirates | |
| Saudi Arabia | ||
| Turkey | ||
| Rest of Middle East | ||
| Africa | South Africa | |
| Rest of Africa | ||


Key Questions Answered in the Report
What is the projected value of the digital goods market by 2031?
The digital goods market is forecast to reach USD 511.43 billion by 2031, reflecting a 26.60% CAGR.
Which segment is growing fastest within the digital goods market?
Online games and virtual goods are advancing at a 28.9% CAGR, making them the fastest-growing type segment.
How dominant are subscriptions as a payment model?
Subscriptions accounted for 56.20% revenue in 2025 but face rising competition from alternative models that are growing at 30.1% CAGR.
Why is Asia-Pacific viewed as a high-growth region?
Rapid smartphone adoption, integrated mobile wallets, and super-app ecosystems drive a projected 26.9% CAGR for the region through 2031.
What impact will EU regulation have on digital goods distribution?
The Digital Markets Act mandates alternative in-app billing and side-loading, which could lower platform fees and increase competition.
How are NFTs influencing monetisation strategies?
NFTs introduce verifiable digital ownership, enabling secondary sales and perpetual royalties that diversify revenue streams for creators.
Page last updated on:


