Retail Media Networks Market Size and Share
Market Overview
| Study Period | 2020 - 2031 |
|---|---|
| Market Size (2026) | USD 25.53 Billion |
| Market Size (2031) | USD 34.73 Billion |
| Growth Rate (2026 - 2031) | 6.35% CAGR |
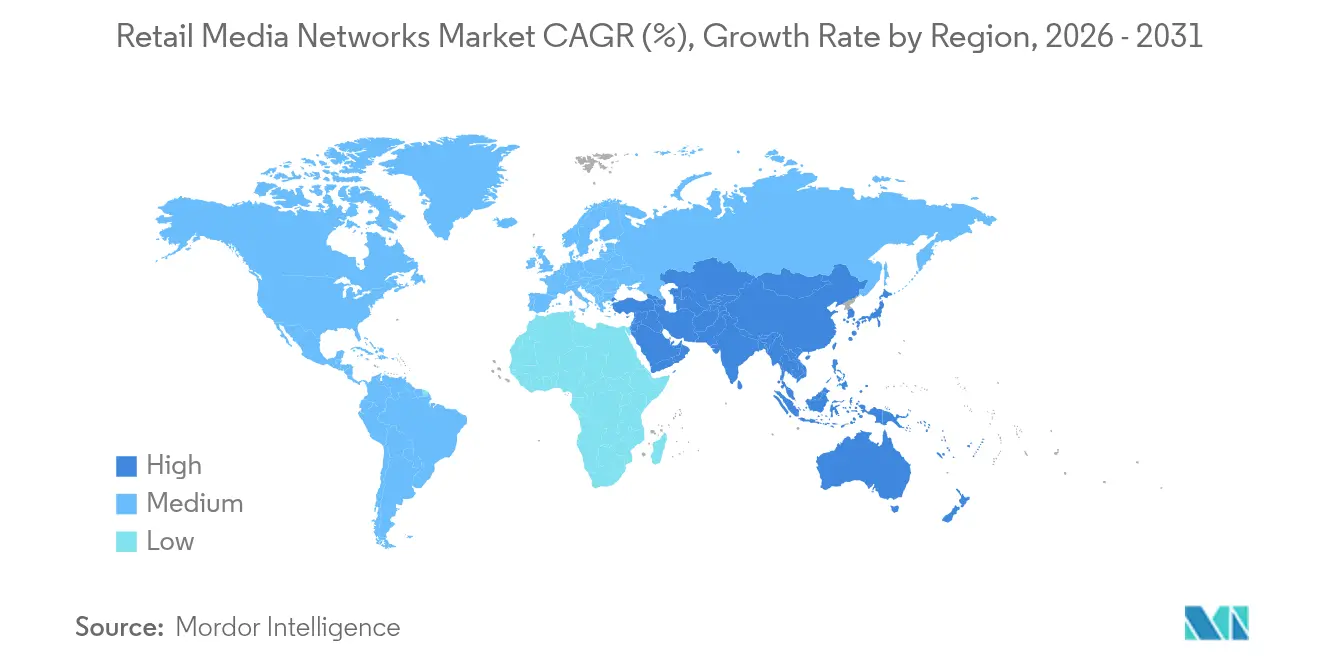
| Fastest Growing Market | Asia Pacific |
| Largest Market | North America |
| Market Concentration | Medium |
Major Players*Disclaimer: Major Players sorted in no particular order Image © Mordor Intelligence. Reuse requires attribution under CC BY 4.0. | |
Retail Media Networks Market Analysis by Mordor Intelligence
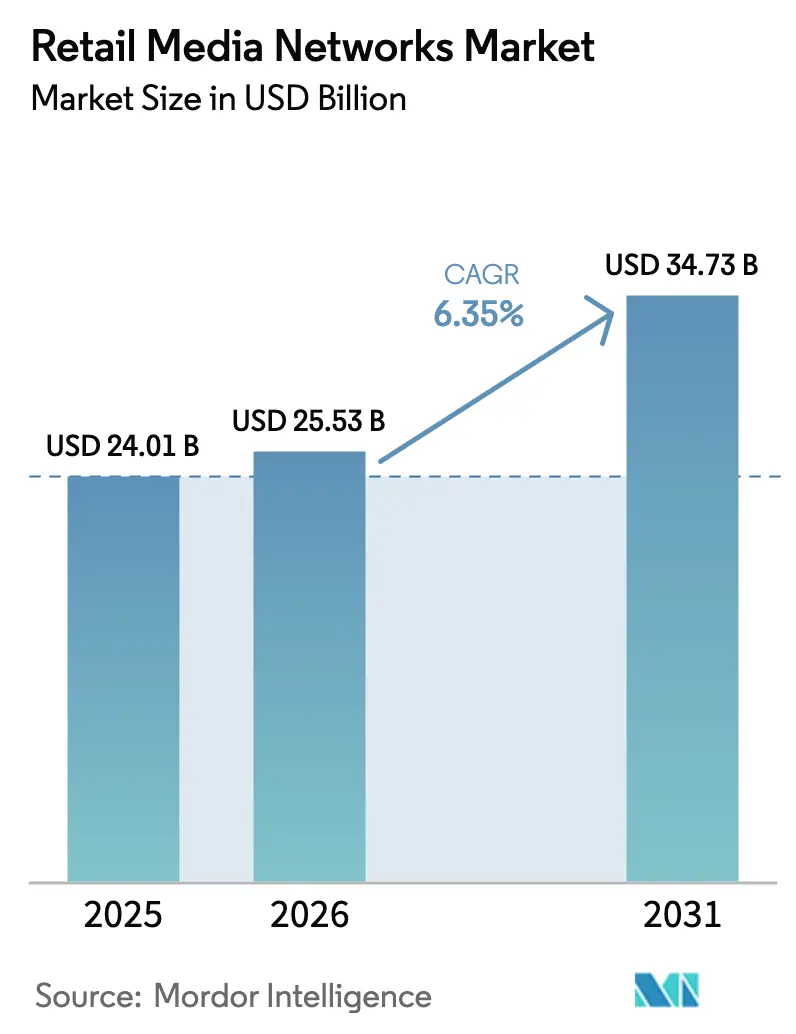
The retail media networks market size is expected to grow from USD 24.01 billion in 2025 to USD 25.53 billion in 2026 and is forecast to reach USD 34.73 billion by 2031 at 6.35% CAGR over 2026-2031. Momentum originates from retailers converting their owned digital properties into advertising inventory that capitalizes on authenticated first-party data, precision targeting, and closed-loop measurement. Rising omnichannel shopping, trade-promotion budget shifts toward digital shelves, and the growing appeal of video formats strengthen the commercial case for these networks. Amazon remains the scale leader, yet accelerating launches by Walmart, Target, and grocery banners worldwide are broadening competitive intensity. Strategic tie-ups with demand-side platforms (DSPs) are extending first-party data into connected-TV environments, giving advertisers a route to reach audiences beyond retailer websites while preserving determinism on outcomes.
Key Report Takeaways
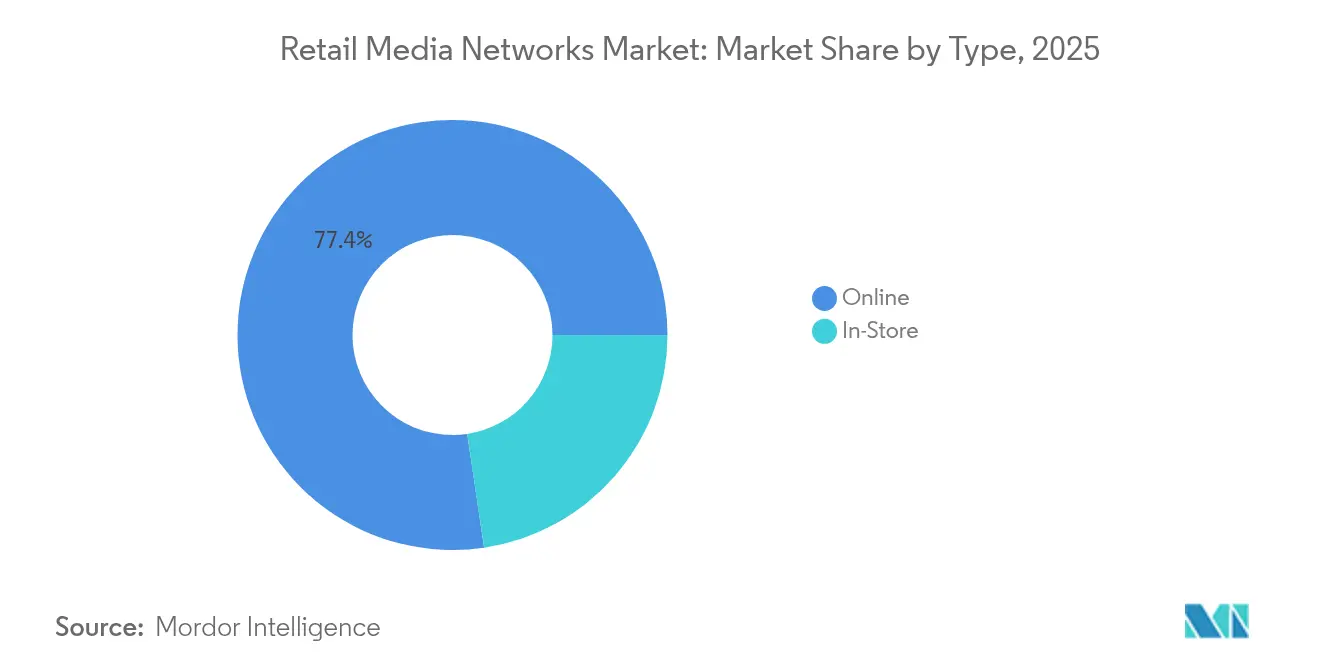
- By type, online placements led with 77.35% of the retail media networks market share in 2025, whereas in-store inventory is forecast to expand at an 11.62% CAGR through 2031.
- By advertising format, display commanded 44.55% revenue share in 2025; video is projected to accelerate at a 11.78% CAGR to 2031.
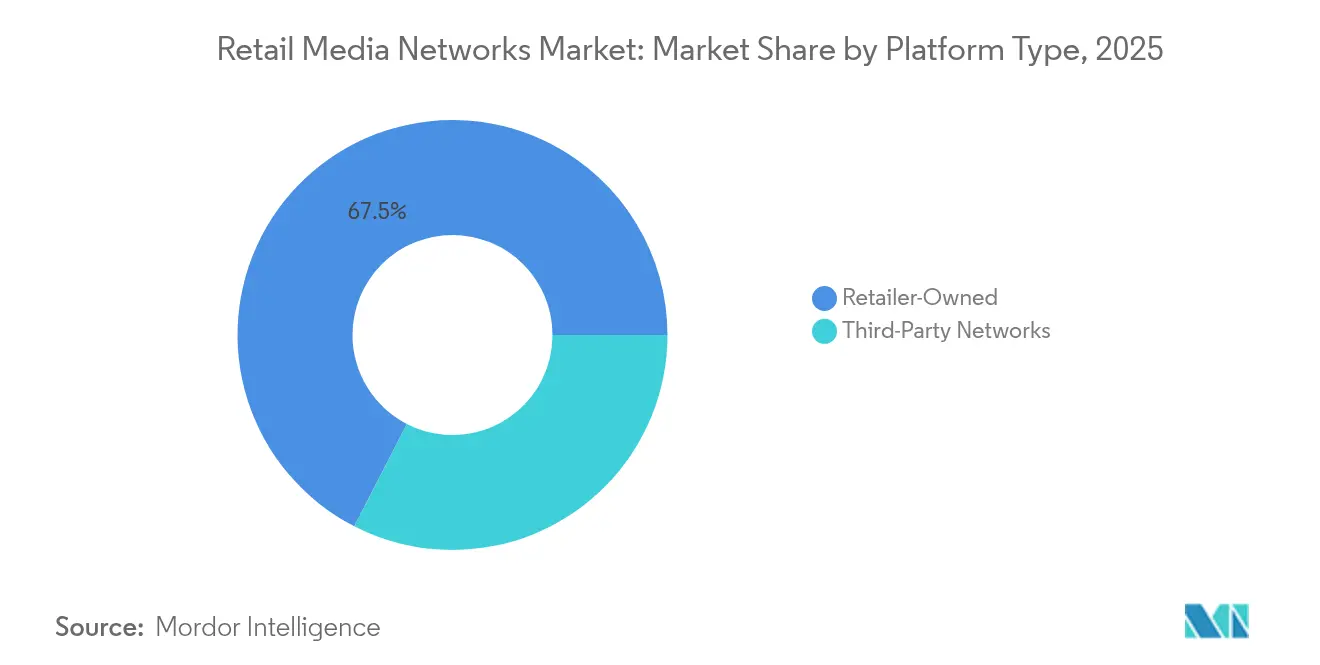
- By platform type, retailer-owned networks held 67.45% share of the retail media networks market size in 2025, while third-party aggregators are poised to grow at 9.07% CAGR over 2026-2031.
- By vertical, consumer packaged goods captured 25.75% of 2025 spend, whereas beauty and personal care is on track to post a 9.39% CAGR.
- Amazon, Walmart Connect, and Roundel collectively controlled nearly 40% of global spend in 2024, underscoring a moderately concentrated competitive field Marketing Brew.
Note: Market size and forecast figures in this report are generated using Mordor Intelligence’s proprietary estimation framework, updated with the latest available data and insights as of 2026.
Global Retail Media Networks Market Trends and Insights
Drivers Impact Analysis*
| Drivers | (~) % Impact on CAGR Forecast | Geographic Relevance | Peak Impact |
|---|---|---|---|
| First-party Data De-prioritization of Third-party Cookies Accelerating RMN Budgets in North America | +1.8 | North America, with spillover to Europe | Short term (≤ 2 yrs) |
| Retailer Monetization Pressure Amid Thin Commerce Margins in Europe | +1.2 | Europe, with growing relevance in Asia-Pacific | Medium term (~ 3-4 yrs) |
| Trade-promotion Re-allocation to On-site Digital Shelves Drives the Market | +0.9 | Global, with strongest impact in North America | Medium term (~ 3-4 yrs) |
| Omnichannel Linkage of In-store Digital Screens and Apps Drives the Market | +1.1 | North America and Europe | Medium term (~ 3-4 yrs) |
| Surge in Grocery-Led RMNs Post COVID "Mission" Shopping in Asia | +0.8 | Asia-Pacific, with spillover to Middle East | Short term (≤ 2 yrs) |
| Video and Connected-TV Pipes Opened via RMN DSP Partnerships | +0.7 | North America, with growing relevance globally | Long term (≥ 5 yrs) |
| Source: Mordor Intelligence | |||
First-party Data De-prioritization of Third-party Cookies Accelerating RMN Budgets in North America
Google’s July 2024 reversal on cookie deprecation only heightened advertiser urgency to lock in deterministic, retailer-sourced audiences. Brands now engage networks even when their products are not listed on the retailer to mine high-quality insights. The allure stems from the ability to match ad exposure with verified transactions in near real time, a metric traditional digital channels cannot equal. As US shoppers increasingly research online and convert in-store, advertisers lean on retail media to unify the journey and validate spend effectiveness. Brands consequently divert incremental investment toward networks supplying both scale and closed-loop analytics.
Retailer Monetization Pressure Amid Thin Commerce Margins in Europe
European retailers contend with compressed fulfillment economics that erode core profitability, prompting a pivot toward media revenue with 50-70% operating margins. Regional advertising spend is forecast to reach EUR 22.3 billion (USD 24.1 billion) in 2026 and EUR 31.3 billion (USD 33.8 billion) by 2028 WARC. Incremental profit from retail media enables chains to reinvest in price competitiveness, logistics upgrades, and loyalty innovation. Grocers such as Tesco and Carrefour are embedding AI into loyalty-powered campaigns, signaling continued acceleration.
Trade-promotion Re-allocation to On-site Digital Shelves Drives the Market
Marketers are funding retail media largely from existing shopper and trade budgets, replacing paper coupons and end-caps with dynamic banners that adjust in real time. Brands gain the flexibility to pulse offers based on stock, competitor moves, and contextual data, while receiving SKU-level lift analysis within hours. The responsiveness of the digital shelf, coupled with performance transparency, is cementing retail media as a core activation channel at the point of purchase.
Omnichannel Linkage of In-store Digital Screens and Apps Drives the Market
Retailers are weaving mobile apps, smart carts, and connected screens into store layouts, effectively extending programmatic tactics to the aisle. In-store retail media is projected to outpace online growth through 2028 as physical locations become premium inventory that merges experiential engagement with deterministic measurement. CVS, Macy’s, and home-improvement chains now curate placements that complement rather than interrupt shopping, preserving customer experience while monetizing foot traffic.
Restraints Impact Analysis*
| Restraints | (~) % Impact on CAGR Forecast | Geographic Relevance | Peak Impact |
|---|---|---|---|
| Limited SKU–level Attribution Outside Walled Gardens | -0.9 | Global, with strongest impact in North America | Medium term (~ 3-4 yrs) |
| Media-Commerce Talent Shortage Inside Retailers Hinders the Market | -0.7 | Global, with particular impact in emerging markets | Short term (≤ 2 yrs) |
| Privacy-led Restrictions on Off-site Targeting Hinders the Market | -0.8 | Europe, with spillover to North America | Medium term (~ 3-4 yrs) |
| Source: Mordor Intelligence | |||
Limited SKU-level Attribution Outside Walled Gardens
Each network guards its own metrics and identifiers, hampering cross-platform comparability. Advertisers struggle to unify reporting and benchmark performance, risking budget fragmentation. Without industry standards, brands must stitch together disparate dashboards, lengthening decision cycles and constraining scale commitments.
Media-Commerce Talent Shortage Inside Retailers Hinders the Market
Retailers vie for specialists versed in both merchandising economics and programmatic operations. Scarcity inflates labor costs and slows roadmap execution, especially for regional chains. Many outsource to technology vendors, trading margin and data sovereignty for speed, yet this dependency can cap long-term differentiation.
*Our forecasts treat driver/restraint impacts as directional, not additive. The impact forecasts reflect baseline growth, mix effects, and variable interactions.
Segment Analysis
By Type: Online Dominates While In-Store Accelerates
Online inventory generated 77.35% of 2025 spend, reaffirming its first-mover advantage and depth of shopper behavioral data. The digital shelf has matured into an always-on, performance-measured medium that anchors most integrated campaigns. Yet in-store placements are primed to expand at 11.62% CAGR, meaning their contribution to the retail media networks market size will widen markedly. Early adopters such as CVS Media Exchange install interactive end-caps, audio messaging, and AI carts that unlock new moments of influence. Advertisers appreciate proximity to decision points and the capacity to close attribution gaps by linking loyalty scans at checkout.
Physical environments also benefit from online learnings; heat-map analytics and A/B testing of creative can now be replicated on end-cap screens. As inventory mapping and real-time bidding mature, brick-and-mortar spaces could transition from fixed-rate signage into programmatic endpoints. This evolution should attract incremental budgets from national brands seeking omnichannel frequency control and from local brands looking for precise store-level impact.


By Advertising Format: Display Leads While Video Surges
Display held 44.55% revenue in 2025, a testament to its versatility across search results, category pages, and homepages. Cost-per-click and cost-per-thousand models remain prevalent, appealing to performance-oriented advertisers eager for immediate traffic and sales signals. Video, though smaller, is forecast for a 11.78% CAGR, adding storytelling depth and brand-building capacity within the retail media networks market. Retailers have introduced short-form shoppable clips and integrated livestream showcases, driving dwell time and average order values.
Search advertising maintains its stronghold where purchase intent is explicit, particularly on marketplace structures that mirror traditional paid search yet close the loop to commerce. Native units are evolving into dynamic product collections personalized for each shopper. Generative-AI tools such as Microsoft Retail Media Creative Studio lower barriers to creative production, letting brands iterate versions tuned to product availability, seasonal hooks, and audience segments in hours rather than weeks.
By Platform Type: Retailer-Owned Networks Maintain Dominance
Retailer-owned platforms captured 67.45% share in 2025, buoyed by exclusive access to purchase data and the ability to validate outcomes. Proprietary networks also provide high-margin diversification amid margin-thin core operations. Third-party aggregators, growing at 9.07% CAGR, address advertiser pain points around fragmentation by stitching inventory from multiple retailers. Players like Criteo use AI algorithms that predict product propensity across retailers, enhancing optimization without direct access to each retailer’s data lake.
Competitive dynamics are shifting toward hybrid models: Walmart and Target keep data stewardship internal while opening pipes through approved DSPs, retaining control but widening advertiser reach. Smaller retailers frequently elect to outsource full-stack technology, trading flexibility for speed. The battlefront increasingly lies in measurement transparency and in the capacity to leverage clean rooms for privacy-by-design data collaboration.
By Industry Vertical: CPG Leads While Beauty Accelerates
Consumer packaged goods represented 25.75% of spend in 2025, leveraging a legacy of shopper marketing and retailer collaboration. CPG brands use advanced retail media analytics to optimize new-product launches, seasonal promotions, and basket-building tactics. Beauty and personal care is projected to log a 9.39% CAGR, supported by rich imagery, tutorial video, and high gross margins that justify upper-funnel investment. Brands harness retailer data to refine shade selections and personalized regimens, boosting conversion and lifetime value.
Electronics and technology brands exploit comparison engines and spec-heavy content to accelerate considered purchases. Grocery and food delivery applications dominate convenience missions; Instacart’s ads accounted for more than one-third of its Q3 2024 revenue U.S. Chamber of Commerce. Apparel and fashion merchants integrate lifestyle imagery and virtual try-on to compress the inspiration-to-purchase cycle, extending retail media’s relevance across the path to purchase.
Geography Analysis
North America held 36.62% of 2025 spend, underpinned by Amazon Advertising’s scale and Walmart Connect’s fast growth. The region’s advanced e-commerce penetration and sophisticated programmatic infrastructure foster rapid experimentation in connected-TV and loyalty-data extensions. Retailers compete on media capabilities as much as on assortment, with Walmart posting USD 4.4 billion in 2024 ad revenue Digiday. The retail media networks market size in the United States is expected to widen further as grocery, pharmacy, and specialty chains roll out newly minted networks, intensifying the scramble for differentiation in measurement rigor and inventory quality.
Asia-Pacific will record a 7.44% CAGR from 2026-2031, the fastest worldwide. China’s entrenched ecosystems around Alibaba and JD.com form the template, but India’s Flipkart and Southeast Asia’s Shopee and Lazada are spurring region-wide expansion. Social-commerce fusion, mobile wallets, and livestream selling differentiate Asia-Pacific’s trajectory, giving advertisers seamless funnels from discovery to checkout. Retailers in Korea and Japan are experimenting with autonomous-store technology that feeds real-time shopper telemetry back into ad decisioning, elevating precision.
Europe’s retail media investment is set to double to EUR 31.3 billion (USD 33.8 billion) by 2028 WARC. Regulatory frameworks prioritize contextual and first-party strategies, driving innovation in clean-room architectures that reconcile transparency with compliance. Tesco and Carrefour lead rollouts that fold loyalty-program data directly into self-service ad managers, enabling brands to execute campaigns with household-level granularity. Fragmentation persists, yet the absence of an Amazon-scale incumbent offers openings for grocers and general merchandisers to capture advertiser budgets seeking alternatives.

Competitive Landscape
The retail media networks market is moderately concentrated. Amazon captured roughly 25% of global spend and generated USD 56.2 billion in 2024 advertising revenue Marketing Brew. Walmart’s 27% year-on-year ad growth positions it as the most credible challenger, while Target’s Roundel reported USD 649 million 2025 revenue. More than 80% of the top 100 US retailers now operate networks IAB, creating a crowded field that complicates media planning and measurement. Advertisers must navigate disparate formats, fee structures, and performance metrics, prompting calls for standardization.
Strategic alliances are a defining trend. Walmart-The Trade Desk integrates first-party segments into off-site display and CTV while preserving data custody. Kroger Precision Marketing partnered with Criteo, TransUnion, and The Trade Desk to triangulate identity resolution and outcome reporting JLL. Technology differentiation is sharpening: Criteo’s AI optimization delivered a 32% CAGR in its retail media division, reinforcing its status as a scaled independent alternative. Meanwhile, smaller retailers embrace white-label solutions from CitrusAd and PromoteIQ to launch quickly, though these models often involve revenue-share arrangements that compress margin.
In-store activation capability is an emerging battleground. Macy’s tweaks floor plans to integrate screens without clutter, and home-improvement chains rebrand networks to court DIY advertisers Crafted. Measurement remains the pain point; Albertsons Media Collective proposed cross-network standards to unify lift studies and incrementality methodologies, seeking to reduce buyer friction. As competitive convergence intensifies, networks able to prove omnichannel incrementality and protect shopper experience will secure sustained allocation.
Retail Media Networks Industry Leaders
Amazon.com Inc.
Inter IKEA Systems B.V
eBay Inc.
Wayfair LLC
Criteo SA
- *Disclaimer: Major Players sorted in no particular order

Recent Industry Developments
- April 2025: EG America launched a retail media network, offering brands digital signage and SmartRewards targeting to boost in-store conversions NACS.
- April 2025: Instacart partnered with Uber, widening audience reach and enriching grocery ad inventory Adweek.
- March 2025: Walmart announced USD 4.4 billion advertising revenue, up 27% year over year, cementing its position behind Amazon Digiday.
- February 2025: Target’s Roundel posted USD 649 million revenue and outlined a path toward USD 2 billion marketing services value Marketing Brew.


Global Retail Media Networks Market Report Scope
Retail Media Networks (RMNs) serve as advertising platforms run by retailers, allowing brands to target the retailer's audience through first-party data. Common digital channels for these networks encompass retailer websites, mobile apps, email newsletters, and in-store media such as digital screens and shelf displays.
Retail media networks report is segmented by software by advertising format (display advertising, native advertising, search advertising, video advertising), by platform type (retailer-owned networks, third-party networks), by industry vertical (consumer packaged goods (CPG), electronics and technology, apparel and fashion, grocery and food delivery, beauty and personal care, and others) and by geography (North America, Europe, Asia-Pacific, Latin America, and Middle East & Africa). The market sizes and forecasts are provided in terms of value (USD) for all the above segments.
| In-Store |
| Online |
| Display Advertising |
| Search Advertising |
| Video Advertising |
| Native Advertising |
| Retailer-Owned Networks |
| Third-Party Networks |
| Consumer Packaged Goods (CPG) |
| Electronics and Technology |
| Apparel and Fashion |
| Grocery and Food Delivery |
| Beauty and Personal Care |
| Other Industry Verticals |
| North America | United States |
| Canada | |
| Mexico | |
| Europe | United Kingdom |
| Germany | |
| France | |
| Italy | |
| Spain | |
| Rest of Europe | |
| Asia-Pacific | China |
| Japan | |
| India | |
| South Korea | |
| Rest of Asia-Pacific | |
| South America | Brazil |
| Argentina | |
| Mexico | |
| Rest of South America | |
| Middle East | United Arab Emirates |
| Saudi Arabia | |
| Turkey | |
| Rest of Middle East | |
| Africa | South Africa |
| Rest of Africa |
| By Type | In-Store | |
| Online | ||
| By Advertising Format | Display Advertising | |
| Search Advertising | ||
| Video Advertising | ||
| Native Advertising | ||
| By Platform Type | Retailer-Owned Networks | |
| Third-Party Networks | ||
| By Industry Vertical | Consumer Packaged Goods (CPG) | |
| Electronics and Technology | ||
| Apparel and Fashion | ||
| Grocery and Food Delivery | ||
| Beauty and Personal Care | ||
| Other Industry Verticals | ||
| By Geography | North America | United States |
| Canada | ||
| Mexico | ||
| Europe | United Kingdom | |
| Germany | ||
| France | ||
| Italy | ||
| Spain | ||
| Rest of Europe | ||
| Asia-Pacific | China | |
| Japan | ||
| India | ||
| South Korea | ||
| Rest of Asia-Pacific | ||
| South America | Brazil | |
| Argentina | ||
| Mexico | ||
| Rest of South America | ||
| Middle East | United Arab Emirates | |
| Saudi Arabia | ||
| Turkey | ||
| Rest of Middle East | ||
| Africa | South Africa | |
| Rest of Africa | ||


Key Questions Answered in the Report
What is driving recent growth in the retail media networks market?
Brands are reallocating trade-promotion budgets toward retailer-run digital shelves, retailers are monetizing first-party data as margins thin, and video plus connected-TV extensions are opening fresh reach while maintaining closed-loop attribution.
How big is the retail media networks market in 2026?
The retail media networks market size is USD 25.53 billion in 2026 and is projected to rise to USD 34.73 billion by 2031 at a 6.35% CAGR.
Which region is expanding fastest?
Asia-Pacific will post a 7.44% CAGR between 2026 and 2031, propelled by mobile-first commerce growth and integrated social-retail ecosystems.
Why are in-store retail media placements gaining traction?
Connected screens, AI shopping carts, and loyalty-linked apps turn physical aisles into measurable advertising inventory, projected to grow at 11.62% CAGR versus overall market growth of 6.35%.
Who are the leading players?
Amazon leads with roughly 25% share, followed by Walmart Connect, Target Roundel, Kroger Precision Marketing, and independent AdTech provider Criteo.
What challenges could slow market expansion?
Measurement fragmentation across walled gardens, privacy regulations limiting off-site targeting, and a shortage of talent skilled in both merchandising and programmatic advertising can temper the market’s growth trajectory.
Page last updated on:


