Market Overview
| Study Period | 2020 - 2031 |
|---|---|
| Forecast Data Period | 2026 - 2031 |
| Historical Data Period | 2020 - 2024 |
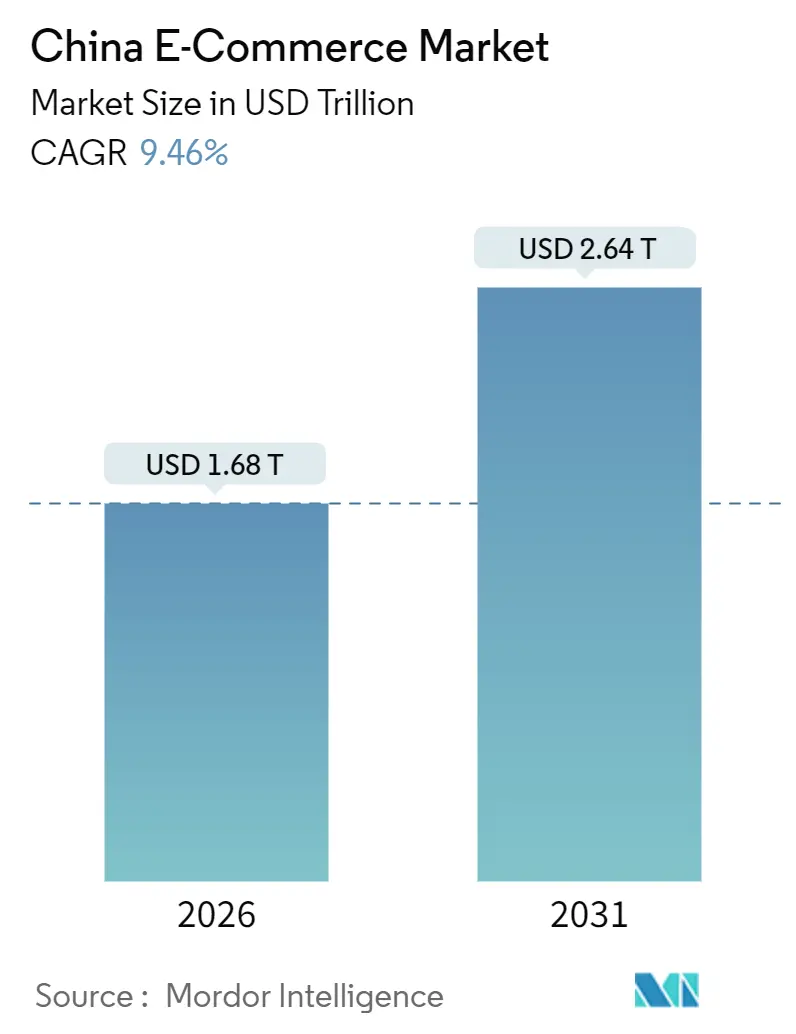
| Market Size (2026) | USD 1.68 Trillion |
| Market Size (2031) | USD 2.64 Trillion |
| Growth Rate (2026 - 2031) | 9.46% CAGR |
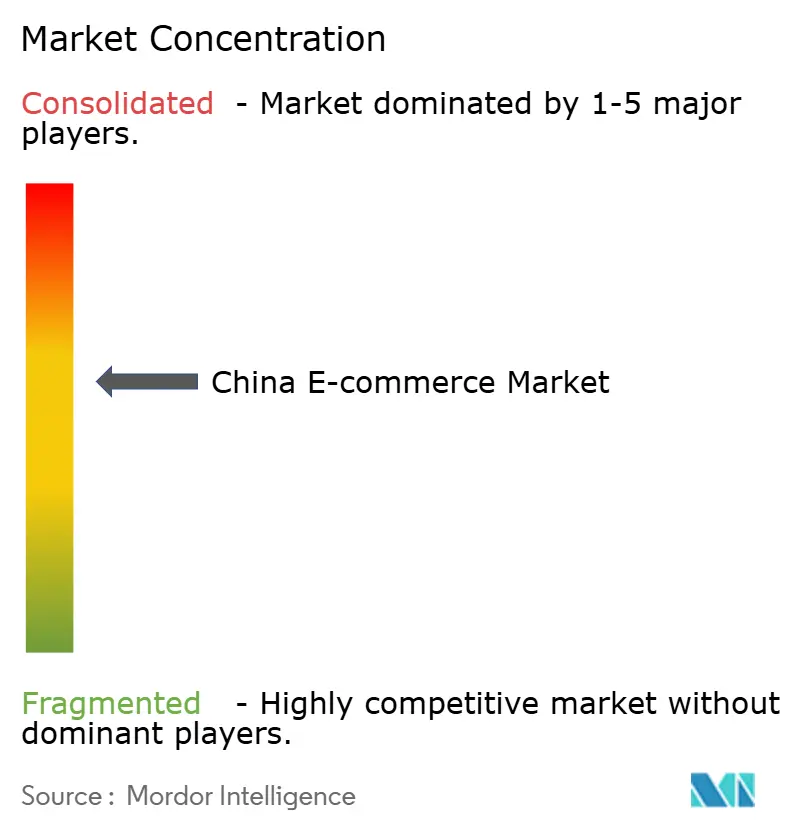
| Market Concentration | Medium |
Major Players *Disclaimer: Major Players sorted in no particular order Image © Mordor Intelligence. Reuse requires attribution under CC BY 4.0. | |
China E-Commerce Market Analysis by Mordor Intelligence
The China e-commerce market reached USD 1.68 trillion in 2026 and is projected to climb to USD 2.64 trillion by 2031, translating into a 9.46% CAGR during the forecast period. This performance places the China e-commerce market among the world’s fastest-expanding large digital retail arenas, driven by live-stream shopping, cross-border duty exemptions and same-day grocery fulfillment. A pivot from saturated tier-1 metros toward lower-tier municipalities is unlocking disposable-income pools, while platform investment in mobile-first interfaces keeps transaction growth tightly linked to smartphone penetration. Regulatory tightening on monopolistic conduct is tempering margin upside, yet it is creating room for regional specialists and niche category platforms to scale. Intensifying competition among Alibaba, JD.com, Pinduoduo, Douyin and Kuaishou is compressing take-rates, but also accelerating innovation in AI-powered personalization and low-carbon logistics.
Key Report Takeaways
- By business model, business-to-consumer transactions accounted for 87.24% of the China e-commerce market share in 2025, while business-to-business is expanding at an 11.37% CAGR to 2031.
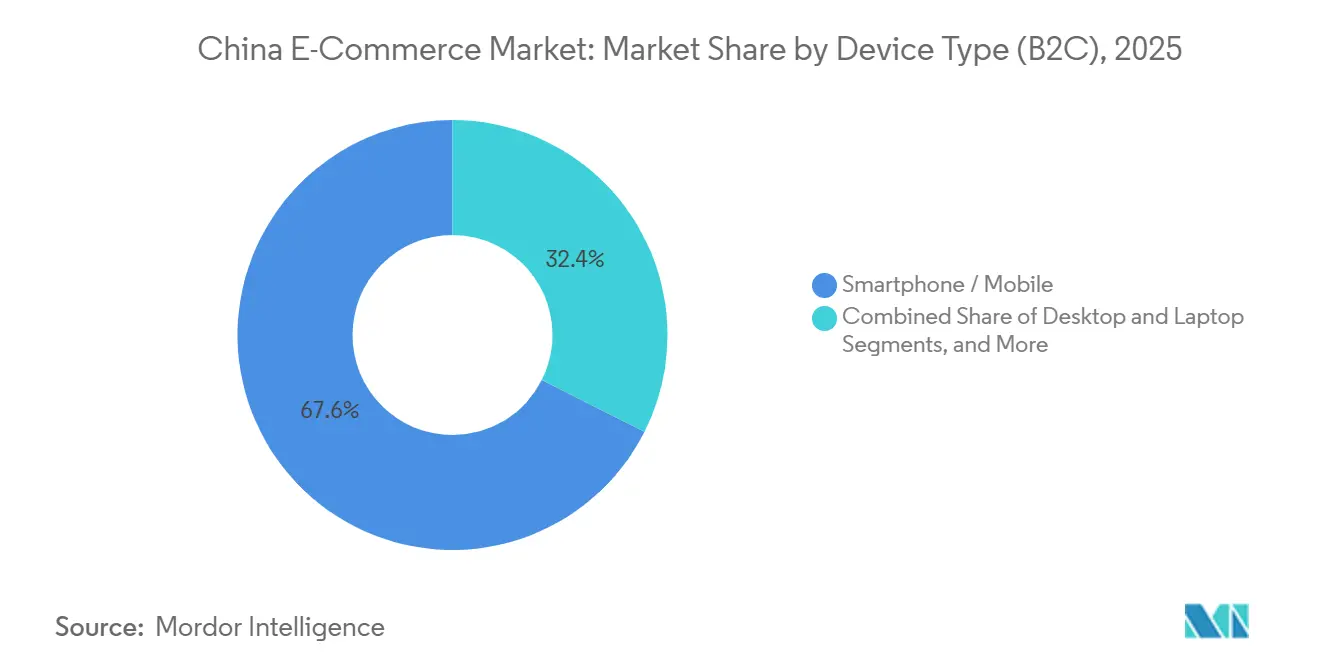
- By device type, smartphones captured 67.57% of the China e-commerce market size in 2025 and are advancing at a 10.12% CAGR through 2031.
- By payment method, credit and debit cards commanded 48.97% share of the China e-commerce market size in 2025, whereas digital wallets exhibit the fastest growth at 12.64% CAGR.
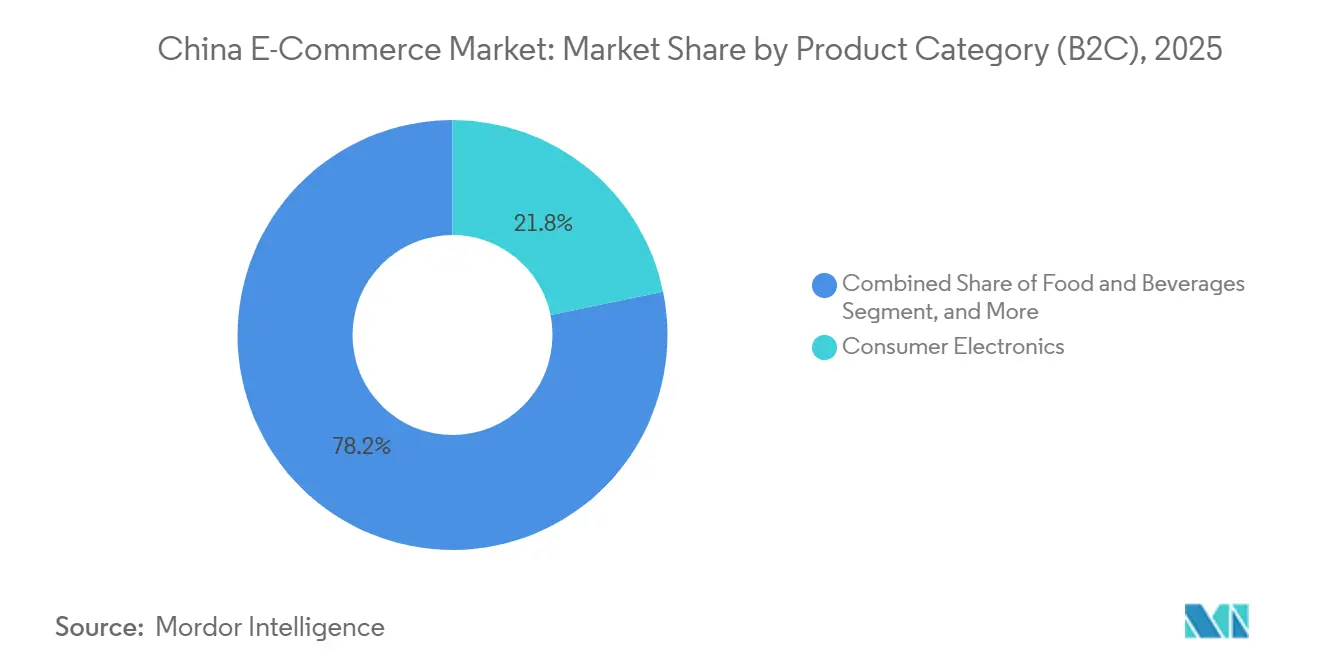
- By product category, consumer electronics led with 21.78% revenue share in 2025; food and beverages is forecast to expand at an 11.86% CAGR to 2031.
Note: Market size and forecast figures in this report are generated using Mordor Intelligence’s proprietary estimation framework, updated with the latest available data and insights as of January 2026.
China E-Commerce Market Trends and Insights
Drivers Impact Analysis*
| Driver | (~) % Impact on CAGR Forecast | Geographic Relevance | Impact Timeline |
|---|---|---|---|
| Livestream commerce expansion in lower-tier cities | +2.1% | Nationwide, most intense in tier-3 to tier-5 cities | Medium term (2-4 years) |
| Same-day logistics unlocking FMCG and fresh grocery online | +1.8% | East, North and South-Central urban cores | Short term (≤ 2 years) |
| Private-traffic WeChat mini-program enablement for SMEs | +1.4% | Nationwide, early uptake in South-Central and East | Medium term (2-4 years) |
| Cross-border duty exemption boosting imported cosmetics | +1.1% | Guangdong, Hainan, Shanghai, Hangzhou | Long term (≥ 4 years) |
| AI-driven personalized sizing solutions reducing returns | +0.9% | Tier-1 and tier-2 fashion hubs | Medium term (2-4 years) |
| Renewable-energy powered data centers enhancing ESG appeal | +0.6% | National infrastructure, pilots in Inner Mongolia, Guizhou, Ningxia | Long term (≥ 4 years) |
| Source: Mordor Intelligence | |||
Livestream Commerce Expansion in Lower-Tier Cities
Livestream shopping generated USD 807 billion in gross merchandise value during 2024 and is on track to sustain an 18% CAGR through 2026, with more than 60% of new live-stream buyers coming from tier-3 and smaller cities. Disposable income in these municipalities rose 5.8% year-on-year in H1 2024, giving residents greater spending power. Platforms such as Kuaishou and Douyin deploy local creators who speak regional dialects, strengthening trust and reducing the anonymity barrier that limits traditional marketplace conversion. As content becomes the storefront, agricultural goods and daily-use appliances that once lacked offline distribution reach see new demand. Pending Ministry of Commerce rules that require real-time disclosure of sponsored segments are expected to formalize influencer contracts and lift consumer confidence.
Same-Day Logistics Unlocking FMCG and Fresh Grocery Online
Fulfillment windows in Beijing, Shanghai and Shenzhen have fallen below 30 minutes thanks to hybrid supermarket-warehouse formats like JD 7Fresh and Alibaba Hema. Electric scooters and autonomous robots now handle the final leg, while cold-chain capacity expanded 22% in 2024 under state subsidy programs. Meituan Select’s community group-buying model widened to 2,800 cities by year-end 2024, aggregating demand and slicing last-mile costs. Streamlined customs procedures introduced in 2025 shortened border clearance for imported fruit from 48 to 12 hours, enabling same-day delivery of premium berries and seafood. These advances shift grocery purchases from weekly offline stock-ups to high-frequency online baskets, stabilizing revenue streams for platforms.[1]General Administration of Customs, “Cross-Border E-Commerce Clearance Procedures,” CUSTOMS.GOV.CN
Private-Traffic WeChat Mini-Program Enablement for SMEs
More than 4.5 million WeChat mini-programs handled CNY 1.8 trillion (USD 250 billion) in transactions during 2024, giving small merchants a low-cost digital storefront without marketplace fees. By nurturing private-traffic pools through group chats and loyalty perks, SMEs enjoy repeat-purchase rates 30-40% higher than public-platform listings. Integrated live-streaming and WeChat Pay payments compress the journey from discovery to checkout into a single screen. New Network Data Security Management rules effective January 2025 require granular user-consent flows, leading Tencent to embed privacy dashboards that further reassure shoppers. The resulting confidence is accelerating digital adoption among risk-averse micro-enterprises across manufacturing belts and service sectors.
Cross-Border Duty Exemption Boosting Imported Cosmetics
China’s retail import policy exempts individual purchases under CNY 5,000 (USD 700) from standard duties, applying a lower 9.1% consolidated tax to cosmetics. Hainan’s personal duty-free quota jumped to CNY 100,000 (USD 14,000) in July 2025, converting the island into a proving ground for luxury brands. Tmall Global and JD Worldwide report cosmetics accounting for 18% of cross-border sales in 2024, led by Korean, Japanese and French labels. Bonded-warehouse inspection times fell from 72 to 24 hours in March 2025, letting platforms promise next-day delivery even on imported SKUs. Rapid replenishment is critical in beauty, where trend cycles move swiftly and freshness influences conversion.[2]Hainan Provincial Government, “Duty-Free Shopping Policy Update,” HAINAN.GOV.CN
Restraints Impact Analysis*
| Restraint | (~) % Impact on CAGR Forecast | Geographic Relevance | Impact Timeline |
|---|---|---|---|
| Data-privacy and antitrust regulations curbing monetization | -1.2% | National, strictest in tier-1 hubs | Short term (≤ 2 years) |
| Weak IP enforcement deterring luxury brand presence | -0.8% | Nationwide, sharper in tier-2 and tier-3 cities | Long term (≥ 4 years) |
| Mobile-internet user saturation in tier-1 cities | -0.7% | Beijing, Shanghai, Guangzhou, Shenzhen | Medium term (2-4 years) |
| Cross-border carbon tariffs inflating shipping costs | -0.5% | Routes into Europe and North America | Long term (≥ 4 years) |
| Source: Mordor Intelligence | |||
Data-Privacy and Antitrust Regulations Curbing Monetization
Antitrust guidelines released in November 2025 outlaw forced exclusivity and demand transparency around algorithmic rankings. Coupled with stringent data-privacy rules that took effect in January 2025, platforms have had to redesign consent flows and reduce third-party data sharing. Compliance investments totaled CNY 2.8 billion (USD 390 million) for Alibaba in fiscal 2025, and merchant surveys point to 12-15% lower click-through rates on sponsored slots since the new rules. While trust gains with consumers are evident, short-term monetization suffers, trimming growth vectors for ad-supported revenue lines.[3]State Administration for Market Regulation, “Antitrust Guidelines for Platform Economy,” SAMR.GOV.CN
Weak IP Enforcement Deterring Luxury Brand Presence
The National Intellectual Property Administration logged 1.2 million trademark-violation cases in 2024, 68% of them on e-commerce platforms. Luxury groups respond by limiting distribution to private storefronts such as Tmall Luxury Pavilion or WeChat mini-programs, which carry authentication and curated experiences but deliver narrower reach. Counterfeit overhang depresses gross merchandise value growth in high-margin fashion categories, with 2020-2025 CAGR lagging market average by 220 basis points. Although image-recognition takedown tools cut fake listings 18% since 2023, full brand confidence will require sustained enforcement and tighter seller onboarding.
*Our forecasts treat driver/restraint impacts as directional, not additive. The impact forecasts reflect baseline growth, mix effects, and variable interactions.
Segment Analysis
By Business Model: Manufacturing Procurement Digitizes Through B2B Platforms
Business-to-consumer transactions represented 87.24% of total sales in 2025, underscoring how retail-focused ecosystems such as Taobao, JD.com and Pinduoduo dominate the China e-commerce market. The business-to-business stream, however, is expanding at 11.37% per year, two percentage points faster than B2C, as industrial buyers migrate sourcing to cloud marketplaces that offer real-time supplier matching. The China e-commerce market size for B2B flows reached CNY 3 trillion (USD 420 billion) on Alibaba 1688.com in 2024, highlighting the depth of this structural shift. Factories in Henan and Anhui now integrate procurement APIs into ERP software, gaining price transparency that trims raw-material spend.
Enterprise buyers in Southeast Asia and Africa amplified cross-border B2B demand by 14% in 2024, using unified customs codes that cut paperwork 40%. The Ministry of Industry and Information Technology’s industrial internet blueprint prioritizes SaaS procurement tools, channeling subsidies toward small manufacturers who previously relied on offline agents. As B2C growth moderates in saturated metros, the China e-commerce market gains a second engine from B2B digitization that carries lower marketing costs and higher order values. Content-driven commerce on Douyin and Kuaishou grabs consumer mindshare, but factory-floor purchasing decisions are increasingly shaped by AI-powered quote engines that recalibrate prices on the fly, suggesting a divergent yet complementary growth path for the China e-commerce industry.
By Device Type (B2C): Smartphones Anchor Growth While Desktops Regain Niche Relevance
Smartphones generated 67.57% of B2C turnover in 2025, confirming their role as the default gateway to the China e-commerce market. Ubiquitous 5G coverage, QR-code payments and mini-program ubiquity keep app dwell times high, with the average user spending 6.2 hours daily on mobile internet in 2024. The China e-commerce market size attributed to smartphones is forecast to climb at 10.12% CAGR through 2031, as 5G handset upgrades filter into inland cities and data-inclusive tariffs lower browsing costs.[4]Ministry of Industry and Information Technology, “Industrial Internet Development Plan,” MIIT.GOV.CN
Desktop and laptop sessions stabilized at roughly 32% of transactions, buoyed by buyers who prefer large screens for side-by-side product comparisons in electronics and furniture. Corporate procurement teams also favor desktops for bulk ordering, linking B2B platform usage to office hardware. Emerging devices such as smart TVs and voice assistants remain sub-5% but are gaining traction as IoT ecosystems like Xiaomi Youpin embed one-click replenishment. Platform design parity ensures promotions synchronize across screens, preventing leakage of shopper attention and sustaining multi-device engagement within the broader China e-commerce market.


By Payment Method (B2C): Digital Wallets Outpace Cards on the Back of the Digital Yuan
Cards retained 48.97% share of checkout flows in 2025, yet wallets are expanding 12.64% annually, supported by seamless QR-code scanning and loyalty gamification. The digital yuan pilot, live in 26 cities, plugs directly into Alipay and WeChat Pay balances, letting users fund purchases without routing through commercial banks. As a result, micro-transactions under CNY 100 (USD 14) made up 62% of wallet payments in 2024, illustrating how low-ticket frequency props up gross merchandise value.[5]People’s Bank of China, “Digital Yuan Pilot Expansion,” PBC.GOV.CN
Buy-now-pay-later plans, capped at 24% interest under 2024 rules, captured about 8% of volume, appealing to Gen Z shoppers. Cash-on-delivery is now largely rural, while bank transfers linger for high-value B2B orders where invoice auditing remains strict. The shift toward wallets deepens ecosystem stickiness for leading apps, anchoring the China e-commerce market around super-app identities that blend social networking, payments and retail.[6]China Payment and Clearing Association, “Payment Method Analysis,” PCAC.ORG.CN
By Product Category (B2C): Fresh Grocery Momentum Challenges Electronics Leadership
Consumer electronics held the revenue crown at 21.78% in 2025, backed by direct-brand alliances that guarantee authenticity. Yet food and beverages exhibit the fastest advance at 11.86% CAGR to 2031, underpinned by instant-delivery networks and urban consumers who value freshness over shelf-stable inventories. The China e-commerce market size tied to fresh staples now scales on recurring weekly baskets, smoothing seasonal volatility.[7] Meituan, “Annual Report 2024,” MEITUAN.COM
Beauty and personal care leverage cross-border duty savings and influencer tutorials on Xiaohongshu, translating social attention into purchases. Fashion growth trails due to 28% return rates, spurring investment in AI fit prediction that trimmed apparel returns 15% in 2024 pilots. Long-tail segments such as toys, DIY supplies and media books inch forward as marketplaces expand assortment depth, underscoring a demand shift from big-ticket gadgets toward high-frequency essentials across the China e-commerce market.
Geography Analysis
East China, anchored by Shanghai, Jiangsu and Zhejiang, continued to lead the China e-commerce market in 2025, supported by GDP per capita of CNY 120,000 (USD 16,700) and dense warehouse grids that enable same-day service to 200 million residents. Digital yuan trials in Shanghai accelerated wallet uptake, with 85% of online checkouts in the municipality routed through wallets or central-bank digital currency by mid-2025. The Yangtze River Delta integration blueprint tightens intercity logistics, allowing inventory to shuttle among Suzhou, Hangzhou and Ningbo for optimal last-mile speed.
North China’s Beijing-Tianjin corridor shows vigorous B2B expansion as state-owned conglomerates digitize procurement, while Guangdong in South-Central China handles the bulk of cross-border imports through bonded zones that processed CNY 800 billion (USD 111 billion) in 2024. Hainan’s duty-free reforms draw luxury experimentation, blending online reservation with airport pick-up to create an omnichannel duty-free loop. These dynamics illustrate how regional policy levers steer capital flows inside the China e-commerce market.
Southwest China, led by Chongqing and Chengdu, gains from Belt and Road logistics that cut freight time to Southeast Asia, pushing e-commerce penetration across inland provinces. Northwest rural broadband subsidies lifted online shopping access from 18% in 2020 to 34% in 2024, while Northeast hubs such as Harbin channel cross-border exports to Russia and South Korea. Such geographic dispersion makes strategic segmentation indispensable for platforms seeking to deepen the China e-commerce industry footprint.
Competitive Landscape
Alibaba, JD.com and Pinduoduo jointly controlled close to 70% of 2025 gross merchandise value, giving the China e-commerce market a moderately concentrated profile. Alibaba’s tri-platform matrix of Taobao, Tmall and 1688.com leverages cross-traffic data to fine-tune recommendation engines and optimize warehouse positioning. JD.com’s 1,400-warehouse network ensures 90% next-day coverage in tier-1 and tier-2 cities, a logistics edge that keeps consumer electronics and fresh groceries flowing on tight timelines. Pinduoduo’s farmer-to-consumer group-buying exploits price sensitivity in lower-tier municipalities, broadening the demand base for staples.
Content-first entrants are eroding incumbent strongholds. Douyin embeds shoppable video into short-form feeds, generating CNY 1.2 billion (USD 167 million) in a single beauty campaign with L’Oréal in September 2025. Kuaishou links seamlessly to Taobao catalogs, expanding SKU depth tenfold for its 400 million daily users. Xiaohongshu fuses lifestyle content with commerce, drawing 300 million monthly users who favor curated beauty picks. These moves diversify consumer discovery modes, forcing established players to integrate live-video, social and price-match features more quickly.
Regulatory shifts further shape competition. November 2025 antitrust guidelines ban exclusivity clauses, encouraging multi-homing among merchants who now spread listings across several platforms to mitigate dependency. As AI tools predict trends and optimize inventory, smaller vertical platforms focus on specialty categories like pre-owned luxury or authenticated streetwear, carving out defensible niches. Together, these dynamics suggest the China e-commerce market is entering a phase where innovation in engagement models matters as much as sheer scale.
China E-Commerce Industry Leaders
JD.com Inc.
Pinduoduo Inc.
Suning.com Co. Ltd.
Alibaba Group Holding Ltd.
Vipshop Holdings Ltd.
- *Disclaimer: Major Players sorted in no particular order

Recent Industry Developments
- December 2025: Alibaba Group committed CNY 15 billion (USD 2.1 billion) to expand the Cainiao logistics network across Southeast Asia, opening 12 sorting centers that will cut delivery times to ASEAN consumers to three days.
- November 2025: JD.com and China National Petroleum Corporation began deploying 8,000 electric vans across 50 cities, paired with 200 depot charging stations, aiming for carbon-neutral logistics by 2030.
- October 2025: Pinduoduo introduced Temu Global, a direct-from-factory marketplace for European and North American shoppers that logged USD 500 million in its debut month.
- September 2025: Douyin partnered with L’Oréal China to launch exclusive beauty lines through live-stream events, generating CNY 1.2 billion (USD 167 million) during the Mid-Autumn Festival.
- August 2025: Meituan invested CNY 3.5 billion (USD 487 million) for a 20% stake in Yonghui Superstores, extending same-day grocery delivery to 200 more cities by end-2026.


Research Methodology Framework and Report Scope
Market Definitions and Key Coverage
Mordor Intelligence defines China's e-commerce market as the value of all goods and services transacted online by residents and businesses located in mainland China, whether purchases occur on dedicated webstores, mobile apps, social-commerce feeds, or business procurement portals. Results are expressed in Gross Merchandise Value (GMV) at end-buyer prices and cover B2C, B2B, and C2C models, with cross-border transactions counted when the Chinese buyer or seller sits inside the jurisdiction.
Scope exclusion: purely digital content such as in-game items, crypto assets, and ride-hailing fares are outside study limits.
Segmentation Overview
- By Business Model
- B2C
- B2B
- By Device Type (B2C)
- Smartphone / Mobile
- Desktop and Laptop
- Other Device Types
- By Payment Method (B2C)
- Credit and Debit Cards
- Digital Wallets
- Buy Now Pay Later (BNPL)
- Other Payment Methods
- By Product Category (B2C)
- Beauty and Personal Care
- Consumer Electronics
- Fashion and Apparel
- Food and Beverages
- Furniture and Home
- Toys, DIY and Media
- Other Product Categories
Detailed Research Methodology and Data Validation
Primary Research
Discussions with marketplace operators, third-party merchants, payment service providers, and logistics integrators across Beijing, Hangzhou, Shenzhen, and Chengdu clarified discounting practices, average selling prices, and rural-penetration hurdles. Follow-up surveys with shoppers in tier-2 and tier-3 cities tested basket-size assumptions and mobile-only behavior, allowing us to fine-tune conversion ratios suggested by secondary data.
Desk Research
Analysts began by collecting macro signals from government bodies such as the National Bureau of Statistics of China, the Ministry of Commerce, and the China Internet Network Information Center. We then pulled trade and tariff flows from UN Comtrade and customs bulletins to gauge cross-border weightings, complemented by consumer-spending series from the People's Bank of China and the World Bank. Company filings on Alibaba, JD.com, and PDD Holdings, plus earnings transcripts, fed price-volume benchmarks, which were further enriched through paid feeds like D&B Hoovers for private-firm revenue splits. News archives in Dow Jones Factiva and industry notes from trade groups such as the China Chain Store and Franchise Association rounded out adoption trends and policy updates. The sources listed illustrate our evidence base; additional datasets were also referenced where material.
Market-Sizing & Forecasting
A top-down construct converts official online-retail receipts and B2B e-invoice tallies to GMV, after which channel-specific mark-ups adjust for service fees and return cycles. Supplier roll-ups of leading platforms, sampled ASP × order-volume checks, and import duty statistics serve as selective bottom-up counterpoints that validate and recalibrate totals. Key model drivers include smartphone penetration, digital-wallet share of checkout, rural broadband coverage, live-commerce stream hours, and discretionary income per capita; each is projected through 2030 using multivariate regression backed by consensus expectations from primary experts. Where bottom-up gaps emerge, particularly for emerging social-commerce formats, proxy metrics such as short-video ad spend are employed and then trued up against the national spending envelope.
Data Validation & Update Cycle
Outputs undergo three-layer review: automated variance scans flag anomalies against historical ratios; senior analysts interrogate outliers; and a peer panel approves the final release. Reports refresh annually, and interim revisions are triggered by material shocks such as new tax rules or platform reporting shifts, ensuring clients always receive current figures.
Why Mordor's China E-commerce Baseline Earns Decision-Maker Trust
Published estimates differ because firms choose varied scopes, input series, and refresh cadences. Some fold in digital media or report gross shipment value; others exclude B2B trade entirely. Our disciplined scope, transparent variable set, and annual reconnection with field experts anchor a balanced midpoint that executives can reproduce and defend.
Benchmark comparison
| Market Size | Anonymized source | Primary gap driver |
|---|---|---|
| USD 1.53 trn (2025) | Mordor Intelligence | - |
| USD 2.22 trn (2024) | Regional Consultancy A | Includes services like food delivery and O2O tickets outside our definition |
| USD 1.07 trn (2025) | Global Consultancy B | Focuses mainly on general merchandise B2C, omits B2B and cross-border flows |
| USD 1.41 trn (2024) | Industry Association C | Counts only B2B customs data, double counts re-exports, excludes consumer volume |
The comparison shows that headline gaps stem chiefly from what is counted rather than calculation errors. By aligning scope with on-platform GMV, applying consistent currency translation, and vetting every assumption through local interviews, Mordor Intelligence delivers a dependable, transparent baseline that stakeholders can confidently embed in strategic models.


Key Questions Answered in the Report
How large is China's online retail sector in 2026?
The China e-commerce market reached USD 1.68 trillion in 2026 and is forecast to hit USD 2.64 trillion by 2031 at a 9.46% CAGR.
Which business model is expanding fastest?
Business-to-business transactions are rising 11.37% annually through 2031, outpacing the consumer segment as factories digitize procurement.
What devices generate most online sales?
Smartphones accounted for 67.57% of 2025 transaction value, and their share continues to climb on the back of 5G coverage.
Why are digital wallets gaining share?
Wallets grow 12.64% per year because QR-code ubiquity and digital yuan integration simplify checkout and support micro-payments.
Which product category is growing quickest?
Food and beverages record the highest CAGR at 11.86% through 2031 thanks to same-day grocery delivery networks.
How strict is market competition?
The market is moderately concentrated, with a concentration score of 6, meaning leading players still dominate but face active disruption from content-first platforms.
Page last updated on:


