Social Commerce Market Size and Share
Market Overview
| Study Period | 2021 - 2031 |
|---|---|
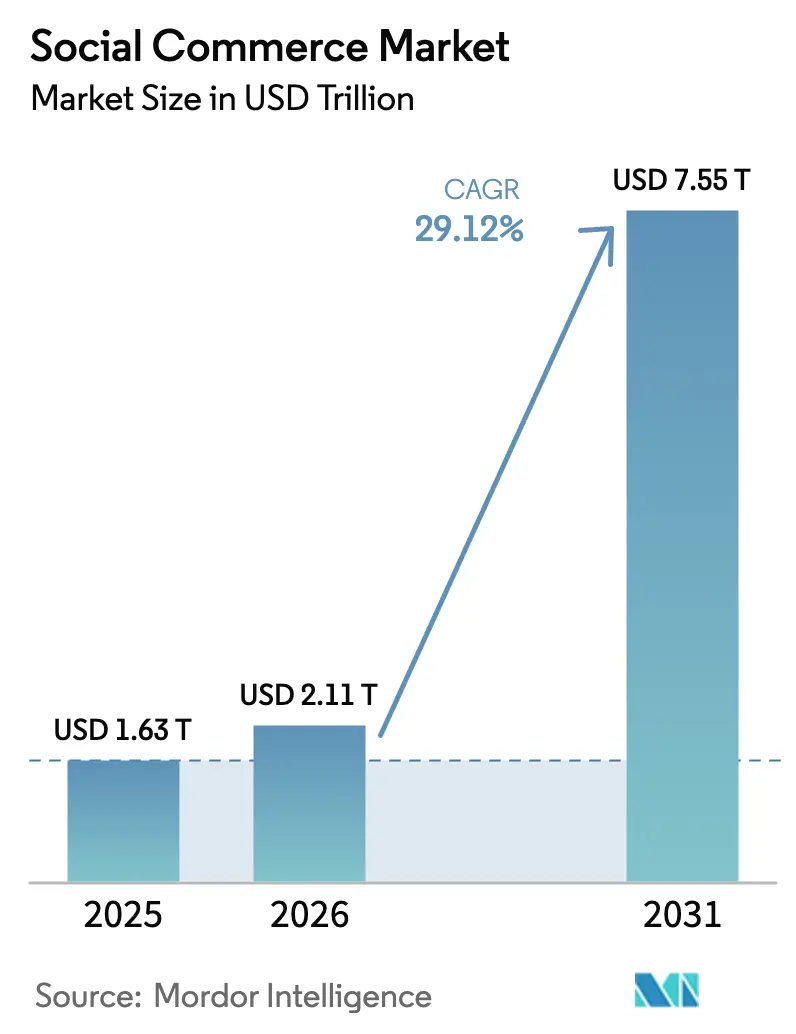
| Market Size (2026) | USD 2.11 Trillion |
| Market Size (2031) | USD 7.55 Trillion |
| Growth Rate (2026 - 2031) | 29.12% CAGR |
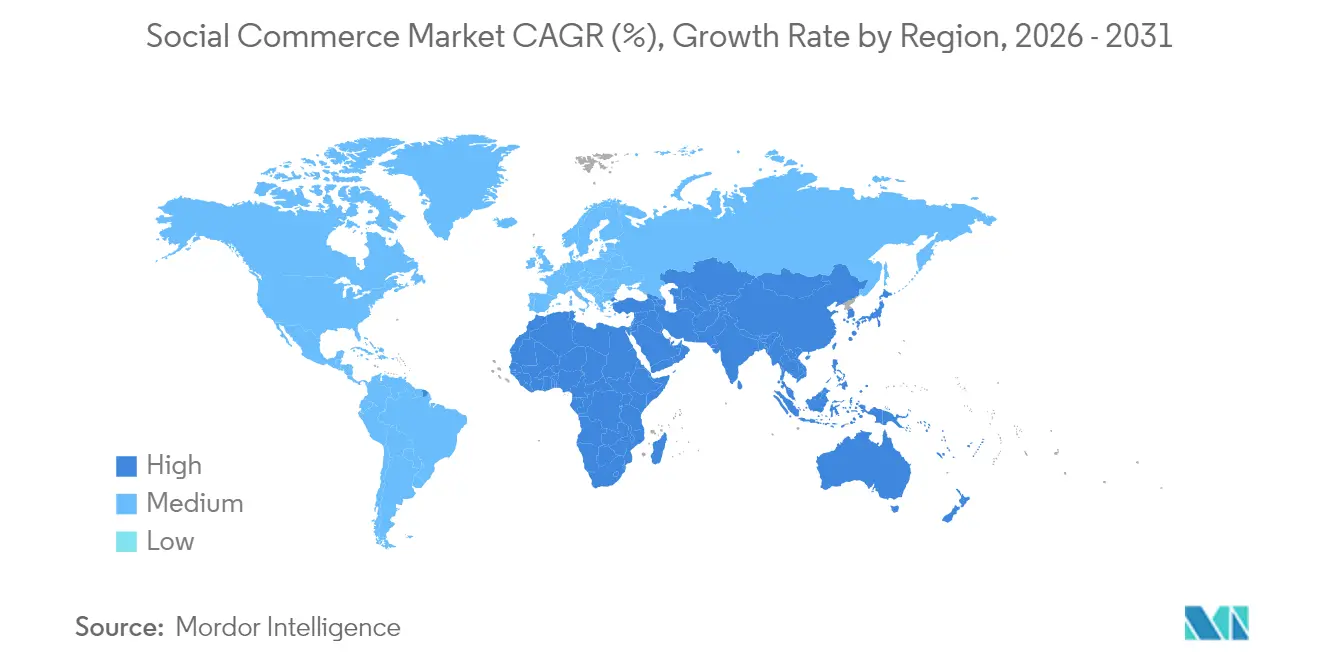
| Fastest Growing Market | North America and Europe |
| Largest Market | Asia Pacific |
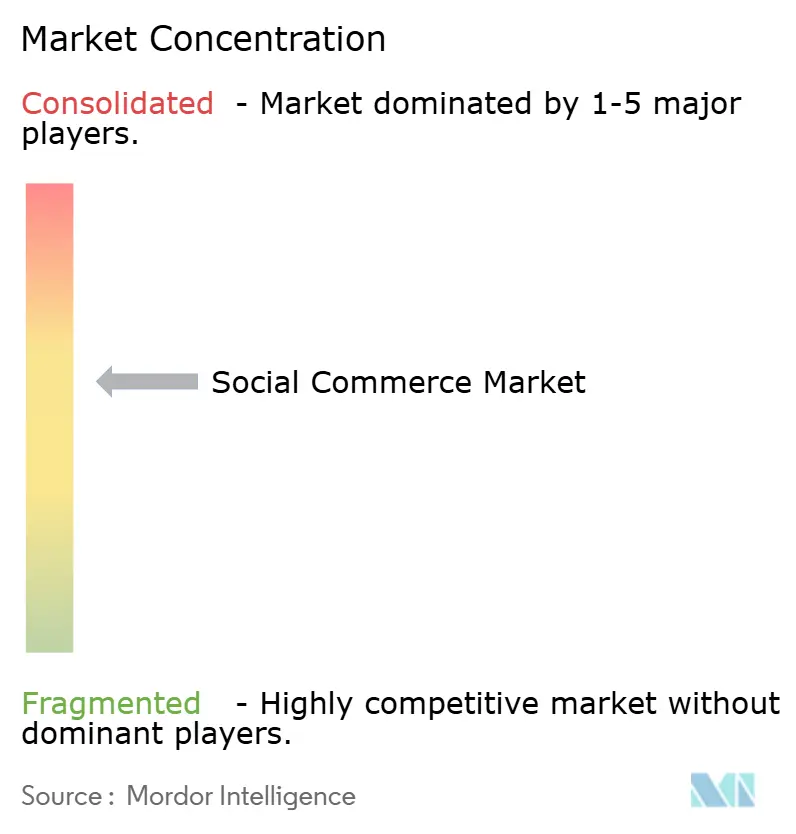
| Market Concentration | Medium |
Major Players *Disclaimer: Major Players sorted in no particular order Image © Mordor Intelligence. Reuse requires attribution under CC BY 4.0. | |
Social Commerce Market Analysis by Mordor Intelligence
The Social Commerce Market size was valued at USD 1.63 trillion in 2025 and estimated to grow from USD 2.11 trillion in 2026 to reach USD 7.55 trillion by 2031, at a CAGR of 29.12% during the forecast period (2026-2031). Momentum is coming from in-app payment adoption, livestream shopping popularity, data-rich AI recommendation engines and the steady rise of social-first direct-to-consumer brands. Asia-Pacific currently commands the largest regional slice, but North America is accelerating faster on the back of aggressive platform investment and shifting buying habits among Gen-Z consumers. Video commerce retains the dominant sales-channel position, yet peer-driven social reselling is growing the quickest. Competitive intensity is increasing as large global players integrate payment, logistics and creator-monetization tools while agile regional firms capture niche communities through highly localised experiences.
Key Report Takeaways
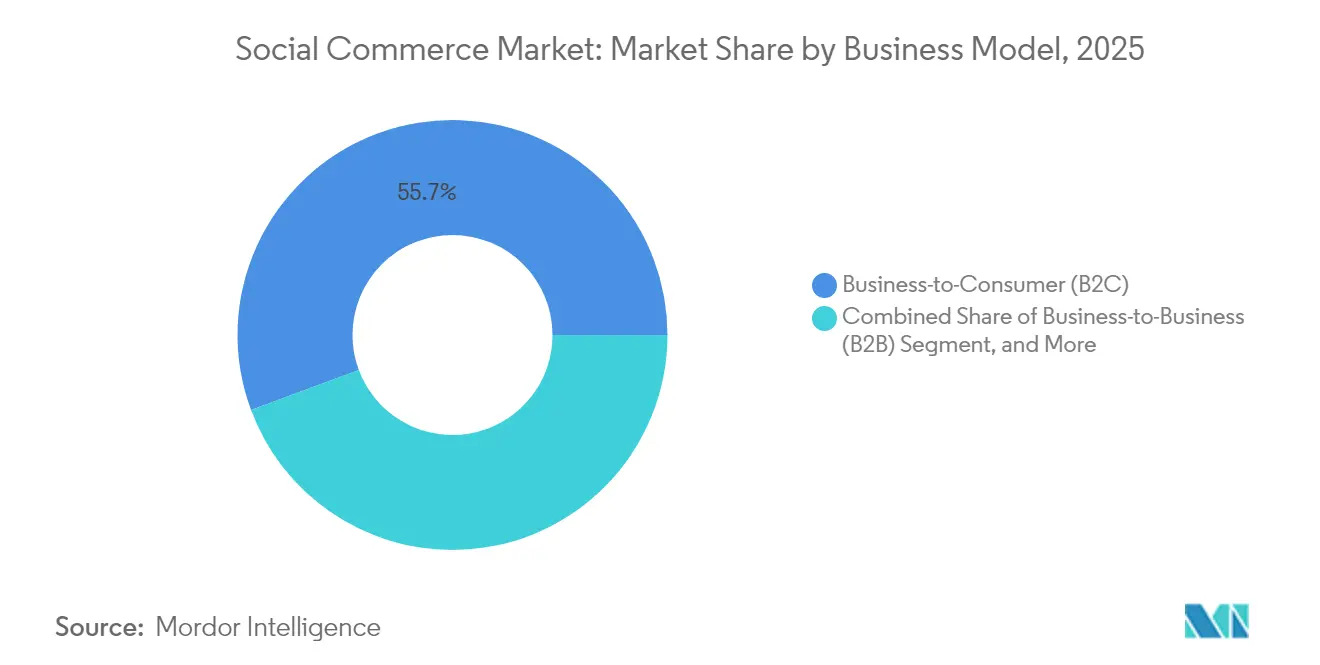
- By business model, B2C led with 55.68% of social commerce market share in 2025, while the C2C format is forecast to grow at a 33.74% CAGR through 2031.
- By product type, apparel claimed 27.95% of the social commerce market size in 2025 and beauty and personal care is rising at a 33.12% CAGR to 2031.
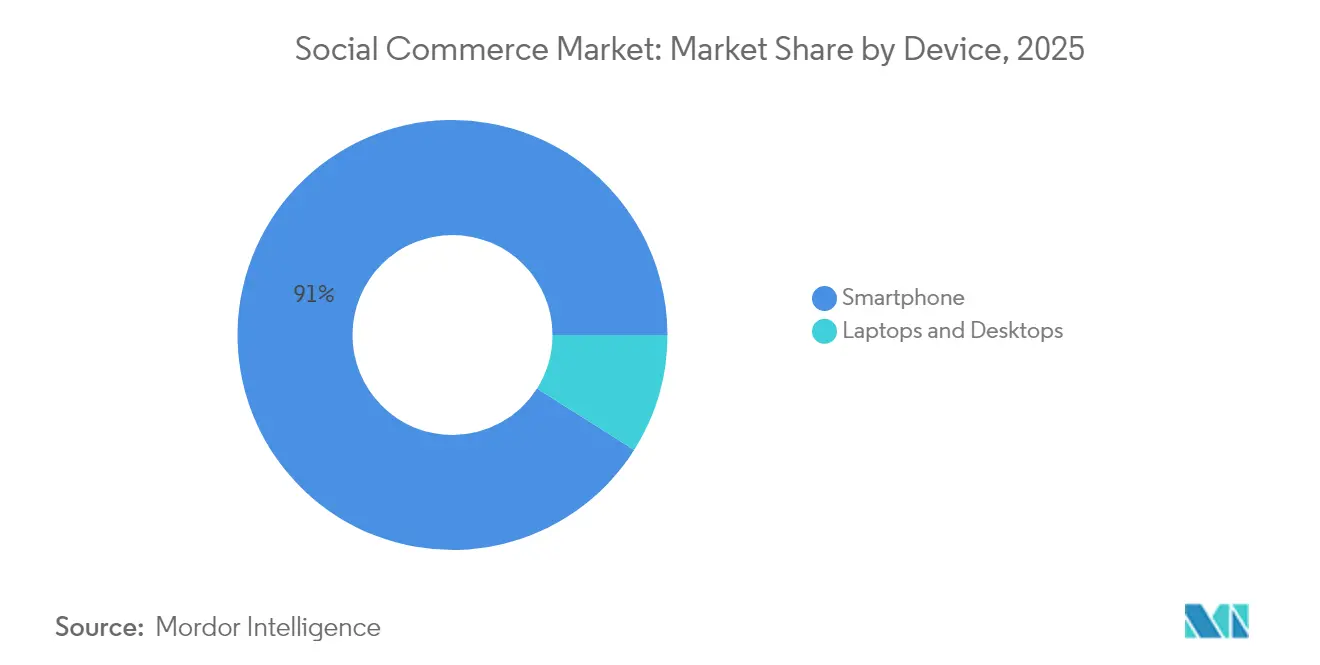
- By device, smartphones accounted for 91.02% of the social commerce market size in 2025 and register a 30.18% CAGR across the outlook.
- By sales channel, video commerce captured 43.22% of the social commerce market share in 2025; social reselling posts the fastest 34.26% CAGR during 2026-2031.
- By geography, Asia-Pacific held 34.28% of the social commerce market share in 2025; North America is the fastest-growing region at a 32.11% CAGR over the forecast window.
Note: Market size and forecast figures in this report are generated using Mordor Intelligence’s proprietary estimation framework, updated with the latest available data and insights as of 2026.
Global Social Commerce Market Trends and Insights
Drivers Impact Analysis*
| Driver | (~) % Impact on CAGR Forecast | Geographic Relevance | Impact Timeline |
|---|---|---|---|
| Accelerated Adoption of In-App One-Click Payments Across Southeast Asia | +5.2 | Southeast Asia, with spillover to India and China | Medium term |
| Live-stream Video Shopping Surge Among Gen-Z in China and the U.S. | +7.8 | China, U.S., with expansion to Europe | Short term |
| Hyper-Personalised AI Recommendation Engines Boosting AOV in Europe | +4.3 | Europe, North America | Medium term |
| Social-First DTC Brand Proliferation in North America | +3.6 | North America, with expansion to Europe | Medium term |
| Cross-Border Social Shopping Enabled by Embedded Logistics APIs | +6.1 | Global, with emphasis on China-to-global routes | Long term |
| Integration of Social Wallets (e.g., WeChat Pay, KakaoPay) Driving Conversion | +4.5 | Asia-Pacific, with expansion to global markets | Medium term |
| Source: Mordor Intelligence | |||
One-click In-App Payments Accelerate Adoption
The rapid embedment of seamless payments inside social platforms is reshaping buyer expectations. Digital wallets such as GrabPay and KakaoPay serve as lifestyle hubs, letting shoppers move from discovery to checkout without friction. Gen-Z adoption is particularly strong: 79% of this cohort prefer wallet-based settlement. First-party transaction data enriches recommendation algorithms, lifting cart-completion and enabling merchants to tailor promotions in real time. As these integrations proliferate across Southeast Asia and spill into India and China, they inject an estimated +5.2 percentage-point uplift into the overall CAGR of the social commerce market.
Livestream Video Shopping Intensifies Gen-Z Engagement
Livestream commerce blends entertainment and shopping, collapsing the traditional sales funnel into a single interactive session. Douyin, Taobao Live and Kuaishou collectively control more than 85% of China’s livestream GMV. [1]Austrade Trade Commissioner Service, “Top 5 Tips for Live Streaming in China,” Austrade Export News, April 4, 2025, export.business.gov.au In the U.S., TikTok Shop is already eclipsing incumbents in certain beauty and apparel segments. Real-time scarcity cues and social validation signals drive impulse purchasing, delivering conversion rates up to ten times higher than static listings. Although cultural nuance requires adaptation for Western audiences, the mechanic delivers a +7.8 percentage-point boost to the social commerce market’s CAGR.
Hyper-Personalised AI Recommendation Engines Boost Average Order Value
Context-aware engines track behavioural signals to curate feeds that match evolving tastes, pushing conversion up by roughly 25% among European fashion retailers. [2]Storyly Insights Team, “12 Key Stats & 6 Trends Defining the European Beauty Industry,” Storyly Insights, February 6, 2025, storyly.io Algorithms now venture beyond demographics to interpret micro-moments and sentiment, offering precisely timed prompts that lift basket size. As emotion-recognition modules roll out at scale, platforms in Europe and North America expect sustained uplift equivalent to +4.3 percentage points in CAGR for the social commerce market.
Cross-Border Shopping Enabled by Embedded Logistics APIs
Seamless customs calculation, duty disclosure and end-to-end parcel tracking are removing geographic friction. Brands can now serve shoppers globally while keeping fulfilment promises transparent, expanding total reachable demand. The cross-border e-commerce segment is forecast to hit USD 16.4 trillion by 2032. Integrated APIs deliver agility prized by small sellers and empower Chinese factories to reach Western consumers directly. The enabling effect adds +6.1 percentage points to CAGR of the social commerce market.
Restraints Impact Analysis*
| Restraint | (~) % Impact on CAGR Forecast | Geographic Relevance | Impact Timeline |
|---|---|---|---|
| Rising User Acquisition Costs on Mature Platforms | -3.2 | North America, Europe | Short term |
| Fragmented Data-Privacy Mandates (EU-DMA, CPRA, PDPA) | -2.7 | Europe, North America, parts of Asia | Medium term |
| Creator-Platform Revenue Tussle Curtailing Content Supply | -1.9 | Global | Medium term |
| Livestreaming Commerce Regulation Caps in China | -2.4 | China, with potential global precedent | Short term |
| Source: Mordor Intelligence | |||
Rising User-Acquisition Costs on Mature Platforms
Competition for screen time and inventory saturation have pushed Facebook and Instagram CAC up by about 60% during 2023-2024. Margin compression is acute for DTC operators, prompting a pivot toward retention mechanics, collaborative campaigns and emerging networks with lower acquisition bids. Elevated CAC subtracts roughly 3.2 percentage points from the CAGR of the social commerce market until newer traffic sources offset the squeeze.
Fragmented Data-Privacy Mandates Create Compliance Drag
The EU DMA, CPRA and multiple Asian PDPAs compel platform-specific consent flows. Engineering time spent on localised data architectures diverts investment from commerce features and may dilute personalisation quality. OECD analysis underscores the operational burden of non-harmonised rules. [3]Christian Reimsbach-Kounatze and Andras Molnar, “The Impact of Data Portability on User Empowerment, Innovation, and Competition,” OECD Digital Economy Papers, June 2024, oecd.org The combined effect restrains the social commerce market by an estimated -2.7 percentage points in CAGR during the medium term.
*Our forecasts treat driver/restraint impacts as directional, not additive. The impact forecasts reflect baseline growth, mix effects, and variable interactions.
Segment Analysis
By Business Model: C2C Outpaces Traditional Formats
Consumer-to-consumer activity is scaling at a 33.74% CAGR, well above the 2026-2031 average for the social commerce market. B2C still commands 55.68% social commerce market share in 2025, but peer-driven recommendations now sway 59% of shoppers. Platforms empower micro-entrepreneurs with content creation, inventory management and payment tools that lower entry barriers.
The social commerce market size allocated to C2C remains smaller than B2C yet grows cumulatively faster each year. Younger buyers gravitate toward authentic stories and community trust, strengthening loyalty loops and fuelling lifetime-value expansion. In parallel, niche B2B fora gain momentum by matching specialist suppliers with industry buyers, though they represent a modest slice of the social commerce industry at present.


By Product Type: Beauty’s Digital Transformation Accelerates
Apparel retains 27.95% of social commerce market size in 2025, leveraging image-rich feeds and short shelf-life trends to keep discovery fresh. Beauty and personal-care lines, however, post the highest 33.12% CAGR through 2031-double apparel’s forward rate-as virtual try-ons and skin-analysis AI bridge confidence barriers.
This upswing reflects tactical partnerships between cosmetic labels and AR-technology vendors. Micro-influencers-often aestheticians or skincare coaches-deliver intimate tutorials that elevate conversion. Close-up demos combined with easy checkout maintain the social commerce market’s pull among convenience-oriented consumers, signalling multi-year headroom for product categories that can dramatise before-and-after benefits.
By Device: Smartphones Dominate the Social Shopping Experience
Smartphones captured 91.02% of the social commerce market share in 2025 and are set to grow at 30.18% CAGR to 2031. Their always-on nature supports spontaneous discovery during micro-moments such as commutes or breaks, aligning perfectly with social feed algorithms.
Even as tablet and PC interfaces receive incremental improvements, the social commerce market size attributed to mobile continues swelling thanks to wallet integration and biometric authentication. Nevertheless, cart-abandonment rates remain elevated on smaller screens, which highlights optimisation opportunities around auto-fill, deferred payments and one-tap re-engagement reminders.
By Sales Channel: Video Commerce Reshapes Consumer Engagement
Video commerce accounted for 43.22% of social commerce market share in 2025. The format compresses awareness, consideration and purchase into an interactive storyline enriched by immediate Q&A. Livestream hosts showcase product use-cases in context, building trust faster than text descriptions.
Social reselling-where individuals redistribute branded goods to personal networks-records the strongest 34.26% CAGR, reflecting the power of peer recommendations. Group buying, discovery communities and review hubs collectively extend the funnel, enabling shoppers to validate decisions before checkout. Together these channels diversify traffic sources, shielding the social commerce industry from over-reliance on any single format.
Geography Analysis
Asia-Pacific holds 34.28% of social commerce market share in 2025, underpinned by China’s integrated ecosystems where content, payment and fulfilment live inside the same super-apps. Douyin logged 15.4 billion orders in 2024, 63% via livestreams, while Taobao Live generated sizable GMV through curated studio-style broadcasts. High smartphone penetration and universal wallet adoption keep engagement metrics elevated across Southeast Asian markets such as Vietnam and Thailand.
North America is forecast to be the fastest-growing sub-region, registering a 32.11% CAGR during 2026-2031. Social commerce sales in the U.S. aim for USD 80 billion by 2025, equal to 17% of total online retail. Facebook still enjoys the broadest buyer base, yet TikTok’s GMV trajectory challenges incumbents, reflecting a shift toward video-first discovery. Influencer marketing budgets continue expanding and are forecast to reach USD 22.2 billion in 2025, cultivating fertile ground for creator-led product drops.
Europe advances at a measured 20.7% in 2025, partly moderated by stringent privacy directives. The UK, Germany and France anchor regional spend, while Spain and Italy see rapid early-stage adoption. Consumers here value traceability and eco-certifications, prompting platforms to enhance sustainability filters. Beauty remains a standout vertical: online sales account for 43% of the region’s USD 148.10 billion beauty revenue in 2025. TikTok-induced demand complements AR try-ons that raise confidence among remote buyers.
Mordor Intelligence provides coverage of the social commerce market across other key regional markets. Detailed country-level analysis extends to India, Brazil, Canada, China, and France incorporating local coverage and market participation, as required.

Competitive Landscape
Competition in the social commerce market blends global conglomerates with agile, category-focused specialists. In Asia, ByteDance and Alibaba maintain ecosystem moats through proprietary wallets, logistics and AI engines, collectively controlling the majority of transactions. Western markets remain less consolidated. Meta, Snap, Pinterest and TikTok each nurture unique value propositions, from augmented-reality try-ons to creator revenue-sharing schemes.
Strategic activity centres on vertical integration. TikTok invests in end-to-end fulfilment to ensure two-day shipping in the U.S., mirroring Amazon’s service bar. Alibaba pairs its Qwen AI model with Apple devices to personalise storefronts for Chinese iPhone users, signalling a shift toward device-level commerce orchestration. Cross-border enablement is another white space: embedded tax and duty services make it easier for Korean cosmetics brands to reach U.S. buyers within a single interface.
Regional upstarts are disrupting entrenched paradigms. Xiaohongshu leverages lifestyle content to convert high-affluence urban users, with a GMV trajectory that could top USD 100 billion by 2025. Kuaishou extends beyond short-form video into payments, compressing the path from demo to sale for lower-tier-city shoppers. Meanwhile, Meesho in India democratises entrepreneurship for small sellers by subsidising logistics and offering vernacular onboarding. Overall, technological differentiation and ecosystem lock-in are the primary levers shaping competitive position.
Social Commerce Industry Leaders
Meta Platforms Inc.
ByteDance Ltd.
Alibaba Group Holding Ltd.
PDD Holdings Inc.
Pinterest Inc.
- *Disclaimer: Major Players sorted in no particular order

Recent Industry Developments
- May 2025: Alibaba partnered with Xiaohongshu, China's Instagram-like platform, to enhance e-commerce capabilities, allowing seamless transitions from product recommendations to purchases on Taobao and Tmall, resulting in a 20% increase in click-through rates and doubled engagement.
- April 2025: TikTok expanded its Shop feature to additional European markets, following successful implementations in the UK and Southeast Asia, aiming to capture a larger share of the region's USD 146.35 billion social commerce market.
- March 2025: Meta Platforms launched enhanced AR try-on capabilities for beauty and fashion products on Instagram Shopping, enabling users to virtually test products before purchase, increasing conversion rates by approximately 30% for participating brands.
- February 2025: Alibaba announced a strategic partnership with Apple to integrate its Qwen AI model with iPhone services in China, positioning the company to leverage AI for enhanced personalisation in social commerce experiences.


Global Social Commerce Market Report Scope
A quickly expanding subset of e-commerce known as "social commerce" uses digital media and social networks to streamline transactions between companies and clients. The social commerce market is segmented by business model, product type, sales channel, and geography. By business model, the market is segmented into business-to-consumer (B2C), business-to-business (B2B), and consumer-to-consumer (C2C). By product type, the market is segmented into personal and beauty care, apparel, accessories, home products, health supplements, food and beverages, and other product types (toys, DIY, electronics, and furniture). The market is segmented by sales channel into video commerce, social network-led commerce, social reselling, group buying, and product review platforms. The market is segmented by geography into North America, Asia-Pacific, Europe, South America, and the Middle East & Africa. The report offers the market size for the social commerce market in value terms in USD for all the abovementioned segments.
| Business-to-Consumer (B2C) |
| Business-to-Business (B2B) |
| Consumer-to-Consumer (C2C) |
| Apparel |
| Personal and Beauty Care |
| Accessories |
| Home Products |
| Health Supplements |
| Food and Beverages |
| Other Product Types |
| Laptops and Desktops |
| Smartphone |
| Video Commerce |
| Social Network-Led Commerce |
| Social Reselling |
| Group Buying / Team Purchase |
| Product Review and Discovery Platforms |
| North America | United States |
| Canada | |
| Mexico | |
| Europe | Germany |
| United Kingdom | |
| France | |
| Spain | |
| Rest of Europe | |
| Asia-Pacific | China |
| India | |
| Japan | |
| South Korea | |
| Rest of Asia-Pacific | |
| South America | Brazil |
| Argentina | |
| Rest of South America | |
| Middle East | Saudi Arabia |
| United Arab Emirates | |
| Rest of Middle East | |
| Africa | South Africa |
| Nigeria | |
| Rest of Africa |
| By Business Model | Business-to-Consumer (B2C) | |
| Business-to-Business (B2B) | ||
| Consumer-to-Consumer (C2C) | ||
| By Product Type | Apparel | |
| Personal and Beauty Care | ||
| Accessories | ||
| Home Products | ||
| Health Supplements | ||
| Food and Beverages | ||
| Other Product Types | ||
| By Device | Laptops and Desktops | |
| Smartphone | ||
| By Sales Channel | Video Commerce | |
| Social Network-Led Commerce | ||
| Social Reselling | ||
| Group Buying / Team Purchase | ||
| Product Review and Discovery Platforms | ||
| By Geography | North America | United States |
| Canada | ||
| Mexico | ||
| Europe | Germany | |
| United Kingdom | ||
| France | ||
| Spain | ||
| Rest of Europe | ||
| Asia-Pacific | China | |
| India | ||
| Japan | ||
| South Korea | ||
| Rest of Asia-Pacific | ||
| South America | Brazil | |
| Argentina | ||
| Rest of South America | ||
| Middle East | Saudi Arabia | |
| United Arab Emirates | ||
| Rest of Middle East | ||
| Africa | South Africa | |
| Nigeria | ||
| Rest of Africa | ||


Key Questions Answered in the Report
What is the current value of the social commerce market and how fast is it growing?
The market is worth USD 2.11 trillion in 2026 and is on track to reach USD 7.55 trillion by 2031, reflecting a 29.12% CAGR.
Which region leads the social commerce market and which is growing fastest?
Asia-Pacific holds the largest 34.28% share, while North America posts the quickest 32.11% CAGR for 2026-2031.
Why is video commerce strategically important for brands?
Video compresses discovery and purchase into one interactive session, delivering conversion rates up to ten times higher than static listings and currently accounting for 43.22% of market share.
How are data-privacy regulations affecting social commerce expansion?
Divergent mandates such as the EU DMA and CPRA force platforms to build separate consent frameworks, raising costs and trimming the sector’s CAGR by about 2.7 percentage points.
Which sales channel is projected to grow the fastest through 2031?
Social reselling leads with a 34.26% CAGR by enabling peer-to-peer trust and leveraging community dynamics.
What technology trends are most likely to shape future market dynamics?
In-app digital wallets, hyper-personalized AI engines and cross-border logistics APIs are expected to drive adoption, reduce friction and open new demand pools over the next five years.
Page last updated on:


