Market Overview
| Study Period | 2020 - 2031 |
|---|---|
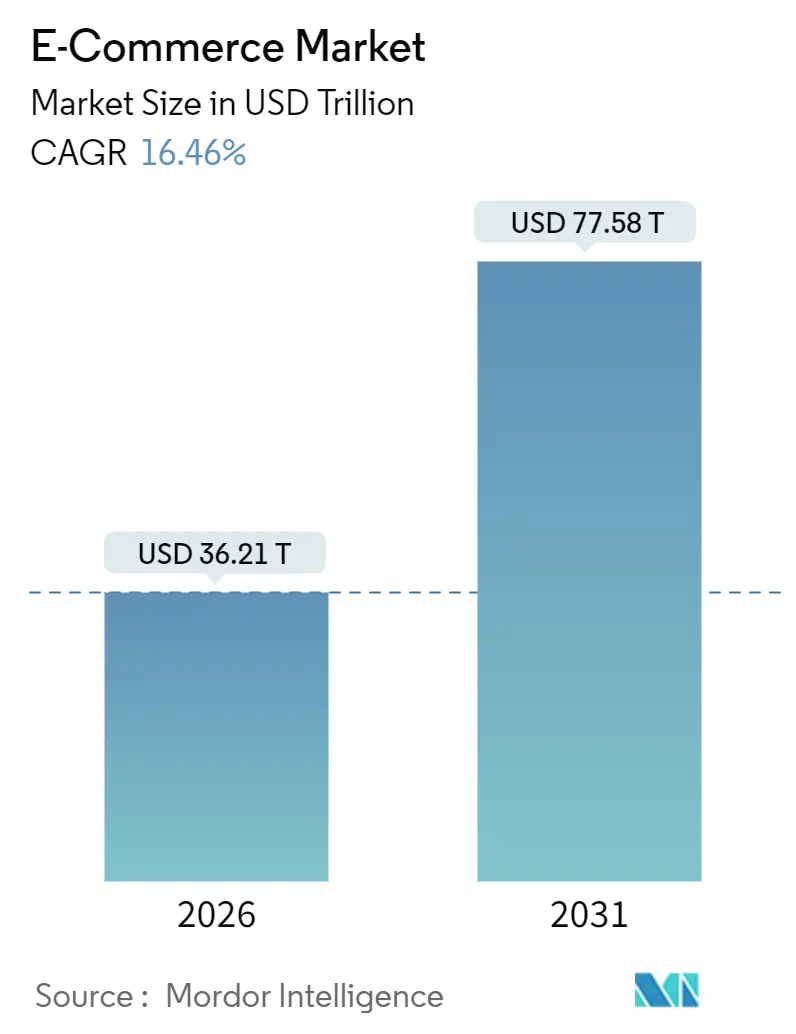
| Market Size (2026) | USD 36.21 Trillion |
| Market Size (2031) | USD 77.58 Trillion |
| Growth Rate (2026 - 2031) | 16.46% CAGR |
| Fastest Growing Market | South America |
| Largest Market | Asia Pacific |
| Market Concentration | Medium |
Major Players *Disclaimer: Major Players sorted in no particular order Image © Mordor Intelligence. Reuse requires attribution under CC BY 4.0. | |
E-commerce Market Analysis by Mordor Intelligence
The E-commerce Market size stands at USD 36.21 trillion in 2026 and is projected to reach USD 77.58 trillion by 2031, expanding at a 16.46% CAGR. Mobile-first adoption, embedded finance, and generative-AI merchandising are shortening purchase journeys, while 5G coverage and digital wallets have lowered checkout friction. Region-specific compliance layers, built in response to data-localization rules, are paradoxically accelerating local penetration, and sovereign payment rails such as India’s UPI and Brazil’s Pix are enlarging addressable demand. Enterprises are deploying AI agents that negotiate prices and curate baskets, transforming procurement workflows, and virtual-goods commerce is emerging as a fresh revenue pool.
Key Report Takeaways
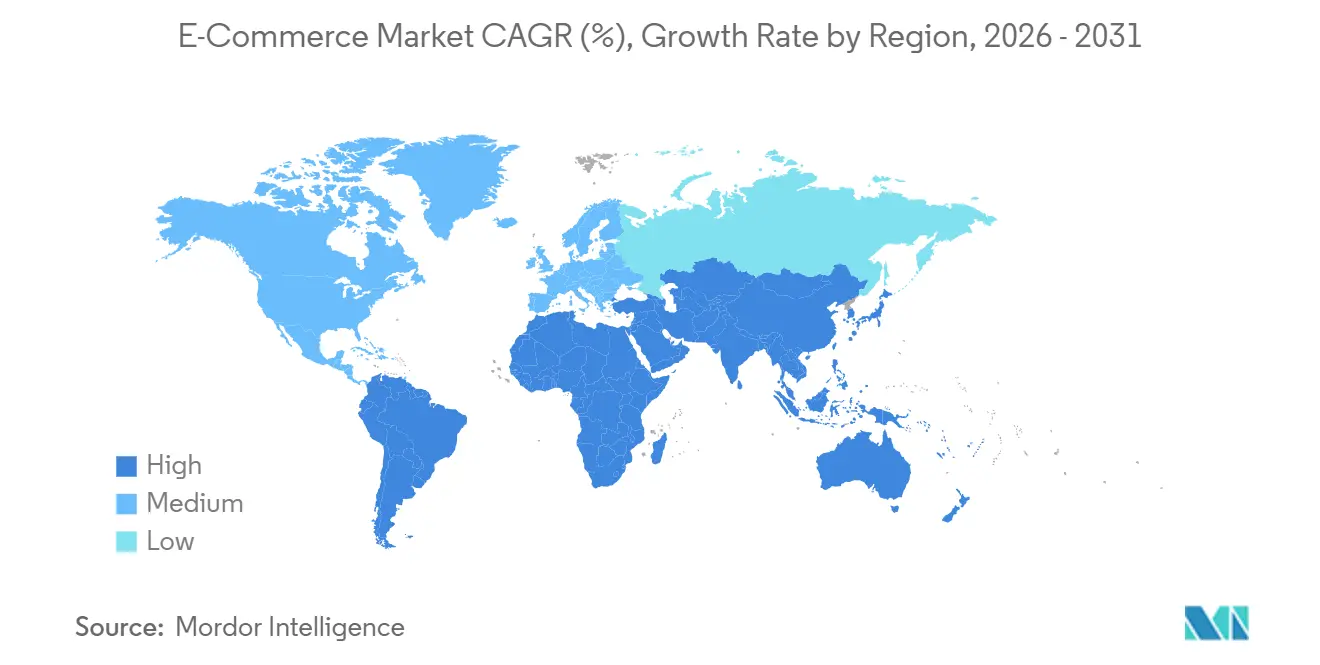
- By geography, Asia-Pacific accounted for 54.46% of revenue in 2025, while South America is forecast to expand at an 18.12% CAGR through 2031.
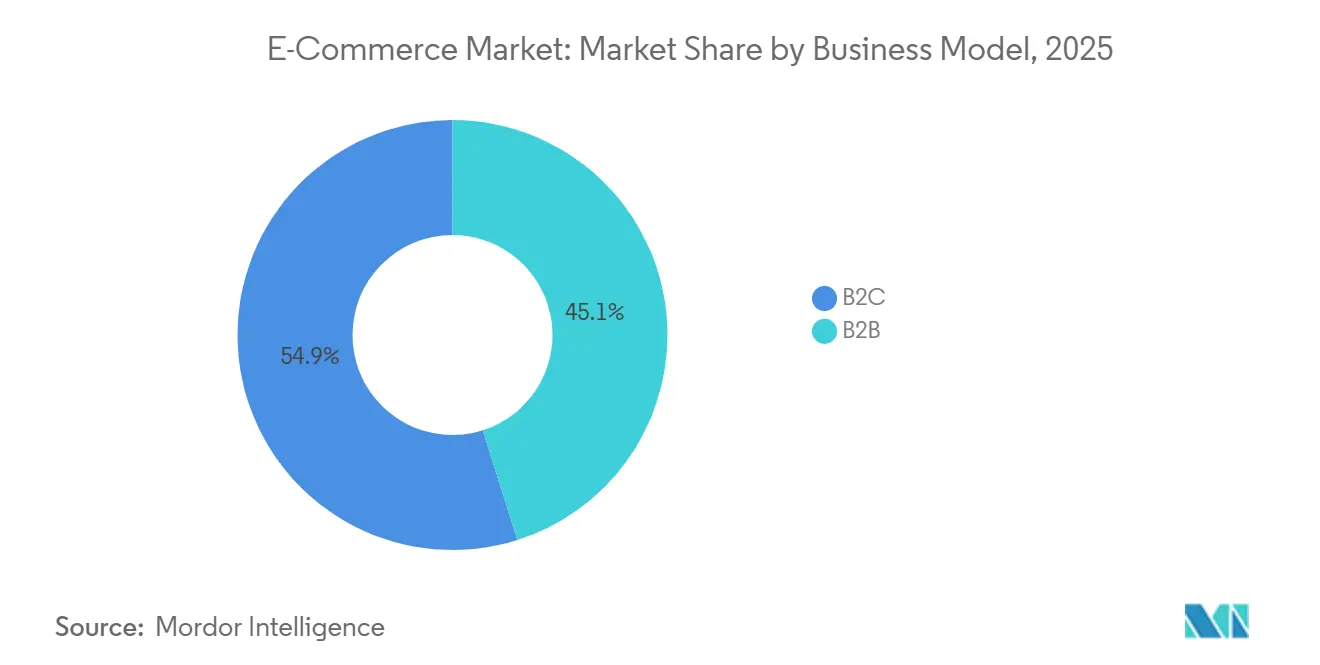
- By business model, B2C led with 54.89% share in 2025; B2B is advancing at a 17.43% CAGR to 2031.
- By device type, smartphones captured 72.67% of the E-commerce Market share in 2025 and are registering an 18.17% CAGR through 2031.
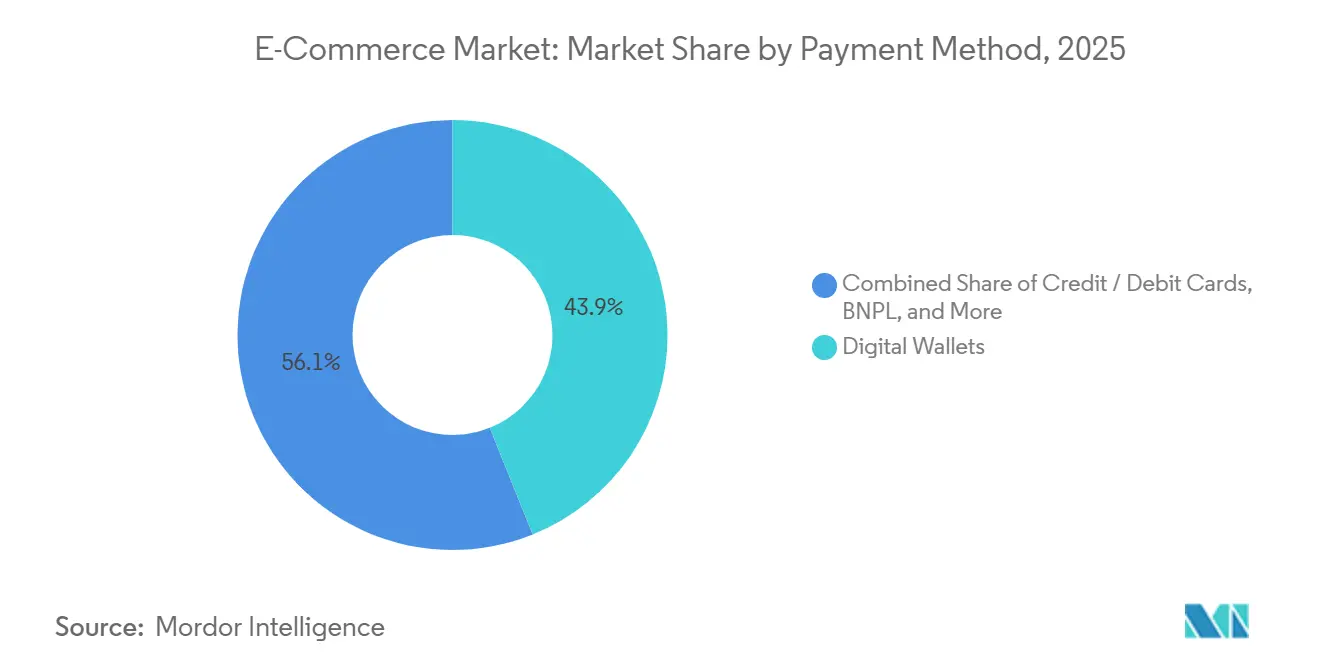
- By payment method, digital wallets contributed 43.92% to the E-commerce Market size in 2025 and Buy Now Pay Later is rising at a 19.28% CAGR.
- By product category, consumer electronics held 27.88% of the E-commerce Market size in 2025, while food and beverages is climbing at an 18.86% CAGR.
Note: Market size and forecast figures in this report are generated using Mordor Intelligence’s proprietary estimation framework, updated with the latest available data and insights as of January 2026.
Global E-commerce Market Trends and Insights
Drivers Impact Analysis*
| Driver | (~) % Impact on CAGR Forecast | Geographic Relevance | Impact Timeline |
|---|---|---|---|
| Accelerating Mobile-Internet and 5G Adoption | +3.2% | Global, APAC and Middle East | Medium term (2-4 years) |
| Rising Middle-Class Purchasing Power | +2.8% | APAC core, spill-over to Africa | Long term (≥4 years) |
| Expansion of Digital Wallets and Embedded Finance | +2.5% | Global, strong in South America and APAC | Short term (≤2 years) |
| Generative-AI-Powered Personalized Merchandising | +2.1% | North America and Europe, scaling to APAC | Medium term (2-4 years) |
| Commerce-as-a-Service Platforms Enabling Brand-Owned Channels | +1.8% | Global, highest SMB adoption in North America and Europe | Short term (≤2 years) |
| Direct-to-Avatar and Virtual Goods Commerce Boom | +1.4% | North America, South Korea, Japan | Long term (≥4 years) |
| Source: Mordor Intelligence | |||
Accelerating Mobile-Internet and 5G Adoption
Global mobile-internet subscriptions reached 5.6 billion in 2025, and 5G now covers 40% of the population. Latency has fallen below 10 milliseconds, enabling real-time augmented-reality try-ons that convert 30% better than static pages. Standalone 5G cores in India and Indonesia are helping rural merchants list inventory without fixed broadband. Southeast Asia’s mobile-only users expect same-day delivery, pressuring logistics providers to match urban service levels. The E-commerce Market is therefore shifting infrastructure budgets toward edge nodes and micro-fulfillment centers.
Rising Middle-Class Purchasing Power
Asia-Pacific added 70% of the 150 million new middle-class households formed between 2020 and 2025.[1]World Bank, “Global Middle-Class Outlook,” worldbank.org Disposable income growth in India, Vietnam, and the Philippines is steering spending toward discretionary categories with higher average order values. Platforms are localizing language interfaces and maintaining cash-on-delivery options where credit penetration is low. Customer acquisition costs in these markets are one-tenth those in mature economies, supporting aggressive subsidy strategies. As a result, the E-commerce Market enjoys durable demand tailwinds that offset saturation elsewhere.
Expansion of Digital Wallets and Embedded Finance
Digital wallets handled USD 9.5 trillion in 2024, overtaking cards.[2]JPMorgan Payments, “Global Payment Trends 2024,” jpmorgan.com Brazil’s Pix logged 42 billion instant-payment transactions in 2024.[3]Banco Central do Brasil, “Pix 2024 Statistics,” bcb.gov.br Embedded finance lets platforms underwrite small loans using transaction data inside regulatory sandboxes in Singapore, the UAE, and the UK. These capabilities raise conversion rates by 18% and generate behavioral data for dynamic pricing. Controlling the payment rail secures a defensible moat in the E-commerce Market.
Generative-AI-Powered Personalized Merchandising
Amazon’s Rufus handled 100 million customer queries per month by December 2025. Shopify’s Sidekick slashed SKU launch times by 40%. Generative models synthesize reviews, inventory, and browsing data to boost click-through rates by 22%. Early pilots show AI agents negotiating discounts, challenging static catalog pricing. Platforms that train proprietary models on billions of transactions will dominate recommendation quality and, by extension, wallet share within the E-commerce Market.
Restraints Impact Analysis*
| Restraint | (~) % Impact on CAGR Forecast | Geographic Relevance | Impact Timeline |
|---|---|---|---|
| Escalating Cyber-Security and Fraud Risks | -1.6% | Global, concentrated in North America and Europe | Short term (≤2 years) |
| Cross-Border Regulatory and Tax Complexity | -1.3% | Global, acute in EU, India, post-Brexit UK | Medium term (2-4 years) |
| Cookie-Deprecation Disrupting Ad Targeting | -1.1% | North America and Europe | Short term (≤2 years) |
| Sustainability-Linked Delivery Surcharges | -0.9% | Europe, California, select APAC cities | Long term (≥4 years) |
| Source: Mordor Intelligence | |||
Escalating Cyber-Security and Fraud Risks
Ransomware incidents doubled between 2023 and 2025, with remediation costs topping USD 200 million. Payment fraud reached USD 38 billion in 2024. The EU’s Digital Operational Resilience Act, effective January 2025, mandates 24-hour breach reporting and fines of up to 2% of global revenue.[4]European Commission, “Digital Operational Resilience Act,” ec.europa.eu Smaller merchants face disproportionate compliance costs, prompting migration to managed platforms. This consolidation raises entry barriers in the E-commerce Market.
Cross-Border Regulatory and Tax Complexity
The OECD’s 15% minimum tax and Europe’s VAT One-Stop Shop increased compliance costs for cross-border sellers by up to 18%.[5]Organisation for Economic Co-operation and Development, “Pillar Two Explained,” oecd.org India’s equalization levy adds 2% to transactions for platforms without local subsidiaries. Workarounds, such as geo-blocking or local partnerships, fragment inventory and dilute scale economies. Persistent administrative friction tempers international expansion plans within the E-commerce Market.
*Our forecasts treat driver/restraint impacts as directional, not additive. The impact forecasts reflect baseline growth, mix effects, and variable interactions.
Segment Analysis
By Business Model: B2B Procurement Digitization Accelerates
B2C accounted for 54.89% of the E-commerce Market share in 2025, but B2B transactions are growing faster at a 17.43% CAGR. Alibaba’s 1688.com processed USD 1.2 trillion in B2B orders in 2024.[6]Alibaba Group, “FY2025 Annual Report,” alibabagroup.com Larger average order values and embedded credit terms enhance unit economics.
B2C channels continue to benefit from social-commerce integration, yet growth in saturated markets relies on delivery speed and personalization rather than customer acquisition. Consequently, platform operators view digitizing industrial supplies, healthcare procurement, and foodservice distribution as the next revenue frontier in the E-commerce Market.


By Device Type: Mobile Dominance Reshapes Commerce Architecture
Smartphones captured 72.67% of transactions in 2025, expanding at an 18.17% CAGR. TikTok Shop’s mobile-native design delivered USD 20 billion in U.S. gross merchandise value in 2024. Biometric authentication has cut checkout abandonment by 25%.
Desktop usage remains relevant for high-ticket B2B purchases, yet voice-activated reorders via smart speakers are gaining ground. Platforms optimizing latency and one-tap checkout across mobile apps will secure enduring competitive advantage in the E-commerce Market.
By Payment Method: BNPL Regulatory Clarity Fuels Adoption
Digital wallets represented 43.92% of payment volume in 2025, whereas the Buy Now Pay Later segment is rising at a 19.28% CAGR. Klarna, Affirm, and Afterpay processed USD 350 billion in 2024 with default rates below 2%. Regulatory disclosure rules in the UK and U.S. have legitimized the model.
Card share is eroding as digital wallets and BNPL offer frictionless user experiences. Platforms are integrating multiple rails and intelligent routing to reduce costs and increase approval rates, further expanding the E-commerce Market size.

By B2C Product Category: Quick Commerce Transforms Food and Beverages
Consumer electronics held 27.88% of the E-commerce Market size in 2025, yet food and beverages is growing at an 18.86% CAGR. Quick-commerce firms such as Getir and Gopuff raised USD 3 billion in 2024 to fund micro-fulfillment networks.
Fashion, beauty, and home categories see average growth and benefit from virtual try-ons that cut return rates. Niche vertical platforms are surfacing in automotive parts and pet supplies, forcing generalist marketplaces to launch dedicated storefronts to retain share within the E-commerce Market.
Geography Analysis
Asia-Pacific generated 54.46% of global revenue in 2025, with China’s USD 2.8 trillion and India’s USD 350 billion e-commerce bases underpinned by UPI’s 131 billion transactions in 2024. South America, led by Brazil, is the fastest-growing region at an 18.12% CAGR, as Pix lowered checkout friction and MercadoLibre expanded logistics coverage.
North America and Europe remain sizeable markets, advancing above 14% annually as same-day delivery networks and subscription models deepen engagement. The Middle East is scaling rapidly, with UAE and Saudi Arabia offering duty-free e-commerce zones and cash-on-delivery support that cater to local preferences.
Africa shows the highest latent potential; mobile money ubiquity, epitomized by M-Pesa, offsets low banking penetration. Jumia and Konga are building fulfillment networks despite currency volatility and infrastructure gaps. Companies able to solve logistics constraints will unlock the next wave of E-commerce Market growth on the continent.

Competitive Landscape
The five largest platforms, Amazon, Alibaba, Walmart, JD.com, and Shopify, controlled roughly 35% of gross merchandise value in 2025. They leverage proprietary logistics fleets, cloud infrastructure, and AI recommendation engines to protect positions. Social-first entrants such as TikTok Shop and Temu are winning share by embedding commerce into content and offering factory-direct pricing.
Technology deployment is the principal differentiator. Shopify filed patents on decentralized inventory management and real-time pricing in 2024. Amazon operates 400,000 delivery vehicles, and Alibaba’s Cainiao network spans 200 countries, showcasing vertical integration.
Regional consolidation is accelerating, with Sea Ltd acquiring last-mile startups in Southeast Asia and MercadoLibre investing USD 2.5 billion to extend same-day coverage in South America. White-space opportunities persist in B2B procurement and quick-commerce grocery in tier-two cities across the E-commerce Market.
E-commerce Industry Leaders
Amazon.com Inc.
Alibaba Group Holding Limited
Walmart Inc.
JD.com Inc.
eBay Inc.
- *Disclaimer: Major Players sorted in no particular order

Recent Industry Developments
- December 2025: Amazon Web Services launched generative-AI tools that cut seller acquisition costs by 15%.
- November 2025: MercadoLibre committed USD 2.5 billion to add 50 fulfillment centers in South America.
- April 2025: Shopify integrated Shop Pay with TikTok, enabling one-tap purchases for 150 million U.S. users.
- March 2025: Alibaba’s Cainiao bought 51% of Yurtiçi Kargo for USD 1.1 billion, expanding European fulfillment.


Research Methodology Framework and Report Scope
Market Definitions and Key Coverage
Our study defines the global e-commerce market as the total value of goods and services purchased through internet-enabled transactions across business-to-consumer, business-to-business, and consumer-to-consumer models, measured at the point of payment authorization and converted to constant 2025 USD. Digital orders placed via websites, mobile apps, social-commerce feeds, voice assistants, and embedded APIs are captured, while subsequent logistics or payment-processing revenues are not.
Scope Exclusions: Gift card breakage, in-store "click-and-collect" payments settled offline, and the gross value of online advertising are excluded.
Segmentation Overview
- By Business Model
- B2C
- B2B
- By Device Type (B2C)
- Smartphone / Mobile
- Desktop and Laptop
- Other Device Types
- By Payment Method (B2C)
- Credit / Debit Cards
- Digital Wallets
- BNPL
- Other Payment Methods
- By Product Category (B2C)
- Beauty and Personal Care
- Consumer Electronics
- Fashion and Apparel
- Food and Beverages
- Furniture and Home
- Toys, DIY and Media
- Other Product Categories
- By Geography
- North America
- United States
- Canada
- Mexico
- Europe
- Germany
- United Kingdom
- France
- Spain
- Italy
- Netherlands
- Russia
- Rest of Europe
- Asia Pacific
- China
- Japan
- India
- South Korea
- Indonesia
- Thailand
- Malaysia
- Rest of Asia Pacific
- South America
- Brazil
- Argentina
- Chile
- Rest of South America
- Middle East
- United Arab Emirates
- Saudi Arabia
- Turkey
- Israel
- Rest of Middle East
- Africa
- South Africa
- Nigeria
- Kenya
- Egypt
- Rest of Africa
- North America
Detailed Research Methodology and Data Validation
Primary Research
Mordor analysts spoke with marketplace operators, payment gateways, 3PL managers, brand digital-commerce heads, and SME exporters across Asia, North America, Europe, and key frontier markets. These interviews validated conversion-rate assumptions, seasonality shifts, and the speed at which BNPL and live-commerce tools lift basket sizes.
Desk Research
We first mapped the demand pool using open datasets such as UNCTAD B2C e-commerce indexes, World Bank secure-server counts, U.S. Census retail e-commerce quarterly sales, Eurostat Digital Economy statistics, and national customs data on cross-border parcels. Company 10-Ks, investor decks, and large-scale household ICT surveys helped refine shopper penetration and average order value by region. Select paid resources, notably D&B Hoovers for merchant revenues and Dow Jones Factiva for deal news, filled critical gaps. This list is illustrative; many additional public and proprietary sources informed the evidence base.
Market-Sizing & Forecasting
A top-down construct scales country household consumption, enterprise procurement, and wholesale turnover, applying calibrated online-penetration ratios, cross-border shares, and channel mark-ups. Results are stress-tested through selective bottom-up checks of leading platform GMV and sampled ASP × unit volumes. Variables such as smartphone penetration, digital-wallet usage, logistics cost per drop, average return rate, and marketing cost of acquisition drive annual adjustments. A multivariate regression with lagged macro indicators plus scenario analysis (base, upside, downside) projects 2025-2030 values. Consensus ranges from expert calls guide the final scenario weighting. Gaps in sparse markets are bridged with regional analogs normalized by income and connectivity indexes.
Data Validation & Update Cycle
Outputs pass a two-step analyst review and variance screening against trade, tax, and payment volumes. Models refresh annually, and we trigger interim updates when material events occur, such as policy shifts, major platform mergers, or pandemic-scale shocks. A last-mile sense check is completed before each client delivery.
Why Our Global E-Commerce Baseline Commands Reliability
Published figures often diverge because firms apply different online-penetration cut-offs, include or omit B2B flows, and freeze exchange rates at varying dates.
Key gap drivers are the breadth of business models covered, currency translation cadence, and the treatment of GMV vs. net sales. Some publishers exclude industrial procurement or embed shipping fees, while others roll forward historical growth without surveying live-commerce uplift or fintech adoption trends.
Benchmark comparison
| Market Size | Anonymized source | Primary gap driver |
|---|---|---|
| USD 31.22 Tn (2025) | Mordor Intelligence | |
| USD 29.46 Tn (2024) | Global Consultancy A | Excludes emerging live-commerce markets and applies 2023 average FX rates |
| USD 26.80 Tn (2024) | Industry Association B | B2C focus, omits supplier-side B2B transactions |
| USD 5.58 Tn (2022) | Regional Consultancy C | Covers retail goods only, no services or cross-border flows |
These comparisons show that Mordor's disciplined scope, currency realignment to constant 2025 dollars, and annual shopper-behavior recalibration deliver a balanced, transparent baseline that decision-makers can trace back to clearly stated variables and repeatable steps.


Key Questions Answered in the Report
How fast is the global E-commerce Market expected to grow through 2031?
The E-commerce Market is forecast to expand at a 16.46% CAGR, reaching USD 77.58 trillion by 2031.
Which region will lead growth over the next five years?
South America is projected to post the fastest regional CAGR at 18.12%, supported by Pix instant payments and expanded logistics capacity.
What is driving adoption of Buy Now Pay Later at checkout?
Regulatory clarity in the UK and U.S. has legitimized BNPL, enabling providers to process USD 350 billion in 2024 with default rates below 2%.
Why is B2B e-commerce gaining traction?
Enterprises want consumer-grade experiences and embedded credit terms, prompting B2B channels to grow at 17.43% CAGR through 2031.
How are platforms addressing cyber-security risks?
New EU rules mandate 24-hour breach reporting, pushing smaller merchants onto managed platforms that can absorb compliance and security costs.
Which device type commands the majority of online transactions?
Smartphones accounted for 72.67% of transactions in 2025 and will continue to dominate as biometric one-tap checkout becomes standard.
Page last updated on:


