
Market Overview
| Study Period | 2020 - 2031 |
|---|---|
| Forecast Data Period | 2026 - 2031 |
| Base Year Market Size (2025) | USD 17.65 Billion |
| Market Size (2026) | USD 20.05 Billion |
| Market Size (2031) | USD 37.95 Billion |
| Growth Rate (2026 - 2031) | 13.61 % |
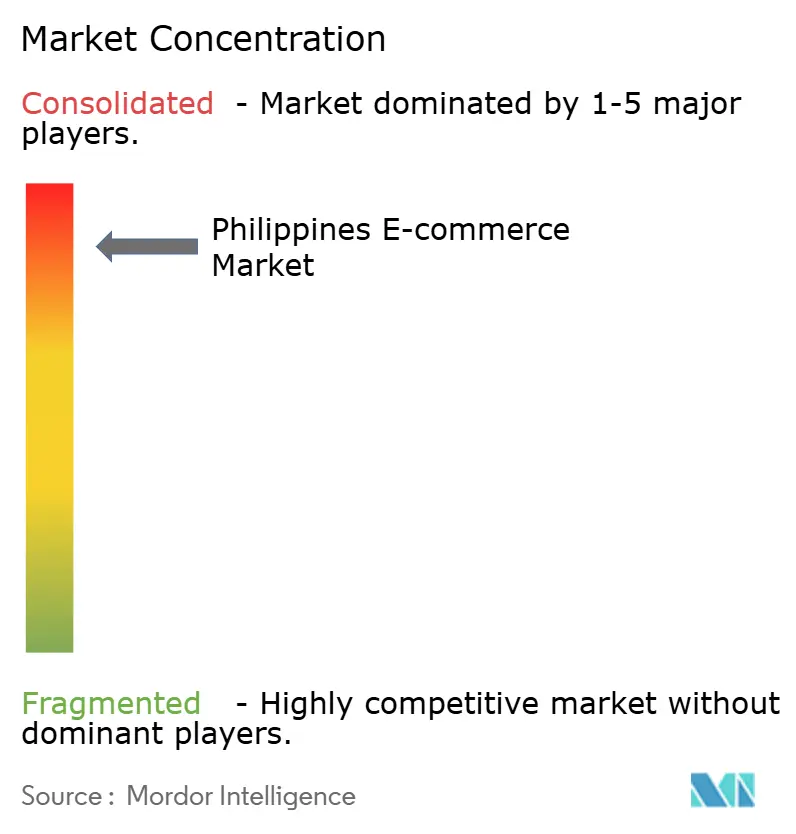
| Market Concentration | High |
Major Players *Disclaimer: Major Players sorted in no particular order Image © Mordor Intelligence. Reuse requires attribution under CC BY 4.0. | |
Philippines E-commerce Market Analysis by Mordor Intelligence
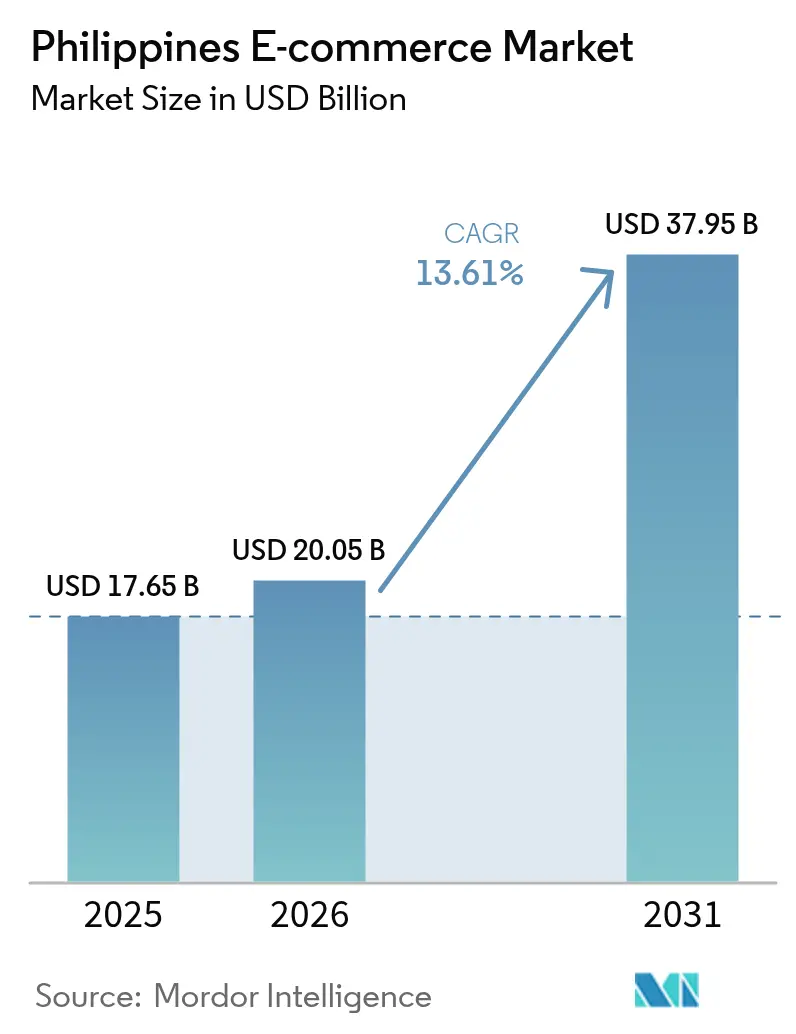
The Philippines e-commerce market size is expected to grow from USD 17.65 billion in 2025 to USD 20.05 billion in 2026 and is forecast to reach USD 37.95 billion by 2031 at 13.61% CAGR over 2026-2031. Its growth has been propelled by nationwide mobile-wallet penetration that exceeded 65% in 2024, the rollout of provincial logistics mini-hubs that shorten delivery routes across 7,641 islands, and policy targets that position digital trade as a core engine for the PHP 1.2 trillion e-commerce sector. Intensifying platform competition, the rapid uptake of Buy-Now-Pay-Later (BNPL) credit, and the concerted push to utilize the Regional Comprehensive Economic Partnership (RCEP) for tariff-free cross-border shipments have further expanded the Philippines e-commerce market’s addressable base. Merchant digitization programs led by the Department of Trade and Industry (DTI) accelerated SME onboarding, while AI-enhanced live-commerce tools raised conversion rates, especially in fashion and beauty streams.
Key Report Takeaways
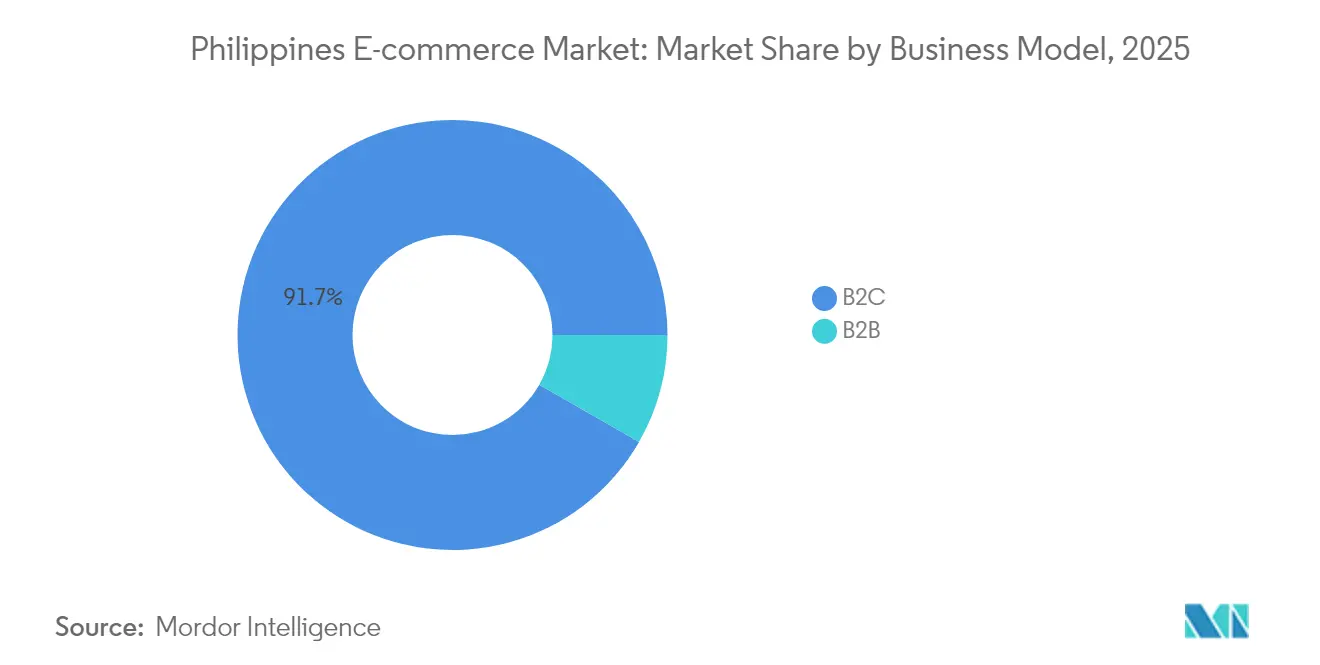
- By business model, B2C transactions captured 91.72% of the Philippines e-commerce market share in 2025, whereas B2B commerce is projected to expand at a 14.76% CAGR through 2031.
- By Payment Mode for B2C E-commerce, mobile wallets controlled 64.74% of 2025 value, but BNPL is expected to post 15.45% CAGR to 2031.
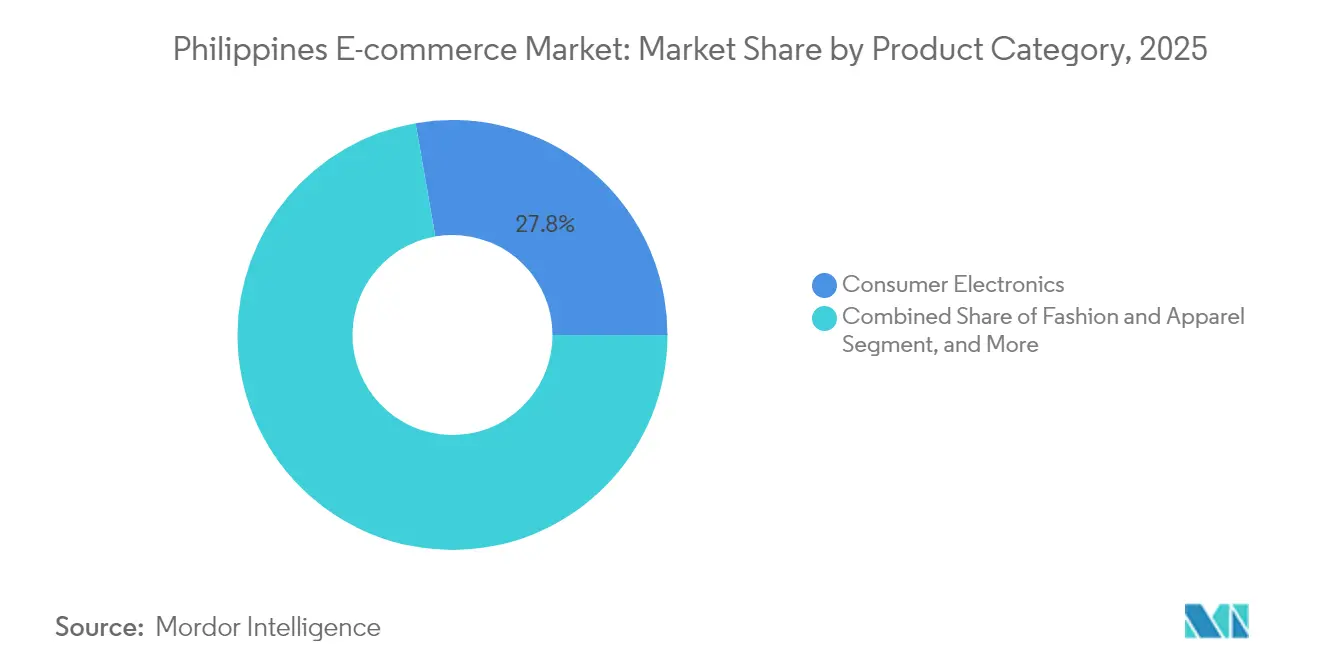
- By Product Category for B2C E-commerce, Consumer Electronics held 27.75% of 2025 revenue, while Food and Beverages are slated to grow at 14.41% CAGR to 2031.
- By device type, smartphones generated 78.52% of sales in 2025 and are also the fastest-growing device segment at 13.92% CAGR through 2031.
Note: Market size and forecast figures in this report are generated using Mordor Intelligence’s proprietary estimation framework, updated with the latest available data and insights as of 2026.
Philippines E-commerce Market Trends and Insights
Drivers Impact Analysis*
| Driver | (~) % Impact on CAGR Forecast | Geographic Relevance | Impact Timeline |
|---|---|---|---|
| Soaring mobile-wallet penetration | +3.2% | National, strongest in NCR & Central Visayas | Short term (≤ 2 years) |
| Logistics mini-hubs in provincial cities | +2.8% | Luzon-Other, Visayas, Mindanao | Medium term (2-4 years) |
| Rapid cross-border social-commerce adoption | +2.1% | National; early gains in NCR, Cebu, Davao | Medium term (2-4 years) |
| Digital-payment mandates for government fees | +1.9% | National | Short term (≤ 2 years) |
| MSME onboarding incentives | +1.5% | National | Long term (≥ 4 years) |
| AI-powered live-commerce engagement | +1.8% | National | Medium term (2-4 years) |
| Source: Mordor Intelligence | |||
Soaring Mobile-Wallet Penetration Transforms Payment Infrastructure
Mobile wallet adoption is accelerating across the Philippines, with GCash amassing 94 million users by early 2025, while Maya widened its wallet with credit extensions such as the Maya Black card, raising digital payments to 52.8% of retail transaction volume in 2023.[1]Bangko Sentral ng Pilipinas, “2023 Report on E-payments Measurement,” bsp.gov.ph Visa’s integrations let 87% of surveyed Filipinos fund wallets using cards, blurring lines between traditional banking and app-based finance. Seamless linkages between wallets and marketplaces have lowered merchant onboarding hurdles, pushed unbanked consumers into formal channels, and enlarged the Philippines e-commerce market’s daily active buyer pool. Super-app roadmaps now embed savings, credit, and insurance modules that tether users to commerce ecosystems. This payment ubiquity has shortened checkout flows and lifted repeat-purchase frequency.
Logistics Mini-Hubs Enable Provincial Commerce Expansion
Courier groups such as J&T Express and Ninja Van scaled fleet capacity and opened sub-depot networks in Cebu, Iloilo, and Davao, cutting delivery lead-times by up to 30% relative to Metro Manila fulfilment routes. Central Visayas, which logged 7.3% GRDP growth in 2024, now enjoys same-day delivery for high-velocity SKUs, unlocking pent-up provincial demand.[2]SunStar Publishing, “Central Visayas Still PH’s Fastest Growing Economy,” sunstar.com.ph Mini-hub economics also reduce failed-delivery rates in remote municipalities, boosting merchant margins. Enhanced route density improves asset utilization, persuading platforms to list bulky and perishable goods that previously faced prohibitive freight costs. The model is replicable across Mindanao’s secondary cities, indicating sustained upside for the Philippines e-commerce market.
Rapid Cross-Border Social-Commerce Adoption
Live commerce platforms such as TikTok Shop, along with marketplace global seller programs, offer tariff-free sourcing under RCEP, encouraging Filipino buyers to access Japanese beauty items and Korean gadgets at lower landed cost. DTI’s Philippine e-Commerce Platform (PEP Store) launched in July 2025 with 350 domestic brands to balance the import influx and link local MSMEs to overseas consumers. Early movers in cross-border beauty have mirrored Vietnamese sellers’ 50% export value surge, signaling untapped export upside. Younger demographics-responsible for 68.6% rise in peer-to-peer wallet transfers-drive livestream shopping, pushing the Philippines e-commerce market toward entertainment-centric retail formats. Platforms must now curate interactive feeds rather than static catalogs.
AI-Powered Live-Commerce Engagement
Sea Limited rolled out OpenAI-powered scripts that auto-generate product recommendations during Shopee live sessions, while Lazada tested dynamic pricing bots that adjust offers in real time. Conversion rates in AI-assisted streams run three to five times higher than on-site browsing, especially in fashion and cosmetics where real-time Q&A reduces purchase anxiety. GCash applies machine-learning fraud filters to transaction data, giving merchants granular risk scores and lowering charge-back ratios. Personalization engines tap browsing history to queue tailored vouchers, nudging basket size upward. These AI utilities differentiate platforms and cement the Philippines e-commerce market’s reputation as Southeast Asia’s live-commerce test lab.
Restraints Impact Analysis*
| Restraint | (~ ) % Impact on CAGR Forecast | Geographic Relevance | Impact Timeline |
|---|---|---|---|
| High last-mile costs outside NCR | -2.4% | Luzon-Other, Visayas, Mindanao | Medium term (2-4 years) |
| Fragmented VAT compliance among merchants | -1.8% | National, acute in MSME segments | Short term (≤ 2 years) |
| Data-privacy skills gap in SMEs | -1.2% | National | Long term (≥ 4 years) |
| Port congestion and customs delays | -1.6% | National | Medium term (2-4 years) |
| Source: Mordor Intelligence | |||
High Last-Mile Costs Outside NCR
Deliveries to far-flung islands often exceed 15% of order value, eroding margins on low-ticket grocery and FMCG items that are climbing at 14.67% CAGR. Multi-modal routes involving inter-island ferries and provincial roads remain vulnerable to typhoons, creating fulfillment unpredictability. Although mini-hubs narrow cost gaps, network density in Luzon-Other and Mindanao is still thin, compelling couriers to levy surcharges. Consumers outside NCR also show lower disposable income, compressing price ceilings for delivery fees. Without accelerated infrastructure spending under public-private logistics partnerships, last-mile friction will keep suppressing the Philippines e-commerce market’s rural penetration.
Fragmented VAT Compliance Among Merchants
DTI’s push for electronic invoicing aims to alleviate mosaic tax rules, yet many MSMEs lack accounting resources and avoid formal registration despite incentives such as BMBE exemptions. Cross-border sellers face overlapping value-added-tax and import duties, generating reconciliation headaches that discourage participation. Platforms must therefore build automated tax modules to retain small sellers. Until rule harmonization reaches local governments, compliance uncertainty will drag on Philippines e-commerce market onboarding velocity.
*Our forecasts treat driver/restraint impacts as directional, not additive. The impact forecasts reflect baseline growth, mix effects, and variable interactions.
Segment Analysis
By Business Model: B2B Momentum Narrows the Gap
B2C held 91.72% of the Philippines e-commerce market share in 2025, translating into sizeable absolute GMV, yet the B2B vertical is expanding at 14.76% CAGR and is set to unlock larger basket values. The Philippines e-commerce market size associated with electronic procurement for manufacturers and distributors is rising as firms migrate away from fax and phone orders in favor of digital portals that consolidate spending and integrate credit terms.
Corporate buyers now demand embedded finance-UnionBank’s API partnerships allow invoice-based lending directly within procurement dashboards-signaling that payment rails will shape B2B platform selection. Investor appetite for wholesaler-centric marketplaces such as Growsari, which raised USD 17.8 million, underscores confidence that B2B service depth will compress B2C’s historical dominance in the Philippines e-commerce market.



By Device Type for B2C E-commerce: BNPL Scales Credit Access
Mobile wallets represented 64.74% of transaction value in 2025, but Other Payment Modes are forecast to log a 15.45% CAGR, expanding the Philippines e-commerce market size accessible to underbanked shoppers. BillEase, already profitable in 2023, embedded its installment option across 10,000 merchants, enabling small-ticket splits without card credentials.
Wallet operators like Maya now white-label BNPL plugins, merging credit scoring with wallet KYC data to mitigate default risk. Cash-on-delivery has shrunk as trust in digital refunds improves, while real-time bank transfers receive regulatory backing under the InstaPay rail. Payment providers that deliver holistic ecosystems-credit, savings, insurance-will capture the Philippines e-commerce market’s next growth wave.
By Product Category for B2C E-commerce: Grocery Digitization Accelerates
Consumer Electronics secured 27.75% of 2025 revenue, but food and beverages are on track for the fastest 14.41% CAGR, driven by social group-buy platforms such as SariSuki, whose gross merchandise value multiplied 36-fold between 2023 and 2025. Community leaders consolidate neighborhood orders, leveraging mini-hub drop-offs that sidestep traditional wet-market visits.
Cross-border beauty imports flourish under RCEP; Filipino livestream sellers bundle Korean skincare into flash deals that routinely sell out in minutes. AI sizing tools and virtual try-ons decrease return rates in fashion. Furniture remains logistics-constrained, though platform-managed line-haul agreements slowly improve fee transparency. Overall, diversified category depth makes the Philippines e-commerce market resilient against saturation in electronics.
By Device Type for B2C E-commerce: Smartphone-First Commerce Deepens
Smartphones generated 78.52% of GMV in 2025 and are climbing at 13.92% CAGR, reinforcing a mobile-only design ethos among platforms. Responsive web apps mimic native-app performance, while 5G rollout in 2025 boosted average download speed by 36%, encouraging video-rich live commerce that anchors the Philippines e-commerce market.
Desktops remain essential for enterprise sourcing and high-consideration purchases, but their share inches downward as smartphone screen sizes reach 6.7 inches and foldables proliferate. Tablets sit in a niche for content creators and home schooling. Platform roadmaps center on voice search, AR visualization, and geo-tagged vouchers, illustrating how mobile hardware capabilities steer service innovation.
Geography Analysis
NCR retained the largest slice of 2025 spend owing to dense logistics infrastructure, same-day fulfillment and a payments ecosystem that bundles SeaBank, ShopeePay and GCash super-app functions. However, NCR’s growth trajectory moderates as platform saturation sets in and user acquisition costs climb.
Central Visayas, led by Cebu’s significant asset base, has emerged as the fastest-growing regional market. Regional hubs reduce delivery times to nearby islands, encouraging FMCG sellers to experiment with same-day grocery deliveries. Government tourism initiatives and BPO inflows are boosting disposable income, driving the adoption of live-commerce entertainment tailored to mobile-centric lifestyles.
Luzon-Other and Mindanao still wrestle with logistics gaps and lower wallet adoption, but policy aid through programs like OTOP and Go Lokal has driven PHP 3.11 billion in artisanal sales since 2017. As mini-hubs proliferate and 5G coverage south of Metro Manila improves, these zones present the Philippines e-commerce market with white-space for category-specific expansion-especially agriproducts and regional delicacies that enjoy local supply-chain advantages.
Regulatory Landscape
The Philippines e-commerce market operates under the Internet Transactions Act of 2023 (Republic Act No. 11967), which covers online merchants, e-marketplaces, and other e-commerce participants, and formalizes consumer protection and platform accountabilities. The Implementing Rules and Regulations were issued on May 24, 2024, and the Act established an E-Commerce Bureau under the Department of Trade and Industry (DTI), including the E-Commerce Philippine Trustmark and mechanisms that strengthen disclosure and transaction safeguards for B2C activity.
Compliance pressure is also rising across payments, taxation, and government digitization. BIR Revenue Regulations No. 3-2025 sets tax compliance requirements for digital service providers, including those acting as e-marketplaces, tightening reporting and registration obligations that can affect both domestic and non-resident providers. On the financial-rails side, the Bangko Sentral ng Pilipinas (BSP) has moved toward stronger authentication controls for BSP-supervised entities, with June 2026 requirements tied to phishing-resistant, device-bound authentication (for example, FIDO2/passkeys). This raises technical and operational compliance baselines for platforms and their payment partners.
Value Chain Analysis
The Philippines e-commerce value chain starts with product sourcing (local MSMEs and brand principals, plus cross-border sellers), moves into platform enablement (marketplaces, social commerce, and live-commerce tools), and then into checkout and risk control (GCash, Maya, QR Ph, InstaPay, PESONet, and BNPL providers). The flow ends at fulfillment (warehousing, sorting, line-haul, last-mile, and returns) across an archipelagic delivery footprint. Government agencies shape several nodes, with the DTI driving merchant digitization and trust-building initiatives, while the Internet Transactions Act framework sets marketplace obligations that flow into seller onboarding, content standards, and dispute handling.
Fulfillment capacity is increasingly facility-led and corridor-led, with new hubs supporting faster inventory positioning outside Metro Manila. In June 2026, Fast Retailing Philippines Inc. opened a Uniqlo logistics facility in Riverpark, Cavite, adding an anchor node that supports higher-throughput e-commerce replenishment and returns processing. International freight and express capabilities are also expanding via Clark, where UPS finalized plans tied to a September 2026 opening of its expanded hub, strengthening time-definite inbound and outbound flows for cross-border assortment, spare parts, and higher-value parcels.
Competitive Landscape
Shopee, Lazada and TikTok Shop dominate GMV and spend aggressively on integrated financial services that deepen user stickiness. Shopee’s linkage with SeaBank lets shoppers open savings accounts and secure microloans without leaving the app, a strategy that widens the Philippines e-commerce market funnel. Lazada leverages Alibaba’s Cainiao logistics stack and AI product-matching engine to raise seller conversion and lower delivery costs.
TikTok Shop pivots on creator-led livestreams where AI co-hosts moderate chats and suggest add-on bundles, generating click-through rates markedly higher than static listings. Etaily’s USD 17.8 million war chest illustrates demand for category specialists that manage end-to-end brand commerce from content to cross-border fulfillment.
Barriers to entry center on VAT compliance and data-privacy adherence, compelling new entrants to invest in automated regulatory modules. Embedded-finance newcomers such as UNO Digital Bank secured USD 32.1 million to offer white-label credit tools, signaling convergence between fintech and retail stacks. As live-commerce, AI and financial services intersect, future leadership will hinge on ecosystem breadth rather than price subsidy races.
Philippines E-commerce Industry Leaders
Sea Ltd.
Alibaba Group
ByteDance Ltd.
Global Fashion Group
Amazon.com Inc.
- *Disclaimer: Major Players sorted in no particular order

Market Opportunities and Future Outlook
Formalization and compliance tooling create a build-and-sell opportunity inside the Philippines e-commerce market. As RA 11967 enforcement and BIR digital-services rules increase the need for automated onboarding, seller verification, product disclosure workflows, e-invoicing support, and VAT computation for both domestic and cross-border sellers, platforms and enablers that package compliance-as-a-service (trustmark readiness, dispute management, and standardized disclosures) can reduce friction for MSMEs with fragmented VAT practices. This approach also supports buyer trust and conversion.
Payments and discovery are shifting toward QR-first, mobile-native, and AI-assisted shopping experiences, which opens space for merchants and platforms to improve small-ticket conversion and social commerce execution. In 1H 2026, PayMongo reported QR Ph accounted for 55% of payment volume on its platform, up from 16% in 1H 2025, underscoring operating leverage from QR-linked acceptance and lower-friction checkout flows for SMEs. On the demand-generation side, social commerce adoption is already high among Filipino online shoppers, and capability upgrades such as generative-AI shopping search integrations strengthen the case for seller SaaS bundles that combine content creation, live-selling operations, and conversion analytics.
Recent Industry Developments
- July 2026: PayMongo reported that QR Ph accounted for 55% of payment volume on its platform in 1H 2026, up from 16% in 1H 2025. The shift points to faster merchant and consumer migration to QR-linked, mobile-first acceptance for everyday e-commerce checkouts. For marketplaces and payment partners, it elevates the priority of QR enablement, reconciliation tooling, and fraud controls designed for high-frequency, low-ticket transactions.
- June 2025: The Department of Trade and Industry (DTI) began full enforcement of the Internet Transactions Act (RA 11967), requiring online merchants and marketplaces to meet disclosure obligations such as price, brand, and product condition. Enforcement raises compliance and operating standards across seller onboarding, listing governance, and dispute handling. Platforms that systematize these requirements can strengthen trust-building and improve merchant retention as scrutiny increases.
- May 2024: The Implementing Rules and Regulations (IRR) for the Internet Transactions Act of 2023 (RA 11967) were promulgated, detailing how the law is operationalized for e-commerce participants. The IRR clarified obligations for online sellers and platforms, accelerating investment in compliance workflows and consumer protection processes. It also reinforced the DTI-led institutional setup behind trustmarks and broader oversight of online transactions.


Research Methodology Framework and Report Scope
Market Definition and Coverage
For this report, the Philippines e-commerce market is defined as the value of goods and services sold through online channels to buyers located in the Philippines, across consumer and business transactions, and counted in current USD.
Scope exclusions: Offline-only retail sales, pure C2C reselling between individuals, and non-commerce digital services (such as online media or ride-hailing) are not included.
Segmentation Overview
- By Business Model
- B2B
- B2C
- By Payment Mode for B2C E-commerce
- Credit/Debit Cards
- Mobile Wallets
- Other Payment Modes for B2C E-commerce
- By Product Category
- Beauty and Personal Care
- Consumer Electronics
- Fashion and Apparel
- Food and Beverages
- Furniture and Home
- Toys, DIY and Media
- Other Product Categories for B2C E-commerce
- By Device Type for B2C E-commerce
- Smartphone
- Desktop/Laptop
- Other Device Types for B2C E-commerce
Data Sources, Market Sizing, and Validation
Desk Research
Desk work started with public macro and digital-trade indicators to set realistic demand boundaries before we built the model. We referenced sources such as the Philippine Statistics Authority for digital economy and sector output indicators, the Bangko Sentral ng Pilipinas for digital payments adoption signals, and the Department of Trade and Industry for e-commerce policy and merchant digitization programs.
To ground the supply and logistics side, we also reviewed open materials such as Bureau of Customs trade releases, National Telecommunications Commission and ITU connectivity indicators, and press releases from relevant industry associations where available. Company annual reports, investor presentations, and audited filings helped us interpret business-model mixes and typical take rates. We then used a paid subscription database covering company financials and another covering shipment-level trade records selectively to cross-check scale and timing. The sources listed above are illustrative only, and many other public references were also used for data collection, validation, and clarification during analysis.
Primary Interviews and Surveys
Primary calls and short surveys were used to close gaps that public sources do not answer cleanly, especially on channel mix, pricing mechanics, and the practical split between B2C and B2B online selling. We spoke with a mix of marketplace operators, online-first merchants, logistics and fulfillment participants, payments stakeholders, and category specialists across the Philippines, and the discussions were used to confirm assumptions and adjust inputs that looked inconsistent in desk findings.
Distribution of primary research fieldwork respondents
| Company type | Respondent position |
|---|---|
| Top tier: 36% | CXOs: 17% |
| Mid tier: 47% | Functional/Unit leaders: 40% |
| Smaller Players: 17% | Managers: 43% |
Market-Sizing & Forecasting
Sizing was built using a top-down approach once, where household consumption patterns, digital payment usage, internet shopper penetration, and category-level online share assumptions were used to reconstruct the Philippines online buying pool in value terms. To keep the totals realistic, we then corroborated the outcome with selective bottom-up checks, such as sampled GMV to revenue conversions, channel checks with merchants, and sanity checks against platform take-rate ranges that interviews helped confirm.
Key inputs used in the model included smartphone and broadband access trends, digital wallet and card usage indicators, delivery coverage and serviceability constraints, typical order values by major product groups, and observed shifts in promotion intensity that affects effective selling prices. Where bottom-up signals were incomplete for smaller categories or informal sellers, gaps were handled by applying category-level online share ranges and then rechecking them through expert feedback and known seasonality (for example, major sale events) before finalizing.
Forecasts were produced with scenario analysis supported by simple regression-style relationships between e-commerce value and drivers like payments usage, connectivity, and real consumption growth. The outlook was then adjusted based on what industry participants expected for price inflation, discounts, and logistics capacity over the forecast period.
Data Validation & Update Cycle
Outputs were checked through triangulation across independent signals, and unusual jumps were investigated before numbers were signed off. We compared the implied e-commerce intensity against payment activity trends, logistics readiness, and macro consumption growth, and then rechecked any large variance between channels or categories that did not align with interview feedback.
A multi-step internal review is followed so assumptions, formulas, and year-to-year transitions are tested for consistency. Re-contact is triggered when a key input moves outside the expected range. Reports are refreshed annually, with interim updates when material events change demand or supply conditions, and just before delivery an analyst completes a final pass so clients receive the latest updated view.
Mordor Intelligence's Philippines Ecommerce Market Size Compared Against Other Published Estimates
Published e-commerce numbers often vary because some sources track GMV, while others track revenue captured by platforms and merchants, and currency timing plus tax and fee treatment can also change the total. Differences also show up when B2B online transactions are included in one estimate but treated as out of scope in another.
The table points to a wide spread, which is usually explained by how each publisher converts checkout value into market value, plus how they treat cross-border orders, shipping fees, and returns in the final total. In Mordor Intelligence's model, the market value is aligned to e-commerce revenue in the Philippines and is built with explicit splits for B2C and B2B, which reduces overcounting that can happen when GMV-style totals are used without consistent netting assumptions.
Benchmark comparison
| Source | Market Size | Gaps in Research Methodology |
|---|---|---|
| Mordor Intelligence | USD 17.65 B (2025) | |
| Digital Economy Report A | USD 24.00 B (2025) | Uses GMV for e-commerce, which reflects the full value of goods sold online and can sit above revenue-based measures when take rates, returns, and fee netting are not treated the same way. |
| Industry Data Provider B | USD 24.10 B (2024) | Uses local-currency retail e-commerce value and a different year, and the figure can shift with FX conversion timing and whether cross-border orders, shipping, and taxes are included in the reported total. |
Taken together, the comparison shows that scope and value definition drive most of the gap, more than arithmetic differences. By keeping assumptions visible (GMV versus revenue, B2B treatment, and FX timing) and pressure-testing them with interviews, we arrive at a market value that is easier to trace back to real demand and repeatable inputs year after year.


Key Questions Answered in the Report
How large was online retail spending in the Philippines in 2026?
The Philippines e-commerce market size reached USD 20.05 billion in 2026.
What annual growth is expected for digital commerce through 2031?
Gross merchandise value is projected to rise at a 13.61% CAGR from 2026 to 2031.
Which payment method leads Philippine online check-outs today?
Mobile wallets held 64.74% of 2025 transaction value, the highest among all methods.
Which product line is expanding the fastest on Philippine platforms?
Food and Beverages items are forecast to grow at a 14.41% CAGR through 2031.
Which region outside Metro Manila shows the quickest e-commerce upswing?
Central Visayas is the fastest-growing, backed by Cebu’s strong economic base and logistics hubs.
Page last updated on:


 Your data is secure and never sold or shared.


