
Market Overview
| Study Period | 2020 - 2031 |
|---|---|
| Market Size (2026) | USD 12.41 Billion |
| Market Size (2031) | USD 28.54 Billion |
| Growth Rate (2026 - 2031) | 18.12 % |
| Fastest Growing Market | Asia Pacific |
| Largest Market | North America |
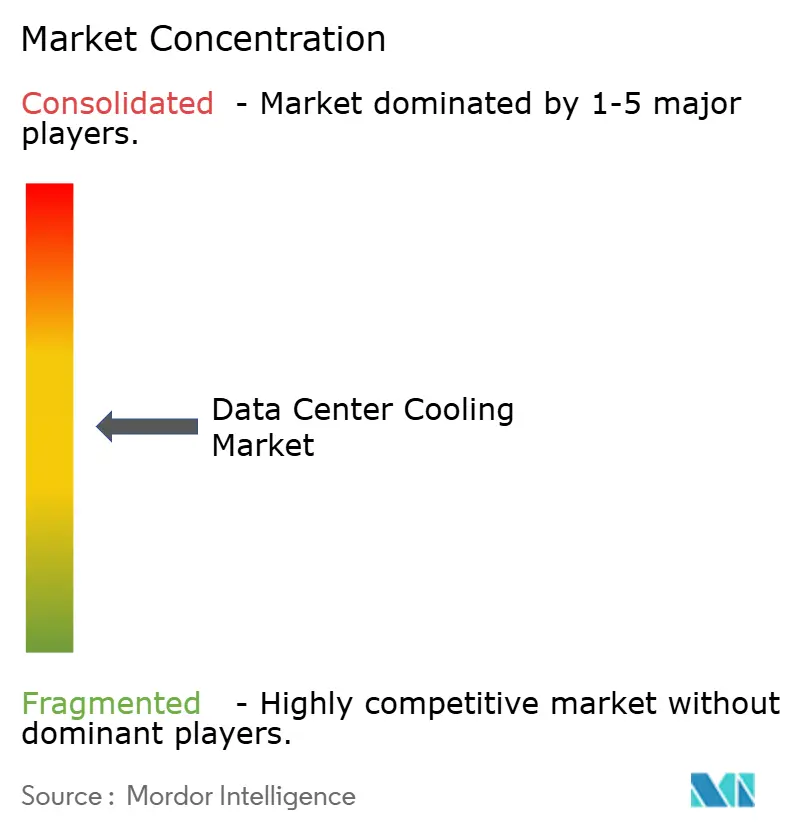
| Market Concentration | Medium |
Major Players *Disclaimer: Major Players sorted in no particular order Image © Mordor Intelligence. Reuse requires attribution under CC BY 4.0. | |
Data Center Cooling Market Analysis by Mordor Intelligence
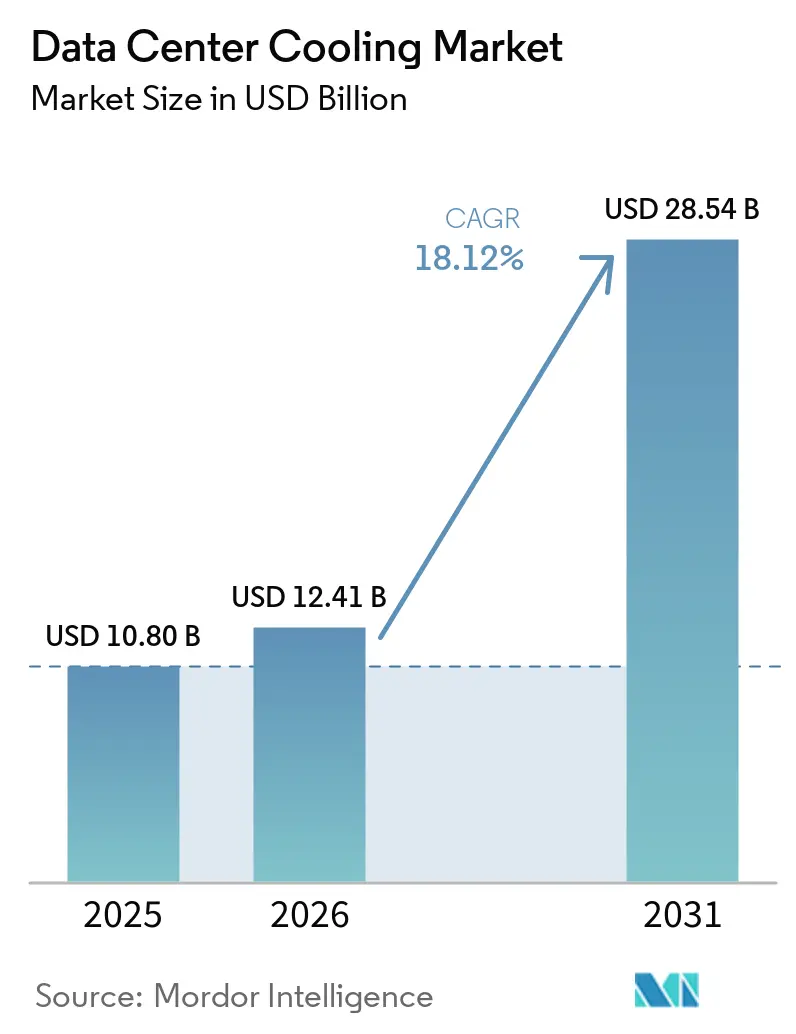
The Data Center Cooling Market size is projected to be USD 10.80 billion in 2025, USD 12.41 billion in 2026, and reach USD 28.54 billion by 2031, growing at a CAGR of 18.12% from 2026 to 2031.
Ongoing migration from air-based to liquid-based thermal systems underpins this expansion, while hyperscale build-outs, AI chip heat loads, and low-GWP refrigerant mandates reinforce near-term purchasing momentum.
Competitive dynamics intensified in 2024-2025: Johnson Controls divested USD 8.1 billion of HVAC assets to Bosch to double down on data center-specific chillers, and Schneider Electric added immersion specialist Motivair to its portfolio, signaling a strategic pivot toward liquid engineering.
Key Report Takeaways
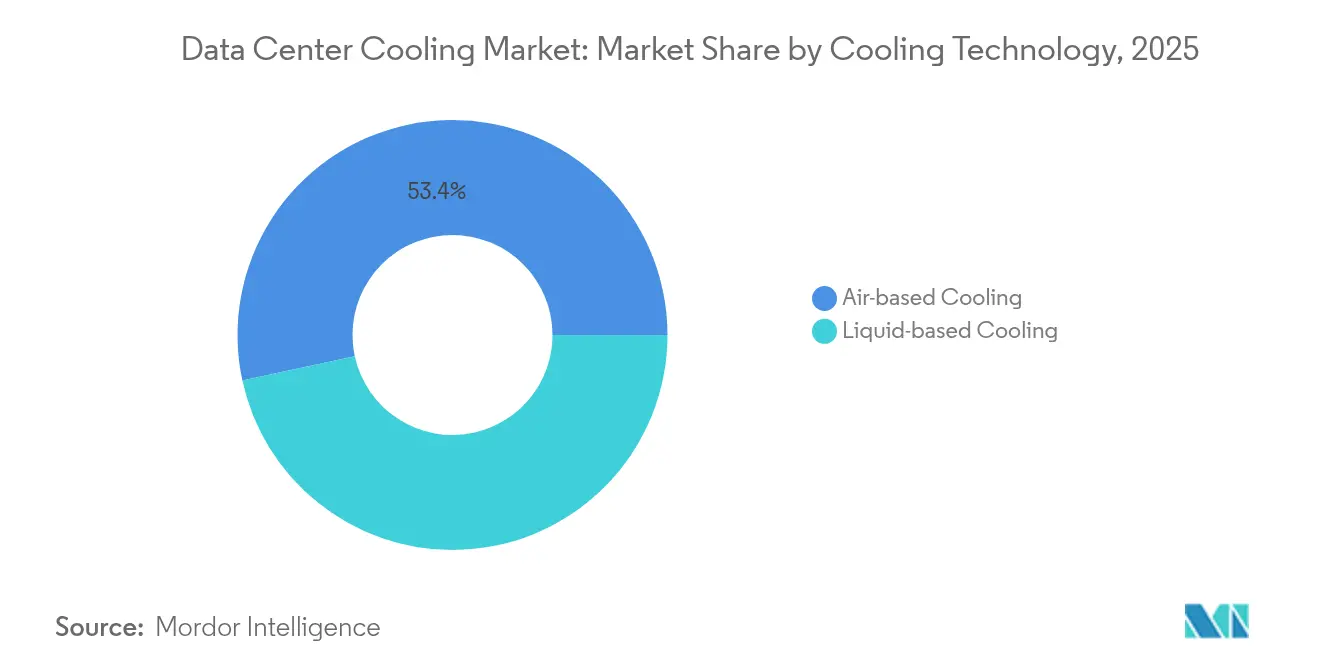
- By cooling technology, liquid-based systems held a 46.60% in data center cooling market share in 2025 and are advancing at a 19.25% CAGR through 2031.
- By cooling component, computer-room air handlers held a 30.60% in data center cooling market share in 2025 and chillers and heat-exchanger units are advancing at a 18.75% CAGR through 2031.
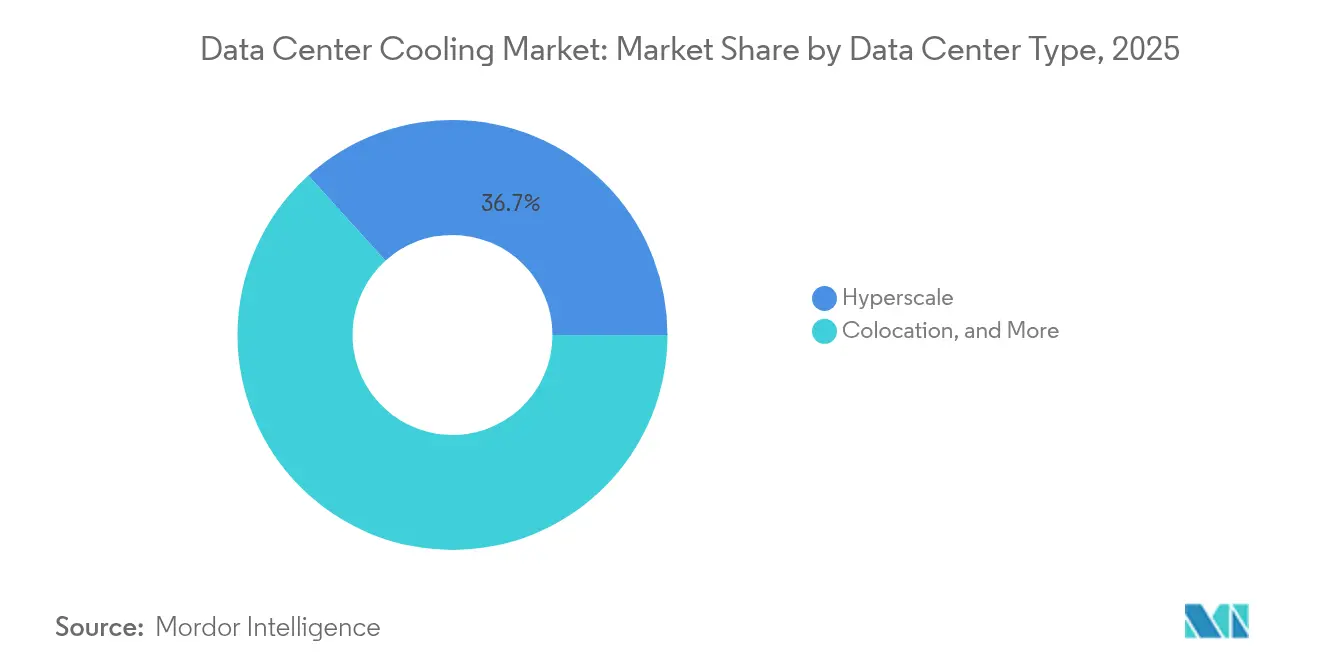
- By data center type, hyperscale facilities retained 36.70% market share in 2025, while enterprise data centers are projected to grow at a 19.50% CAGR through 2031.
- By end-user industry, IT and telecommunications accounted for 29.10% of the market in 2025, while healthcare applications are projected to grow at an 18.50% CAGR through 2031.
- By geography, North America commanded 75.56% revenue share in 2025, while Asia-Pacific is projected to be the fastest-growing region, expanding at a 20.00% CAGR through 2031.
Note: Market size and forecast figures in this report are generated using Mordor Intelligence’s proprietary estimation framework, updated with the latest available data and insights as of 2026.
600+
data center reports by Mordor Intelligence
covering construction, AI facilities, power and more - global, regional or country-level, right down to individual data center components
Market Trends and Insights
Drivers Impact Analysis of Data Center Cooling Market*
| Driver | (~) % Impact on CAGR Forecast | Geographic Relevance | Impact Timeline |
|---|---|---|---|
| AI and HPC workload heat-density surge | +4.20% | North America, China | Short term (≤ 2 years) |
| Hyperscale footprint expansion in secondary metros | +3.10% | North America, Asia-Pacific | Medium term (2-4 years) |
| Mandatory PUE / GHG disclosure regulations | +2.80% | Europe, North America | Medium term (2-4 years) |
| Global heat-wave frequency raising cooling demand | +1.90% | Middle East, Southern US | Long term (≥ 4 years) |
| Monetization of waste heat via district-energy loops | +1.50% | Nordics, Western Europe | Long term (≥ 4 years) |
| Tax-incentivized edge build-outs in rural grids | +1.60% | Rural US, Emerging Asia-Pacific | Medium term (2-4 years) |
| Source: Mordor Intelligence | |||
AI and HPC workload heat-density surge
GPU-dense servers now dissipate beyond 200 kW per rack, dwarfing legacy 10 kW envelopes and rendering conventional CRAC units ineffective. Direct-to-chip cold plates and full-immersion baths have therefore moved from pilots to production floors, particularly inside Meta and Microsoft AI clusters. Chipmakers embed liquid interface channels in next-generation packages, eroding the barrier between compute silicon and facility infrastructure [1]. Regulatory bodies simultaneously push PUE below 1.3, creating a dual-pressure environment that favors liquid technologies.
Hyperscale footprint expansion in secondary metros
Operators chase lower land costs and cleaner power in Phoenix, Columbus and Osaka, but those locations often lack mature utility infrastructure. As a result, projects specify modular chillers and rear-door heat exchangers that shorten commissioning cycles and tolerate wide ambient swings. Secondary-city climates also grant more free-air hours, lowering lifecycle cost metrics that drive board-level cap-ex approvals.
Mandatory PUE / GHG disclosure regulations
The EU Energy Efficiency Directive compels sites above 500 kW IT load to file annual PUE and waste-heat statements. California’s Title 24 and Singapore’s Green Mark echo that direction. Operators unable to show continuous efficiency improvement risk higher carbon fees or moratoriums on expansion, steering procurement toward chillers charged with R-454B refrigerant and software that tunes fan speeds in real time [2].
Global heat-wave frequency raising cooling demand
2025 set temperature records in London and Phoenix, shrinking free-cooling windows and stressing mechanical equipment. ASHRAE responded by widening the recommended server inlet band to 27 °C, yet operators still added DX coils and adiabatic coolers for resilience. Middle-Eastern sites increasingly deploy two-stage evaporative condensers that cap compressor runtime during 50 °C afternoons.
Restraints Impact Analysis of Data Center Cooling Market*
| Restraint | (~) % Impact on CAGR Forecast | Geographic Relevance | Impact Timeline |
|---|---|---|---|
| Cap-ex premium of advanced liquid technologies | -2.40% | Global | Short term (≤ 2 years) |
| Retrofit complexity in legacy white-spaces | -1.80% | North America, Europe | Medium term (2-4 years) |
| Limited supply of low-GWP refrigerants | -1.20% | Developed markets | Medium term (2-4 years) |
| Warranty risk from non-standard immersion fluids | -0.90% | Hyperscale early adopters | Short term (≤ 2 years) |
| Source: Mordor Intelligence | |||
Cap-ex premium of advanced liquid technologies
Immersion tanks cost 60% more than traditional hot-aisle containment, and specialized dielectric fluids range USD 5-7 per liter, challenging ROI in sites below 2 MW. Nevertheless, energy savings of 30-40% compress payback to under three years in high-electricity-tariff regions.
Retrofit complexity in legacy white-spaces
Raised-floor layouts and undersized busways hinder liquid pipe routing, often driving upgrade budgets to 70% of greenfield spending. Many colos therefore choose to mothball 2010-era halls rather than undertake disruptive retrofits[3].
*Our forecasts treat driver/restraint impacts as directional, not additive. The impact forecasts reflect baseline growth, mix effects, and variable interactions.
Data Center Cooling Market Segment Analysis
By Cooling Technology:
Liquid systems broaden adoption scopeThe data center cooling market size for liquid methods reached USD 5.90 billion in 2026 and is projected to exceed USD 15.33 billion by 2031, growing at a 19.25% CAGR. Direct-to-chip pipelines dominate new AI racks, while dual-phase immersion tubs claim niche workloads, such as crypto-hashing clusters. Air-based chillers and CRAC arrays remain common in enterprise environments where rack densities remain below 15 kW, yet their share declines annually as regulations tighten PUE targets. Vendors counter with hybrid coolers marrying glycol loops and adiabatic pads to extend free-cooling seasons.
Rear-door heat exchangers bridge the gap for operators unwilling to re-rack entire halls; a single exchanger lifts rack capacity from 12 kW to 30 kW without floor welding. Meanwhile, patents on microconvective cold plates promise 350 W/cm² heat flux removal, foreshadowing liquid’s march into mainstream x86 servers. Edge enclosures import factory-sealed coolant modules to reduce on-site labor, aligning with unmanned-operation mandates.

By Cooling Component:
Integrated platforms eclipse stand-alone hardwareComputer-room air handlers still account for 30.60% of spend, but their 3.75% CAGR lags the overall data center cooling market. Conversely, chillers and heat-exchanger units will log 18.75% CAGR as liquid adoption expands pipework demand. Pumps, valves and redundancy manifolds form a USD 1.95 billion submarket in 2026, benefitting from direct-to-chip loop proliferation. AI-driven supervisory software posts the fastest growth, trimming fan RPM and compressor staging to save 15-25% energy at Google and Alibaba campuses. Integrated suites that blend hardware, telemetry and machine-learning controls command premium pricing yet deliver quantifiable OPEX reduction, convincing CFOs faster than standalone consoles.
By Data Center Type:
Edge surges, hyperscale sustains volumeHyperscale facilities represented USD 4.52 billion of the data center cooling market in 2026, buoyed by capital-intensive AI farms. However, the 19.50% CAGR for enterprise surpasses all other cohorts. Moreover, telecom carriers deploy 20-50 kW prefabricated pods near 5G towers, with sealed liquid loops ensuring 10-year service intervals. Colocation providers monetize high-density suites through surcharge models, collecting 20-30% premiums per liquid-ready rack. Enterprises confronting AI upgrades weigh retrofit cost against colocation leases, tilting demand toward third-party high-density halls.
By End-user Industry:
Healthcare accelerates digital diagnosticsIT and telecom subtended USD 3.54 billion cooling outlay in 2026, maintaining leadership yet pacing at a steady 12.60% CAGR. Healthcare posted only USD 0.93 billion but set a blistering 18.50% CAGR as imaging archives and AI diagnostics double compute intensity. BFSI institutions invest in redundant chillers to satisfy uptime mandates; American Family Insurance cut power spend by 50% after adopting cold-aisle containment. Retail, media and public-sector workloads expand edge deployments to enhance customer latency and sovereign data controls, collectively elevating distributed cooling demand.
Geography Analysis
North America Data Center Cooling Market
North America recorded USD 9.35 billion of data center cooling market size in 2026, driven by hyperscale campuses in Phoenix, Atlanta and Columbus that favor liquid chillers able to exploit reclaimed wastewater for condenser loops. Extended summer heat waves shorten free-air windows, prompting operators to add adiabatic trim coolers for resilience.
APAC Data Center Cooling Market
Asia-Pacific contributed USD 1.73 billion in 2026 but will surpass USD 4.64 billion by 2031 on an 17.85% CAGR. Singapore reinstated new-build permits contingent on sub-1.3 PUE targets, steering bids toward seawater and liquid immersions. Tokyo’s densification strategy stacks multi-story halls using direct-expansion coils for each floor, while Mumbai’s coastal humidity inclines projects toward hybrid fluid coolers that mitigate water scarcity.
EMEA and LATAM Data Center Cooling Market
Europe generated USD 1.14 billion in 2026, with Nordic states extracting 250 MW of district-heating value from data center exhaust water. Frankfurt and Amsterdam now impose waste-heat-reuse quotas, nudging procurements toward high-grade water loops. Middle East and Africa adopt liquid cooling to battle 50 °C ambient peaks; Dubai’s collocated solar farm plus thermal-storage tank trims chiller electricity by 17%. Latin America saw emergent builds in Querétaro and Santiago, where cooler night air favors indirect evaporative modules that achieve 1.2 PUE despite high daytime highs.
Regulatory Landscape
Regulation is tightening around measurable energy, water, and refrigerant impacts of data center cooling, pushing operators toward auditable PUE and WUE reporting and low-GWP equipment choices. In the European Union, Directive (EU) 2023/1791 and Delegated Regulation (EU) 2024/1364 require annual reporting for data centers above 500 kW installed IT demand into a European database, including indicators such as PUE, WUE, and waste-heat reuse, which makes cooling monitoring and metering a compliance requirement rather than an efficiency add-on.
Compliance pressure is also starting to shape design decisions for new builds. EU requirements include a compliance threshold for facilities commencing operations on or after July 1, 2026, which elevates waste-heat reuse planning, often alongside frameworks such as DIN EN 50600-4-6, in addition to traditional energy targets. In the United States, activity is becoming more localized and water-focused, highlighted by Vermont H-0727 requiring closed-loop cooling (or an approved alternative) for data centers using water for cooling, while federal-level momentum is reflected in the 2026 introduction of S. 4213 proposing mandatory energy and water reporting for large sites (25 MW or more).
Value Chain Analysis
The value chain covers thermal design and engineering, component manufacturing (CRAH/CRAC, chillers, dry coolers and towers, CDUs, pumps and valves, heat exchangers, controls/software), system integration, distribution, installation and commissioning, and lifecycle services. As liquid-based systems scale, the chain is becoming more modular and multi-sourced, with facility OEMs supplying chillers and heat rejection, specialized suppliers providing CDUs and cold-plate interfaces, and integrators coordinating fluid loops, telemetry, and controls across heterogeneous equipment sets.
In 2026, upstream capacity access and component availability showed up as practical constraints, pushing large buyers toward multi-year reservations and deeper supplier collaboration. Modine disclosed a long-term agreement committing more than USD 4 billion in data center cooling purchases through 2029, including an upfront payment to secure production capacity, which signals a shift from project-by-project procurement to reserved manufacturing infrastructure. The same dynamic is reflected in sourcing diversification, with Reuters reporting in March 2026 that Google held procurement talks with Chinese suppliers including Envicool amid tight supply conditions, while equipment makers expanded capability via partnerships and acquisitions, including Daikin Holdings Singapore signing an April 2026 MOU with Delta Electronics on next-generation CDU solutions for ASEAN-Oceania deployments.
Competitive Landscape
Strategic realignments in 2024-2025 reshaped vendor rosters. Johnson Controls offloaded its residential HVAC arm to Bosch for USD 8.1 billion, freeing cash to scale YORK® YVAM centrifugal chillers that cut energy 40% using R-454B refrigerant. Schneider Electric’s Motivair buyout expanded immersion capabilities, while Vertiv absorbed BiXin Energy to bolster modular chiller design for Asian clients.
Challenger firms such as LiquidStack deliver two-phase immersion tanks certified for 100 kW racks, capturing edge pilots with 20-30% bandwidth in ruggedized enclosures. Asetek and JetCool advance cold-plate IP, prompting OEM collaborations with Dell and Lenovo. Patent volume around microfluidic die channels surged 38% YoY, led by IBM and Microsoft filings.
Pricing competition intensifies in commoditized CRAH ranges, but premium differentiation persists in software-defined cooling suites that unify telemetry, AI optimization and carbon reporting dashboards. Customers now award multi-year master service agreements to vendors demonstrating verifiable Scope-1 and Scope-2 emissions cuts.
Data Center Cooling Industry Leaders
-
Stulz GmbH
-
Rittal GmbH & Co. KG
-
Vertiv Group Corp.
-
Alfa Laval AB
-
Johnson Controls Inc.
- *Disclaimer: Major Players sorted in no particular order
Data Center Cooling Market Companies Covered in this Report
- Vertiv
- Schneider Electric
- Stulz
- Rittal
- Johnson Controls
- Alfa Laval
- Fujitsu General
- Hitachi
- CoolIT Systems
- LiquidStack
- Asetek
- Asperitas
- Chilldyne
- Mikros Technologies
- Kaori Heat Treatment
- Lenovo
- Nortek Air Solutions
- Delta Electronics
- Munters
- Airedale (Modine)
- Black Box (Chatsworth Prod.)
- Submer
- GRC (Green Revolution Cooling)
- Coolcentric
- Starline
Market Opportunities and Future Outlook
High-density AI builds are turning cooling into a front-end architectural decision, which creates room for suppliers able to deliver integrated, liquid-ready stacks covering cold plates or immersion interfaces, CDUs, controls, and heat rejection. Standardization activity is also reducing integration friction, with the Open Compute Project releasing its Modular Technology Cooling System (TCS) Rev. 1 in 2025, a common design reference that supports repeatable deployment across multi-site programs and helps align vendor offerings around interoperable liquid cooling subsystems.
Water constraints and disclosure rules are additionally supporting demand for closed-loop, non-evaporative designs and waste-heat utilization, particularly where permitting and community acceptance depend on WUE and reuse. In July 2026, multiple large campus announcements cited closed-loop or direct liquid cooling, including Crusoe and Lancium’s 1.0 GW AI data center campus in Childress, Texas (closed-loop, non-evaporative liquid cooling) and QTS plans for 11 data centers on a 1 GW Lancium campus in Hall County, Texas (closed-loop cooling to reduce water usage). In Europe, Pure Data Centres Group announced the 550 MW SJK01 AI campus in Seinajoki, Finland using Direct Liquid Cooling modules, reinforcing the opportunity for vendors that can package liquid cooling with metering, controls, and heat-rejection options aligned to local energy and water constraints.
Recent Industry Developments in Data Center Cooling Market
- July 2026: Vertiv opened a new manufacturing facility in Johor, Malaysia to support growing demand tied to AI and digital infrastructure. The added regional capacity improves lead-time and localization options for heat rejection and related thermal infrastructure in Asia-Pacific, where high-density builds increasingly specify liquid-assisted architectures.
- August 2025: Bosch finalized the USD 8.1 billion takeover of Johnson Controls' light-commercial HVAC unit. The portfolio reshuffle increased competitive intensity in cooling equipment supply and created additional strategic focus among vendors on data center-specific chiller and controls offerings.
- September 2024: Schneider Electric completed its acquisition of Motivair, adding immersion and liquid-cooling capabilities oriented to GPU clusters. The deal accelerated consolidation around liquid engineering know-how and broadened integrated thermal portfolios offered to hyperscale and colocation operators.
Data Center Cooling Market Report Scope and Research Methodology
Market Definition and Coverage
This market covers cooling equipment and cooling-support components used to remove heat from data centers so IT loads can run within safe temperature and humidity ranges, across new builds as well as retrofit upgrades.
Scope exclusions: We exclude onsite power generation, electrical switchgear, and general building HVAC that is not dedicated to the data hall cooling loop.
Segments Covered in This Report
- By Cooling Technology
- Air-based Cooling
- Chiller and Economizer
- CRAH (Computer-Room Air Handler)
- Cooling Tower (Direct, Indirect, Two-Stage)
- Other Air-based Cooling Technologies
- Liquid-based Cooling
- Immersion Cooling
- Direct-to-Chip Cooling
- Rear-Door Heat Exchanger
- Air-based Cooling
- By Cooling Component
- Computer-Room Air Handlers (CRAH/CRAC)
- Chillers and Heat-Exchanger Units
- Cooling Towers and Dry Coolers
- Pumps and Valves
- Control and Monitoring Software
- By Data Center Type
- Hyperscale (Owned and Leased)
- Enterprise (On-Premise)
- Colocation
- By End-user Industry
- IT and Telecom
- Retail and Consumer Goods
- Healthcare
- Media and Entertainment
- Federal and Institutional Agencies
- Other End users
- By Geography
- North America
- United States
- Canada
- Mexico
- South America
- Brazil
- Argentina
- Chile
- Rest of South America
- Europe
- Germany
- United Kingdom
- France
- Rest of Europe
- Asia-Pacific
- China
- India
- Japan
- Rest of Asia-Pacific
- Middle East and Africa
- Middle East
- Africa
- North America
Data Sources, Market Sizing, and Validation
Desk Research
Desk work was used to map the demand pool and to make sure our assumptions match what is visible in public data. We typically start with data center build and operating signals, then connect them to cooling needs using engineering and procurement benchmarks.
For this market, we referenced public sources such as energy and efficiency standards from agencies like the US Department of Energy, environmental rules and refrigerant transition updates from the US EPA, and international guidance from bodies like the International Energy Agency. We also used data center infrastructure and efficiency publications from organizations such as ASHRAE, plus trade and customs statistics where cooling equipment imports and exports help explain regional supply patterns. In addition, we reviewed company filings, investor presentations, association websites, and reputed press to track product launches and pricing direction, and we selectively used paid subscriptions for company financials and intelligence, news and financials, patent databases, and shipment-level trade records. These sources are illustrative only, and many other references were used for cross-checking, clarification, and validation.
Primary Interviews and Surveys
Primary work focused on validating how cooling spend is actually decided and purchased across hyperscale, colocation, and enterprise sites, and what shifts are happening as rack densities rise. We spoke with cooling equipment suppliers, system integrators, contractors, and data center operators so that desk assumptions on capacity additions, technology mix, and typical price points could be adjusted using real buying behavior. Coverage was kept global, with extra checks in high-build markets and in regions where regulatory changes and power constraints are shaping cooling choices.
Distribution of primary research fieldwork respondents
| Company type | Respondent position | Region |
|---|---|---|
| Top tier: 25% | CXOs: 13% | APAC: 48% |
| Mid tier: 59% | Functional/Unit leaders: 31% | EMEA: 30% |
| Smaller Players: 16% | Managers: 56% | Americas: 22% |
Market-Sizing & Forecasting
The main model is built using a top-down logic where data center capacity additions by region are reconstructed and then translated into cooling demand using typical cooling-to-IT load relationships and build-out patterns. Once the demand pool is set, we apply technology mix splits (air-based versus liquid-based) and component-level spend patterns to arrive at the market value.
To keep totals realistic, results are then checked with selective bottom-up approximations, such as sampling a set of cooling system quotations to estimate average selling prices, then multiplying by plausible shipment volumes for key equipment families. Where data is thin, gaps are handled by using conservative ranges from interviews, then narrowing them using nearby country infrastructure activity and import signals.
Key inputs used in the model include new data center floor space and MW additions, average rack density direction, share of retrofits versus greenfield builds, energy-efficiency targets (PUE expectations), and the adoption rate of liquid cooling in high-density environments. For forecasting, we used scenario analysis supported by multivariate relationships, where capacity build plans, power availability constraints, and cooling mix shifts were stress-tested under faster or slower load growth that tracks high-density deployments.
Data Validation & Update Cycle
Outputs are validated through multiple checks so the value path stays consistent with real-world signals. We compare implied cooling spend per MW against known project benchmarks, review regional splits against build-out news flow, and recheck any abrupt jumps that do not align with capacity additions or mix changes.
Before sign-off, the model goes through analyst review steps, and outliers trigger a return to the source notes and, where needed, re-contact with respondents to confirm whether pricing, lead times, or technology adoption has shifted. Reports are refreshed annually, and interim updates are done when major policy, pricing, or supply changes materially alter cooling system choices. Right before delivery, a final pass is completed so clients receive the most up-to-date market view.
Mordor Intelligence's Global Data Center Cooling Market Market Size Measured Against Other Published Estimates
Published market sizes for data center cooling often vary, even when the topic looks identical at first glance. Differences usually come from what is counted as cooling, which years are used for currency conversion, and whether pricing is treated as a stable average or allowed to move with mix changes.
A big gap driver here is how studies treat liquid cooling and retrofit spending, since some estimates bundle adjacent facility HVAC or broader thermal management spend beyond the data hall. Another common cause is refresh timing, because ASPs for chillers, CRAH units, and liquid loops can swing with refrigerant transitions, supply tightness, and higher-density designs, and those swings change the current-year snapshot that buyers see. When currency timing and regional price normalization are updated close to publication, the 2026 total used here stays tied to current procurement ranges and cross-checks, which is a refresh-led choice applied by Mordor Intelligence.
Benchmark comparison
| Source | Market Size | Gaps in Research Methodology |
|---|---|---|
| Mordor Intelligence | USD 12.41 B (2026) | |
| Global Consultancy A | USD 31.40 B (2026) | This estimate appears to use a broader spend boundary, which can pull in wider facility cooling and related infrastructure, and it also assumes a faster ASP expansion that lifts the 2026 value even with similar capacity growth. |
| Industry Publisher B | USD 21.00 B (2026) | The scope likely includes a wider set of cooling services and aftermarket revenue, and the currency conversion and regional price normalization may be based on earlier-year averages, which can shift the 2026 number upward. |
Across the three figures, the spread is mainly explained by boundary choices and by how pricing is refreshed and converted across regions. By keeping assumptions tied to observable capacity additions, practical technology mix splits, and repeatable price checks, the approach gives clients a number they can trace back to clear inputs and update over time.
Key Questions Answered in the Report
What is the forecasted value of the data center cooling market in 2031?
The data center cooling market size is projected to reach USD 28.54 billion by 2031.
Which cooling technology will grow the fastest through 2031?
Liquid-based systems, encompassing direct-to-chip and immersion methods, are forecast at a 19.25% CAGR.
How are regulations influencing cooling technology choices?
Mandatory PUE and refrigerant phase-down rules favor energy-efficient liquid chillers charged with low-GWP blends, accelerating their adoption.
Which region is expanding fastest in data center cooling spend?
Asia-Pacific leads with an 20.00% CAGR, propelled by dense urban builds in Singapore, Tokyo and Mumbai that demand high-performance thermal designs.
What payback period can operators expect when shifting from air to liquid cooling?
In regions with high electricity tariffs, liquid solutions can recoup their higher cap-ex within three to five years via 30-40% energy savings.
More reports on data centers
- Data Center Construction Market Construction across the global market, covering tier, facility size and facility type.
- Artificial Intelligence (AI) Data Center Market AI facilities across the global market, covering facility type, component and tier.
- Data Center Power Market Power systems worldwide, split by component, tier and facility size.
- North America Data Center Power Market North America power systems, split by type, facility type and end-user industry.
- Data Center Immersion Cooling Market Global immersion cooling demand, split by type, cooling fluid and application.
- Asia-Pacific Data Center Power Market Asia-Pacific power systems, split by component, facility type and facility size.