Market Overview
| Study Period | 2020 - 2031 |
|---|---|
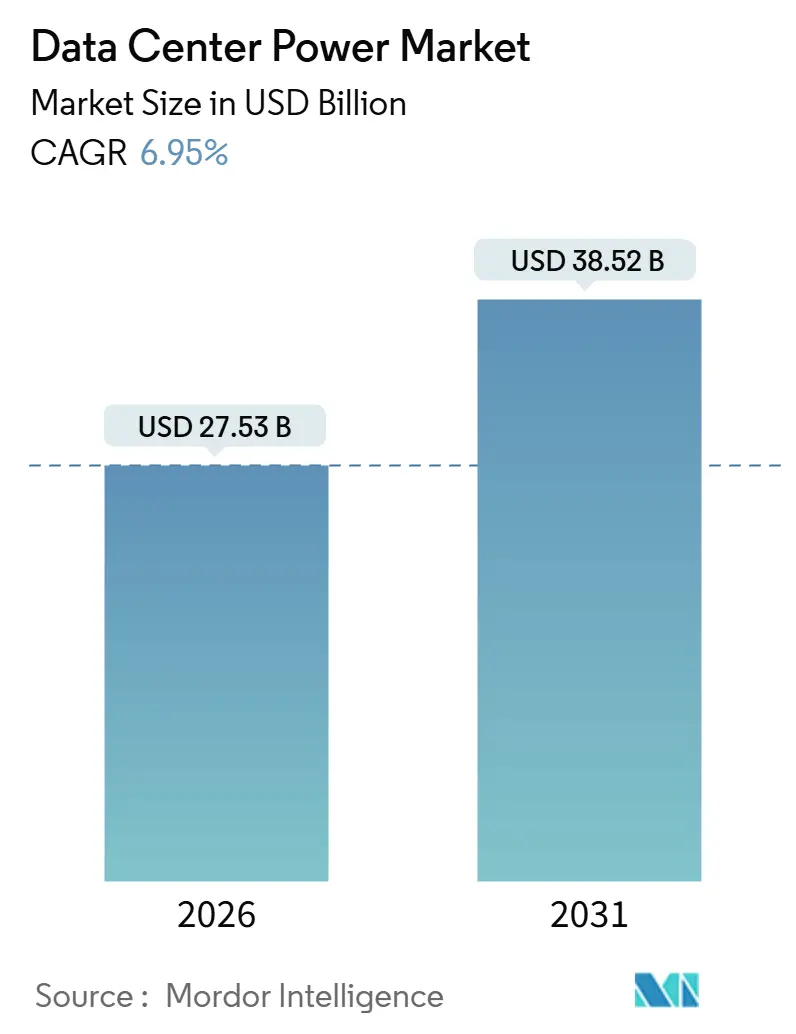
| Market Size (2026) | USD 27.53 Billion |
| Market Size (2031) | USD 38.52 Billion |
| Growth Rate (2026 - 2031) | 6.95% CAGR |
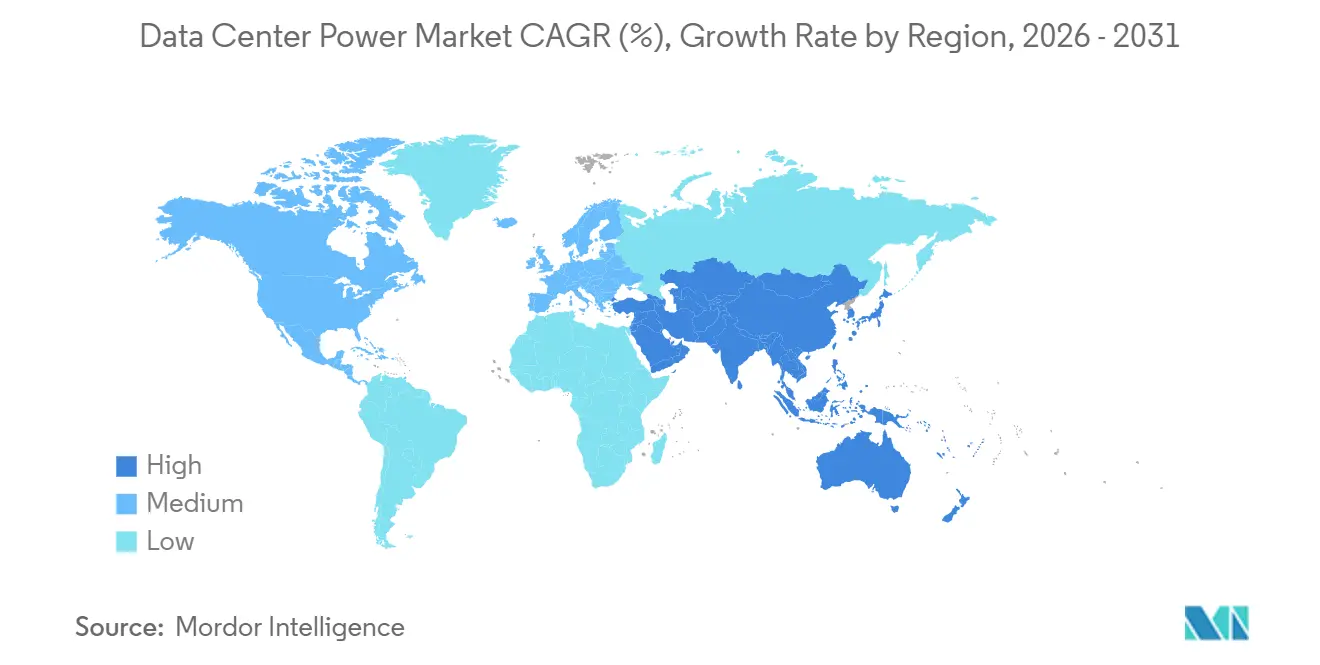
| Fastest Growing Market | Asia Pacific |
| Largest Market | Europe |
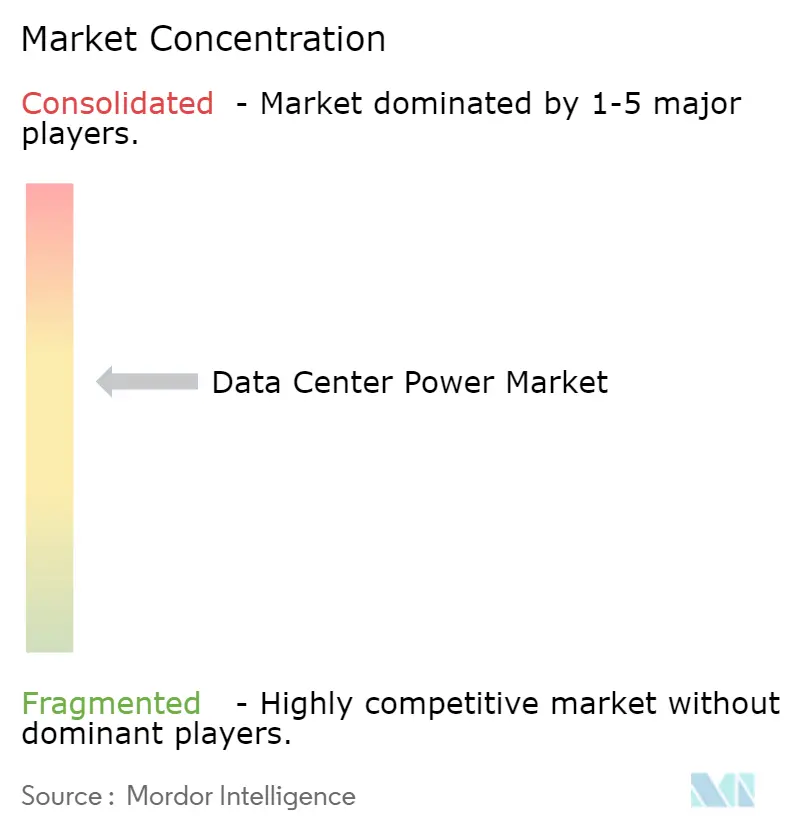
| Market Concentration | Medium |
Major Players *Disclaimer: Major Players sorted in no particular order Image © Mordor Intelligence. Reuse requires attribution under CC BY 4.0. | |
Data Center Power Market Analysis by Mordor Intelligence
The data center power market size reached USD 27.53 billion in 2026 and is forecast to advance to USD 38.52 billion by 2031, reflecting a 6.95% CAGR over the period. Escalating AI workloads, hyperscale campus builds that exceed 100 megawatts, and stricter uptime rules are widening demand for modular uninterruptible-power supplies, solid-state switchgear, and grid-interactive battery storage. Operators are repurposing retired coal-plant sites to gain multi-gigawatt grid connections, while colocation providers retrofit legacy halls with lithium-ion battery arrays to sustain Tier 3 and Tier 4 availability. Policy pressure for lower carbon intensity is driving on-site solar, hydrogen generators, and microgrid controllers, and it is also compressing the timetable for improvements in power-usage effectiveness. Competitive rivalry is intensifying as traditional electrical vendors embed AI analytics in UPS lines and as battery specialists introduce software-defined power-management platforms.
Key Report Takeaways
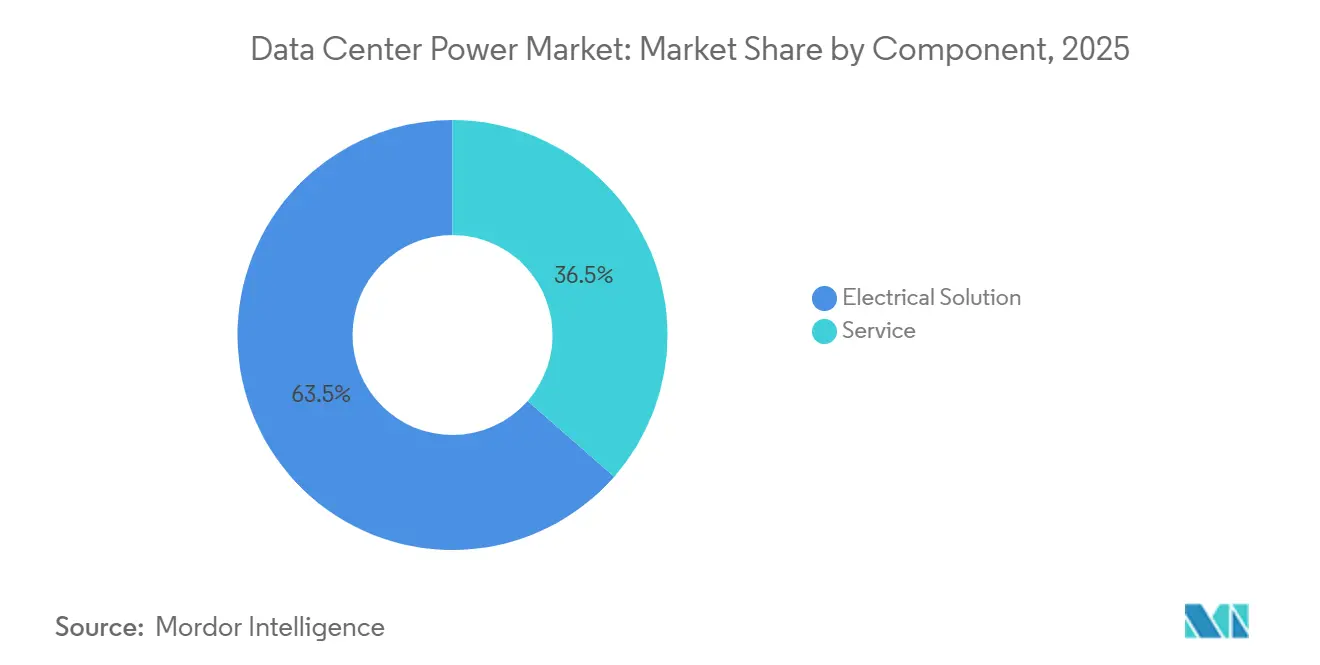
- By component, electrical solutions led with 63.54% of 2025 revenue, while services are growing at a 7.43% CAGR through 2031.
- By tier classification, Tier 3 facilities held 64.42% of the data center power market share in 2025; Tier 4 builds are projected to accelerate at a 7.65% CAGR to 2031.
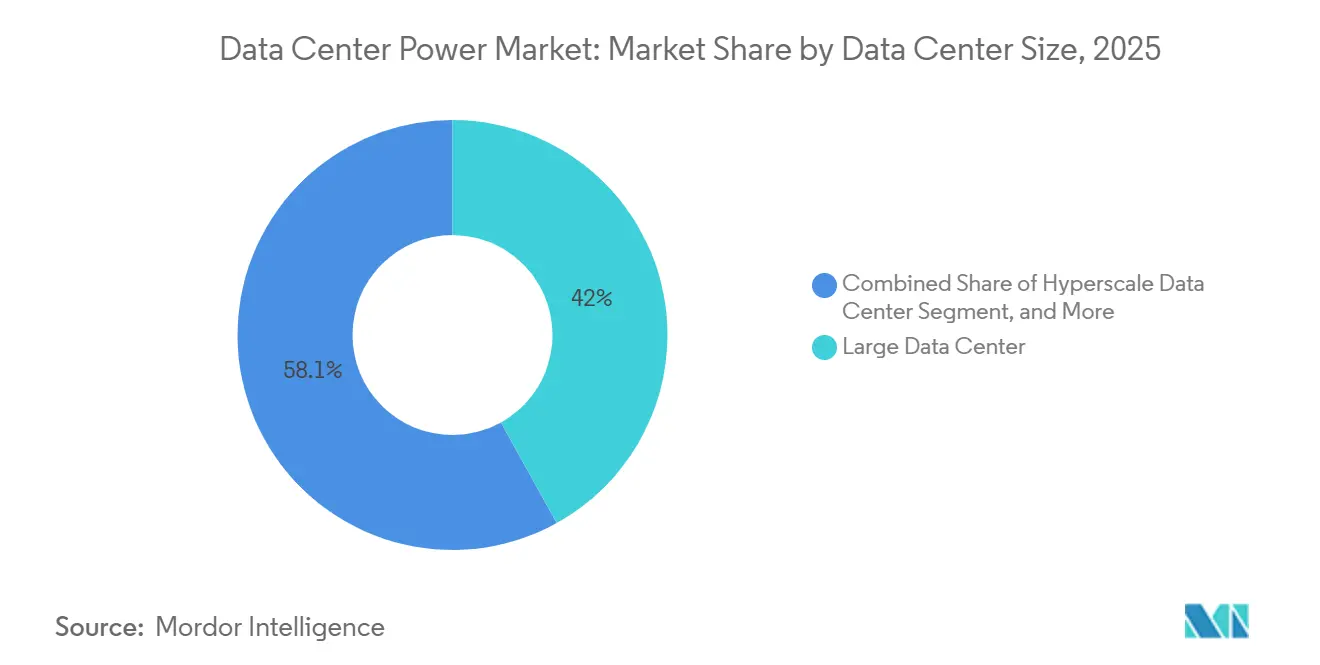
- By data-center size, large facilities captured 41.95% of the data center power market size in 2025, whereas hyperscale campuses are expanding at a 7.87% CAGR between 2026-2031.
- By data-center type, colocation sites accounted for 43.77% of 2025 revenue, and hyperscaler-owned facilities are set to grow at a 7.78% CAGR to 2031.
- By geography, Europe commanded 38.54% of global revenue in 2025; Asia-Pacific is the fastest region, with a 7.91% CAGR expected through 2031.
Note: Market size and forecast figures in this report are generated using Mordor Intelligence’s proprietary estimation framework, updated with the latest available data and insights as of January 2026.
Global Data Center Power Market Trends and Insights
Drivers Impact Analysis*
| Driver | (~) % Impact on CAGR Forecast | Geographic Relevance | Impact Timeline |
|---|---|---|---|
| Hyperscale and Cloud-Computing Expansion | +1.8% | Global, with concentration in North America, Europe, and Asia-Pacific | Medium term (2-4 years) |
| AI-Driven High-Density Workloads | +2.1% | Global, led by United States, China, and European Union | Short term (≤ 2 years) |
| Stricter Uptime and Redundancy Standards | +1.3% | Global, particularly financial hubs in North America, Europe, and Asia-Pacific | Long term (≥ 4 years) |
| Sustainability and Energy-Efficiency Mandates | +1.0% | Europe, North America, and select Asia-Pacific markets (Japan, South Korea) | Medium term (2-4 years) |
| Grid-Interactive Revenue Streams (Behind-the-Meter) | +0.5% | North America, Europe, and Australia | Long term (≥ 4 years) |
| Coal-Plant Site Repurposing for Campuses | +0.4% | United States, Germany, and Australia | Medium term (2-4 years) |
| Source: Mordor Intelligence | |||


Hyperscale and Cloud-Computing Expansion
Campus projects now exceed 100 megawatts of IT load, and each site requires dedicated 230-kilovolt substations plus N+1 generator farms. Microsoft commissioned 15 gigawatts of capacity in 2025, standardizing on modular switchgear that can be added without interrupting live racks.[1]Microsoft Corp., “Annual Report 2025,” microsoft.com Amazon Web Services piloted liquid-cooled cabinets that draw 200 kilowatts, doubling rack density while shrinking floor plate.[2]Amazon Web Services, “re:Invent 2025 Session Archive,” reInvent.awsevents.com Google adopted 480-volt direct-current distribution for AI clusters, cutting AC-DC losses by 8%. These designs accelerate demand for busway, high-capacity PDUs, and solid-state breakers that tolerate continuous currents above 1,000 amperes.
AI-Driven High-Density Workloads
Generative AI training pushes GPU clusters to 40-50 megawatts per hall, a tenfold rise over virtualized enterprise workloads. Operators are abandoning raised-floor layouts in favor of overhead busways and in-row cooling placed within three meters of heat sources. Vertiv’s Liebert EXL S1 UPS line, rated at 1.5 megawatts per module, saw 140% order growth in 2025 as hyperscalers retrofit existing halls. Lithium-ion cabinets now occupy one-third the footprint of valve-regulated lead-acid strings yet provide 15-minute ride-through at full load. Schneider Electric’s Galaxy VXL integrates a three-megawatt-hour battery and delivers 97.5% efficiency, lowering thermal load by 30 kilowatts per megawatt protected.
Stricter Uptime and Redundancy Standards
Tier 4 certification requires 2N+1 electrical redundancy with duplicate feeds, generator sets, and UPS strings. The share of new builds specifying Tier 4 climbed to 22% in 2025, up from 14% in 2023. Eaton launched the Power Xpert 9395 UPS, whose static bypass withstands 300% overload for 10 seconds, ensuring fault-tolerant transfers. ABB’s Ability EDCS software schedules preventive maintenance on breakers and transformers, reducing unscheduled outages by 60%. Financial-services and healthcare tenants justify the cost premium by avoiding regulatory penalties linked to downtime.
Sustainability and Energy-Efficiency Mandates
The European Union’s 2024 directive compels facilities above 500 kilowatts to reach power-usage effectiveness below 1.3 by 2027 and to draw 75% renewable electricity by 2030.[3]European Commission, “Directive 2024/1791,” eur-lex.europa.eu Operators respond with on-site solar, four-hour battery systems, and hydrogen generators that displace diesel runtime. California’s South Coast Air Quality rule limits diesel gensets to 100 hours yearly, catalyzing natural-gas and hydrogen options. Cummins’ HyPM HD200 module delivers 200 kilowatts of continuous zero-emission power and is under pilot at Microsoft and Google campuses. Facilities meeting renewable benchmarks gain lower grid tariffs and enhanced access to green-bond financing.
Restraint Impact Analysis*
| Restraint | (~) % Impact on CAGR Forecast | Geographic Relevance | Impact Timeline |
|---|---|---|---|
| High CAPEX of Electrical Infrastructure | -1.2% | Global, particularly acute in emerging markets in Asia-Pacific and Middle East | Short term (≤ 2 years) |
| Carbon-Intensity Regulations and Reporting | -0.6% | Europe, North America, and select Asia-Pacific markets | Medium term (2-4 years) |
| Transformer and Switchgear Supply Bottlenecks | -1.0% | Global, with severe constraints in North America and Europe | Short term (≤ 2 years) |
| Local Opposition to Sub-Station Expansion | -0.4% | Urban corridors in North America, Europe, and Asia-Pacific | Long term (≥ 4 years) |
| Source: Mordor Intelligence | |||
High CAPEX of Electrical Infrastructure
A 10-megawatt Tier 3 facility needs USD 15-20 million in electrical gear, and hyperscale sites above 100 megawatts can exceed USD 200 million, including substations and gas-insulated switchgear. Access to finance remains limited in emerging economies, and new utility feeders can take 18-24 months to approve, adding holding costs. Vertiv’s modular Smart Cabinet trims installation labor by 40% and accelerates revenue by eight weeks, yet the upfront outlay still deters mid-tier firms. Capital pressure is prompting growth of service-as-a-subscription models where vendors own switchgear and charge monthly fees, but adoption is still nascent.
Transformer and Switchgear Supply Bottlenecks
Lead times for medium-voltage transformers rose to 18 months in 2025, double the 2023 figure, as demand for electrical steel and copper outstripped mill capacity. ABB’s North American backlog hit 24 months, forcing hyperscalers to pre-order equipment two years ahead of site acquisition. Eaton’s vacuum breaker deliveries stretched to 14 months due to semiconductor shortages. Operators mitigate by specifying factory-built switchgear modules that cut on-site commissioning from 12 weeks to four weeks. Persistent bottlenecks motivate secondary-market sourcing, yet this approach introduces warranty risks and complicates Tier certification.
*Our forecasts treat driver/restraint impacts as directional, not additive. The impact forecasts reflect baseline growth, mix effects, and variable interactions.
Segment Analysis
By Component: Services Gain as Complexity Rises
Services captured a rising slice of the data center power market size as operators outsourced integration of hybrid diesel-gas-hydrogen fleets and predictive maintenance contracts. Electrical solutions still held 63.54% of 2025 revenue, led by lithium-ion UPS systems, solid-state breakers, and rack-level PDUs. Service revenue is advancing at a 7.43% CAGR as suppliers bundle installation, firmware, and remote monitoring. Schneider Electric disclosed that 38% of data-center turnover in 2025 stemmed from multi-year service agreements, reflecting a shift toward outcome-based procurement.
UPS lines now scale in 500-kilowatt blocks positioned near the IT load, while natural-gas and hydrogen generators address urban emission limits. Switchgear adopts solid-state silicon carbide devices that cut panel depth by 40% and isolate faults in under two milliseconds. Energy-storage racks transition from standby roles to grid-support assets that earn USD 50,000-100,000 per megawatt-hour annually in organized markets. Field complexity strengthens the services value proposition, particularly in markets that lack skilled labor and enforce strict uptime clauses.

By Tier Type: Tier 4 Builds Accelerate Despite Cost Premium
Tier 3 installations represented 64.42% of 2025 deployments, anchoring the data center power market share due to their balance of 99.982% availability and moderate capital intensity. Tier 4 sites, though costlier by 25-30%, are expanding at a 7.65% CAGR as regulated industries demand fault tolerance. Insurance premiums on Tier 3 halls can run 40% higher, and a single outage may exceed the saved capital, making Tier 4 certification compelling for mission-critical workloads.
Suppliers respond with modular architectures that allow stepwise migration. Eaton’s Power Xpert 9395P lets operators parallel an additional UPS string without displacing existing gear. ISO/IEC 22237 and ANSI/TIA-942 standards now appear in public procurement clauses, effectively mandating Tier 4 for government workloads. Rising AI density further drives Tier 4 adoption, because any unexpected shutdown of GPU clusters triggers prolonged retraining cycles.
By Data Center Size: Hyperscale Campuses Drive Density Innovation
Large facilities between 10-50 megawatts held 41.95% of the data center power market in 2025, supported by enterprises that favor phased expansion. Hyperscale sites above 50 megawatts are posting a 7.87% CAGR through 2031, reflecting cloud providers’ need for centralized AI training. Amazon maintains 180-megawatt campuses in Northern Virginia that house over 100,000 servers.
Electrical designs pioneered in hyperscale halls influence smaller segments. Google’s 480-volt DC backbone, first rolled out in eight mega-campuses, now appears in modular 5-megawatt blocks shipped to edge locations. Vertiv’s SmartMod containers, packing two megawatts of UPS and distribution gear into a 40-foot module, shrink commissioning from 16 weeks to six weeks. Small and medium sites benefit from these innovations yet remain constrained by utility interconnect delays, especially in dense metros where transformer slots are scarce.

By Data Center Type: Hyperscalers Pursue Vertical Integration
Colocation centers maintained 43.77% of 2025 revenue, appealing to enterprises that prefer capital-light strategies. Hyperscaler-owned facilities, however, are growing at a 7.78% CAGR as Amazon, Microsoft, Google, and Alibaba seek full control over power-usage effectiveness and renewable sourcing. Colocation operators differentiate on flexible lease terms, offering customers the option to scale from 100 kilowatts to five megawatts without long commitments.
Hyperscalers deploy on-site substations, negotiate utility tariffs directly, and integrate battery storage for frequency regulation, creating a distinct supply chain and design playbook. Enterprise data centers adopt hybrid approaches, placing non-critical loads in colocation rooms while keeping regulated datasets on-premises. Cisco’s Nexus 9000 switches deliver port-level power monitoring, enabling granular chargeback and carbon accounting that align with corporate ESG goals.
Geography Analysis
Europe led with 38.54% of global data center power market revenue in 2025, driven by stringent energy-efficiency statutes and edge-node growth in Germany, the United Kingdom, and France. Frankfurt alone added 45 megawatts of colocation capacity as banks demanded low-latency links to clearing systems. Operators in London’s Docklands brought 38 megawatts online, helped by upgrades to the 132-kilovolt London Ring Main. Paris facilities adopted liquid-cooling to comply with heat-island restrictions that cap chiller output, illustrating how municipal rules shape electrical design.
Asia-Pacific is the fastest region, with a 7.91% CAGR projected through 2031. China approved 85 megawatts of new capacity in Beijing, Shanghai, and Shenzhen in 2025, conditioning permits on power-usage effectiveness below 1.25 and 50% renewable energy. India’s 2025 National Data Center Policy grants five-year tax holidays for Tier 3 sites above 20 megawatts that source indigenous UPS and switchgear. Japan added 18 megawatts and mandated seismic-rated switchgear that tolerates magnitude 7 seismic events. South Korea saw 12 megawatts of AI inference halls funded by Samsung and SK Telecom. Australia pioneered grid-interactive data centers that earn USD 80,000 per megawatt-hour in ancillary-service revenue.
North America remains the single largest country cluster, with Virginia, Texas, and California accounting for 60% of new U.S. capacity in 2025. Canada added 15 megawatts across Toronto and Montreal, leveraging cold-climate free cooling and low-cost hydropower. Mexico’s Querétaro corridor delivered eight megawatts for near-shoring manufacturers needing low-latency links to U.S. regions. The Middle East and Africa drew investment in Dubai and Riyadh where smart-city programs require Tier 3 halls. Brazil led South America with 10 megawatts in São Paulo, supported by e-commerce and fintech demand.

Competitive Landscape
The market is moderately concentrated, with vendors such as Schneider Electric, Vertiv, ABB, Eaton, and others. Schneider Electric deployed its EcoStruxure platform in 320 sites, delivering real-time energy analytics that improved power-usage effectiveness by 8%. Vertiv’s high-efficiency Liebert EXL S1 secured 22% of the hyperscale UPS segment by bundling a 15-year lithium-ion warranty that lowers total cost of ownership. ABB’s Ability EDCS generated USD 45 million in recurring software revenue and predicted breaker failures six months ahead.
Market entrants focus on battery storage, hydrogen fuel cells, and solid-state switchgear. Fluence Energy installed 1.2 gigawatt-hours of battery systems that enable data centers to offer frequency regulation services. Bloom Energy’s solid-oxide cells achieve 65% electrical efficiency, appealing to operators targeting diesel displacement. Smaller players such as Socomec and Riello UPS win 500-kilowatt to two-megawatt deals by offering 250-kilowatt incremental modules that expand without downtime.
Technology roadmaps point toward silicon-carbide circuit breakers that remove mechanical wear, AI-driven thermal controls that adjust chiller setpoints in real time, and software that arbitrages battery capacity across multiple electricity markets. Vendor differentiation now hinges on integrating these capabilities into unified platforms that lower both energy and labor costs.
Data Center Power Industry Leaders
Schneider Electric SE
Vertiv Holdings Co.
ABB Ltd
Eaton Corporation plc
Legrand SA
- *Disclaimer: Major Players sorted in no particular order

Recent Industry Developments
- January 2026: Schneider Electric committed USD 250 million to expand its Bangalore UPS plant, adding 1.5 gigawatts of annual capacity and focusing on the Galaxy VXL line.
- December 2025: Vertiv acquired Powerware Systems for USD 180 million, adding modular switchgear that shortens on-site commissioning from 12 weeks to four weeks.
- November 2025: ABB launched Ability EDCS 3.0, an analytics platform that predicts breaker and transformer failures up to six months ahead; 180 Tier 3 and Tier 4 sites adopted the software in 2025.
- October 2025: Eaton opened a USD 120 million switchgear plant in Monterrey, Mexico, capable of 2,000 medium-voltage assemblies per year and offering eight-week delivery to near-shoring operators.


Research Methodology Framework and Report Scope
Market Definitions and Key Coverage
Our study defines the data center power market as all electrical infrastructure, namely uninterruptible power supply systems, diesel and gas generators, power distribution units, switchgear, remote power panels, transfer switches, and battery or flywheel energy storage systems, deployed inside colocation, hyperscale, enterprise, edge, and modular facilities to deliver conditioned, redundant electricity up to the IT rack.
Scope exclusion: Facility shell, chillers, CRAH/CRAC cooling, and on-site renewable generation are outside this sizing.
Segmentation Overview
- By Component
- Electrical Solution
- UPS Systems
- Generators
- Diesel Generators
- Gas Generators
- Hydrogen Fuel-cell Generators
- Power Distribution Units
- Switchgear
- Transfer Switches
- Remote Power Panels
- Energy-storage Systems
- Service
- Installation and Commissioning
- Maintenance and Support
- Training and Consulting
- Electrical Solution
- By Tier Type
- Tier 1 and 2
- Tier 3
- Tier 4
- By Data Center Size
- Small Data Center
- Medium Data Center
- Large Data Center
- Hyperscale Data Center
- By Data Center Type
- Colocation Data Center
- Hyperscalers Data Center/CSPs
- Enterprise and Edge Data Center
- By Geography
- North America
- United States
- Canada
- Mexico
- South America
- Brazil
- Argentina
- Rest of South America
- Europe
- Germany
- United Kingdom
- France
- Italy
- Spain
- Rest of Europe
- Asia-Pacific
- China
- Japan
- India
- South Korea
- Australia
- Rest of Asia-Pacific
- Middle East and Africa
- Middle East
- United Arab Emirates
- Saudi Arabia
- Turkey
- Rest of Middle East
- Africa
- South Africa
- Nigeria
- Rest of Africa
- Middle East
- North America
Detailed Research Methodology and Data Validation
Primary Research
Mordor analysts conducted interviews with power system engineers at colocation operators across North America, Europe, and APAC, procurement heads at hyperscalers, and regional distributors covering Latin America and the GCC. These discussions clarified live ASP movements, redundancy preferences (N+1 versus 2 N), and emerging demand for 415 V busways, ensuring model assumptions mirrored on-ground realities.
Desk Research
We began by mapping publicly available indicators such as regional hyperscale megawatt additions from the Uptime Institute, monthly utility-scale diesel gen set shipments from the US International Trade Commission, and country-level UPS export statistics on UN Comtrade, which gave us baselines for volume and average selling price trends. Annual outage cost surveys from the Ponemon Institute, patent filings on lithium-ion UPS chemistries accessed through Questel, and capacity pipeline announcements in Digital Realty and Equinix 10-Ks helped trace technology shifts toward 2 N designs and lithium batteries. Company presentations, investor transcripts, and trade association briefings (for example, AFCOM State of the Data Center) then contextualized PUE improvement targets and rack density road maps.
Internal access to Dow Jones Factiva and D&B Hoovers allowed our team to triangulate revenue splits for leading OEMs, feeding a reliable component mix. The desk research sources named here are illustrative; many additional open-source and paid references informed our validation.
The desk research sources named here are illustrative; many additional open-source and paid references informed our validation.
Market-Sizing & Forecasting
We reconstruct 2025 spending through a top-down "IT load x power density x cost per kW" pool, built from country data center megawatt additions reported by utilities and planning authorities, and corroborated with selective bottom-up roll-ups of OEM revenues and channel checks. Key variables like average rack density (kW/rack), regional PUE, lithium-ion UPS share, hyperscale capex announcements, and generator fuel switch ratios drive scenario inputs. A multivariate regression model, refreshed each quarter, projects their influence out to 2030. Where bottom-up totals undershoot, gap filling uses sampled ASP x volume from distributor surveys before iterative alignment with the top-down baseline.
Data Validation & Update Cycle
Every draft dataset passes a three-layer review: automated variance flags, peer analyst cross-checks, and senior review sign-off. We revisit sources annually and mid-cycle whenever a material event, large M&A, fuel price shock, or grid outage regulation alters assumptions. A final pre-publication sweep means clients receive our newest view each time they log in.
Why Our Data Center Power Baseline Commands Reliability
Published values differ because firms choose dissimilar component baskets, convert currencies on varying dates, or apply divergent rack density trajectories.
Key gap drivers include differing inclusion of installation services, one-time fuel treatment costs, and whether battery replacements are capitalized or expensed.
Benchmark comparison
| Market Size | Anonymized source | Primary gap driver |
|---|---|---|
| USD 24.56 B | Mordor Intelligence | - |
| USD 15.97 B | Global Consultancy A | Excludes lithium-ion UPS retrofit spend and bases density on 8 kW/rack average |
| USD 22.93 B | Trade Journal B | Treats service contracts as recurring OPEX, then annualizes to CAPEX, inflating outer year totals |
In short, the disciplined alignment of scope, the twin track modeling we apply, and our yearly refresh cadence give decision makers a transparent, repeatable baseline they can trust.


Key Questions Answered in the Report
What is the current size of the Data Center Power market?
The market reached USD 27.53 billion in 2026 and is projected to grow to USD 38.52 billion by 2031.
How fast will Data Center Power spending grow?
Spending is forecast to register a 6.95% CAGR between 2026-2031.
Which region leads Data Center Power revenue?
Europe commanded 38.54% of global revenue in 2025, buoyed by strict energy-efficiency laws.
Why are Tier 4 data centers gaining traction?
Financial-services and healthcare clients demand fault-tolerant designs, and Tier 4 facilities offer 99.995% availability with 2N+1 redundancy.
How are AI workloads changing electrical design?
Generative AI clusters draw 40-50 megawatts per hall, driving adoption of liquid-cooled racks, overhead busways, and high-capacity UPS modules.
What opportunity exists in grid-interactive batteries?
Data-center batteries can earn USD 50,000-100,000 per megawatt-hour annually by providing frequency regulation and demand response in organized power markets.
Page last updated on:


