Market Overview
| Study Period | 2020 - 2032 |
|---|---|
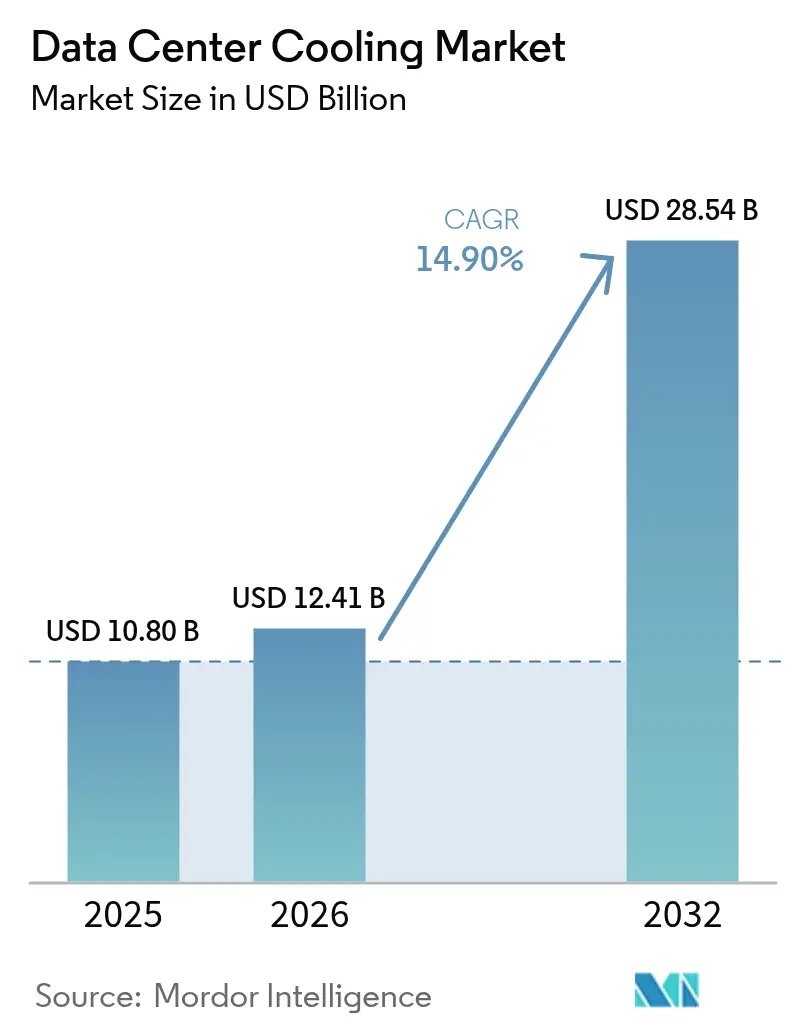
| Market Size (2026) | USD 12.41 Billion |
| Market Size (2032) | USD 28.54 Billion |
| Growth Rate (2026 - 2032) | 14.90% CAGR |
| Fastest Growing Market | Asia Pacific |
| Largest Market | North America |
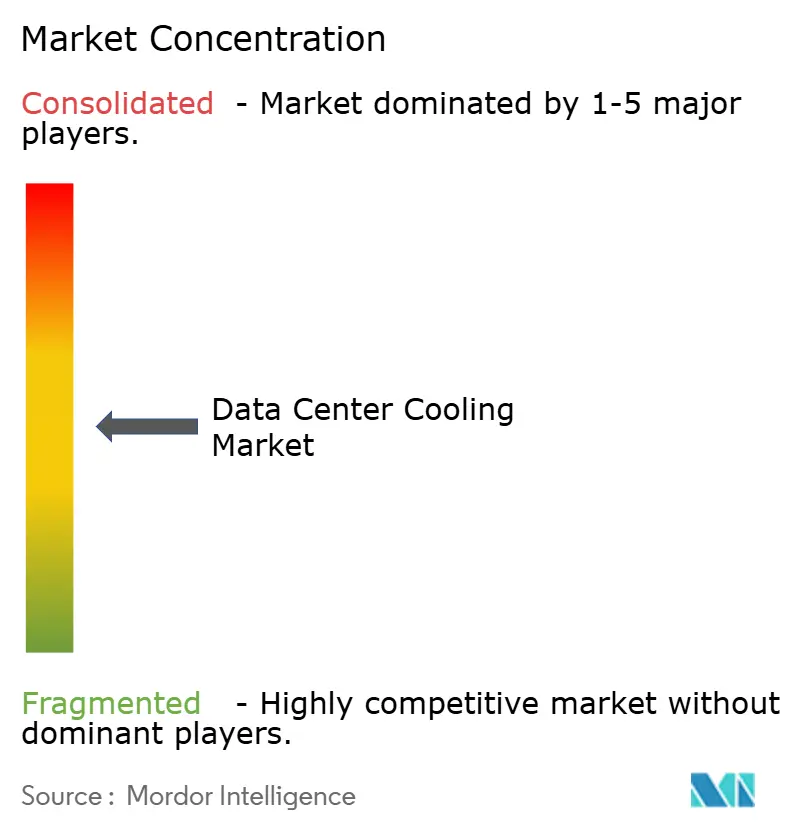
| Market Concentration | Medium |
Major Players *Disclaimer: Major Players sorted in no particular order Image © Mordor Intelligence. Reuse requires attribution under CC BY 4.0. | |
Data Center Cooling Market Analysis by Mordor Intelligence
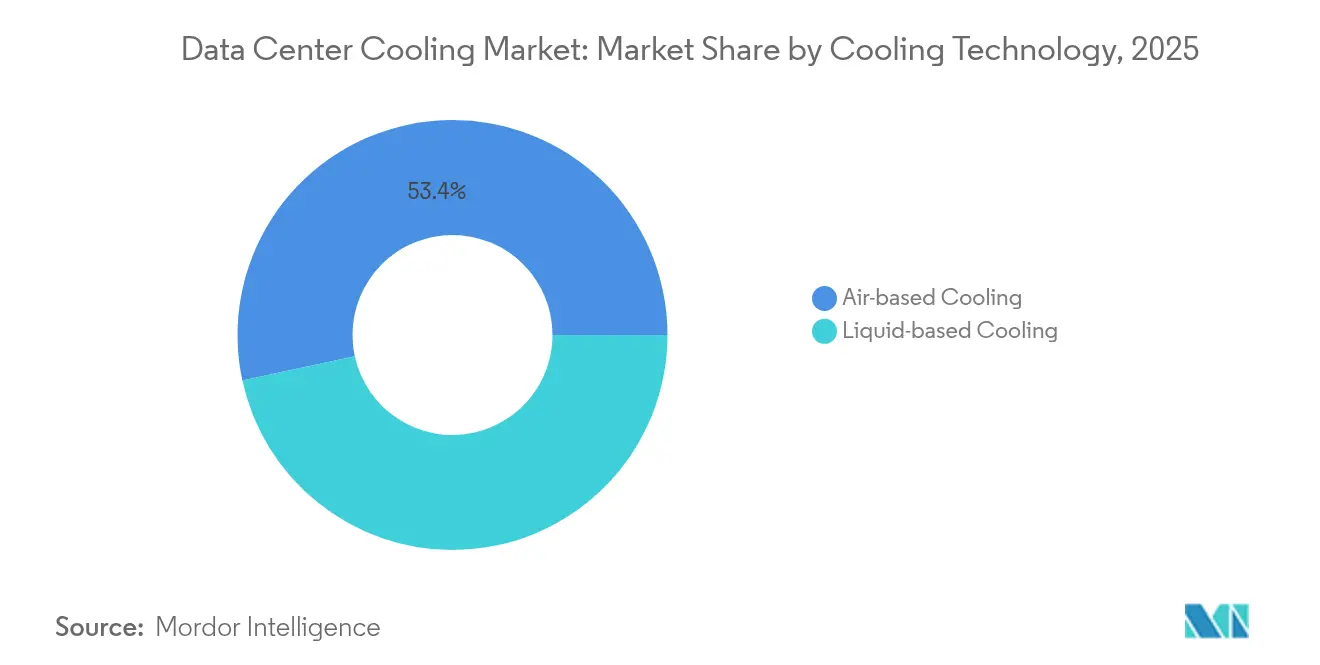
The data center cooling market size was valued at USD 10.80 billion in 2025 and estimated to grow from USD 12.41 billion in 2026 to reach USD 28.54 billion by 2032, at a CAGR of 14.90% during the forecast period (2026-2032). Ongoing migration from air-based to liquid-based thermal systems underpins this expansion, while hyperscale build-outs, AI chip heat loads and low-GWP refrigerant mandates reinforce near-term purchasing momentum. Liquid solutions already claim a 46% data center cooling market share, and their 17.50% CAGR through 2031 signals lasting preference for direct-to-chip and immersion architectures. Hyperscale operators represent the single largest demand node, yet edge and micro-site deployments now post the fastest growth at 18.00% as 5G densifies rural networks. Geographically, North America contributes 76% of spending, but Asia-Pacific’s 18.20% CAGR highlights accelerating spend in Singapore, China and Japan, where high-density designs offset land constraints. Competitive dynamics intensified in 2024-2025: Johnson Controls divested USD 8.1 billion of HVAC assets to Bosch to double down on data center-specific chillers, and Schneider Electric added immersion specialist Motivair to its portfolio, signaling a strategic pivot toward liquid engineering.
Key Report Takeaways
- By cooling technology, liquid-based systems held a 46.60% in data center cooling market share in 2025 and are advancing at a 17.25% CAGR to 2032.
- By cooling component, computer-room air handlers held a 30.60% in data center cooling market share in 2025 and chillers and heat-exchanger units are advancing at a 15.70% CAGR to 2032.
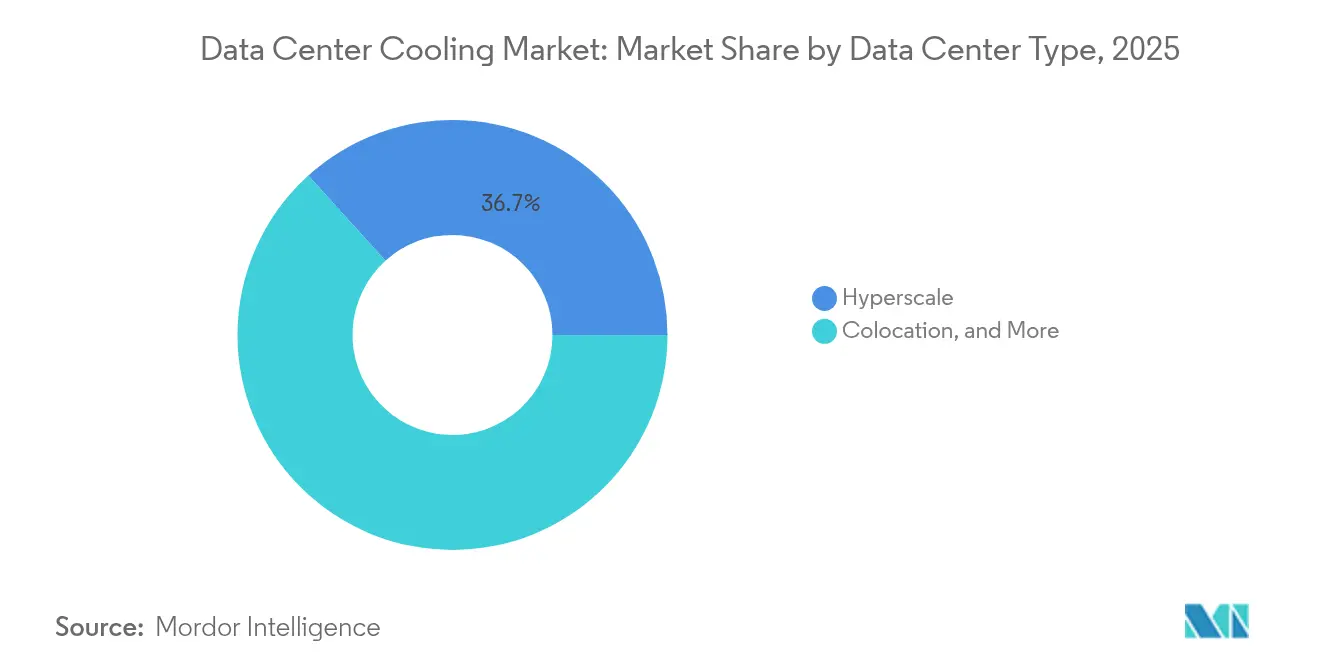
- By data center type, enterprise are projected to grow at an 17.55% CAGR through 2032 while hyperscale venues retained 36.70% share of the data center cooling market size in 2025.
- By end-user industry, IT and telecommunications accounted for 29.10% of the data center cooling market size in 2025, while healthcare applications are slated for a 13.95% CAGR through 2032.
- By geography, Asia-Pacific is predicted to chart the fastest trajectory, expanding at an 17.85% CAGR between 2026-2032, whereas North America commanded a 75.56% revenue share of the data center cooling market size in 2025.
Note: Market size and forecast figures in this report are generated using Mordor Intelligence’s proprietary estimation framework, updated with the latest available data and insights as of 2026.
Global Data Center Cooling Market Trends and Insights
Drivers Impact Analysis*
| Driver | (~) % Impact on CAGR Forecast | Geographic Relevance | Impact Timeline |
|---|---|---|---|
| AI and HPC workload heat-density surge | +4.20% | North America, China | Short term (≤ 2 years) |
| Hyperscale footprint expansion in secondary metros | +3.10% | North America, Asia-Pacific | Medium term (2-4 years) |
| Mandatory PUE / GHG disclosure regulations | +2.80% | Europe, North America | Medium term (2-4 years) |
| Global heat-wave frequency raising cooling demand | +1.90% | Middle East, Southern US | Long term (≥ 4 years) |
| Monetization of waste heat via district-energy loops | +1.50% | Nordics, Western Europe | Long term (≥ 4 years) |
| Tax-incentivized edge build-outs in rural grids | +1.60% | Rural US, Emerging Asia-Pacific | Medium term (2-4 years) |
| Source: Mordor Intelligence | |||
AI and HPC workload heat-density surge
GPU-dense servers now dissipate beyond 200 kW per rack, dwarfing legacy 10 kW envelopes and rendering conventional CRAC units ineffective. Direct-to-chip cold plates and full-immersion baths have therefore moved from pilots to production floors, particularly inside Meta and Microsoft AI clusters. Chipmakers embed liquid interface channels in next-generation packages, eroding the barrier between compute silicon and facility infrastructure [1].Jacqueline Davis, “Too Hot to Handle? Operators to Struggle with New Chips,” Uptime Institute, journal.uptimeinstitute.com Regulatory bodies simultaneously push PUE below 1.3, creating a dual-pressure environment that favors liquid technologies.
Hyperscale footprint expansion in secondary metros
Operators chase lower land costs and cleaner power in Phoenix, Columbus and Osaka, but those locations often lack mature utility infrastructure. As a result, projects specify modular chillers and rear-door heat exchangers that shorten commissioning cycles and tolerate wide ambient swings. Secondary-city climates also grant more free-air hours, lowering lifecycle cost metrics that drive board-level cap-ex approvals.
Mandatory PUE / GHG disclosure regulations
The EU Energy Efficiency Directive compels sites above 500 kW IT load to file annual PUE and waste-heat statements. California’s Title 24 and Singapore’s Green Mark echo that direction. Operators unable to show continuous efficiency improvement risk higher carbon fees or moratoriums on expansion, steering procurement toward chillers charged with R-454B refrigerant and software that tunes fan speeds in real time [2].European Commission, “Energy Efficiency Directive,” ec.europa.eu
Global heat-wave frequency raising cooling demand
2024 set temperature records in London and Phoenix, shrinking free-cooling windows and stressing mechanical equipment. ASHRAE responded by widening the recommended server inlet band to 27 °C, yet operators still added DX coils and adiabatic coolers for resilience. Middle-Eastern sites increasingly deploy two-stage evaporative condensers that cap compressor runtime during 50 °C afternoons.
Restraints Impact Analysis*
| Restraint | (~) % Impact on CAGR Forecast | Geographic Relevance | Impact Timeline |
|---|---|---|---|
| Cap-ex premium of advanced liquid technologies | -2.40% | Global | Short term (≤ 2 years) |
| Retrofit complexity in legacy white-spaces | -1.80% | North America, Europe | Medium term (2-4 years) |
| Limited supply of low-GWP refrigerants | -1.20% | Developed markets | Medium term (2-4 years) |
| Warranty risk from non-standard immersion fluids | -0.90% | Hyperscale early adopters | Short term (≤ 2 years) |
| Source: Mordor Intelligence | |||
Cap-ex premium of advanced liquid technologies
Immersion tanks cost 60% more than traditional hot-aisle containment, and specialized dielectric fluids range USD 5-7 per liter, challenging ROI in sites below 2 MW. Nevertheless, energy savings of 30-40% compress payback to under three years in high-electricity-tariff regions.
Retrofit complexity in legacy white-spaces
Raised-floor layouts and undersized busways hinder liquid pipe routing, often driving upgrade budgets to 70% of greenfield spending. Many colos therefore choose to mothball 2010-era halls rather than undertake disruptive retrofits[3].Dan Rabb, “AI Is Making Older Data Centers Obsolete, Yet Upgrades Are Rare,” Bisnow, bisnow.com
*Our forecasts treat driver/restraint impacts as directional, not additive. The impact forecasts reflect baseline growth, mix effects, and variable interactions.
Segment Analysis
By Cooling Technology: Liquid systems broaden adoption scope
The data center cooling market size for liquid methods reached USD 5.90 billion in 2026 and will eclipse USD 15.33 billion by 2032, advancing at 17.25% CAGR. Direct-to-chip pipelines dominate new AI racks, while dual-phase immersion tubs claim niche workloads such as crypto hashing clusters. Air-based chiller and CRAC arrays remain common in enterprise environments where rack densities linger below 15 kW, yet their share declines annually as regulations squeeze PUE targets. Vendors counter with hybrid coolers marrying glycol loops and adiabatic pads to extend free-cooling seasons.
Rear-door heat exchangers bridge the gap for operators unwilling to re-rack entire halls; a single exchanger lifts rack capacity from 12 kW to 30 kW without floor welding. Meanwhile, patents on microconvective cold plates promise 350 W/cm² heat flux removal, foreshadowing liquid’s march into mainstream x86 servers. Edge enclosures import factory-sealed coolant modules to slash on-site labor, aligning with unmanned operation mandates.


By Cooling Component: Integrated platforms eclipse stand-alone hardware
Computer-room air handlers still account for 30.60% of spend, but their 3.75% CAGR lags the overall data center cooling market. Conversely, chillers and heat-exchanger units will log 15.70% CAGR as liquid adoption expands pipework demand. Pumps, valves and redundancy manifolds form a USD 1.95 billion submarket in 2026, benefitting from direct-to-chip loop proliferation. AI-driven supervisory software posts the fastest growth, trimming fan RPM and compressor staging to save 15-25% energy at Google and Alibaba campuses. Integrated suites that blend hardware, telemetry and machine-learning controls command premium pricing yet deliver quantifiable OPEX reduction, convincing CFOs faster than standalone consoles.
By Data Center Type: Edge surges, hyperscale sustains volume
Hyperscale facilities represented USD 4.52 billion of the data center cooling market in 2026, buoyed by capital-intensive AI farms. However, the 17.55% CAGR for enterprise surpasses all other cohorts. Moreover, telecom carriers deploy 20-50 kW prefabricated pods near 5G towers, with sealed liquid loops ensuring 10-year service intervals. Colocation providers monetize high-density suites through surcharge models, collecting 20-30% premiums per liquid-ready rack. Enterprises confronting AI upgrades weigh retrofit cost against colocation leases, tilting demand toward third-party high-density halls.
By End-user Industry: Healthcare accelerates digital diagnostics
IT and telecom subtended USD 3.54 billion cooling outlay in 2026, maintaining leadership yet pacing at a steady 12.60% CAGR. Healthcare posted only USD 0.93 billion but set a blistering 13.95% CAGR as imaging archives and AI diagnostics double compute intensity. BFSI institutions invest in redundant chillers to satisfy uptime mandates; American Family Insurance cut power spend by 50% after adopting cold-aisle containment. Retail, media and public-sector workloads expand edge deployments to enhance customer latency and sovereign data controls, collectively elevating distributed cooling demand.
Geography Analysis
North America recorded USD 9.35 billion of data center cooling market size in 2026, driven by hyperscale campuses in Phoenix, Atlanta and Columbus that favor liquid chillers able to exploit reclaimed wastewater for condenser loops. Extended summer heat waves shorten free-air windows, prompting operators to add adiabatic trim coolers for resilience.
Asia-Pacific contributed USD 1.73 billion in 2026 but will surpass USD 4.64 billion by 2032 on an 17.85% CAGR. Singapore reinstated new-build permits contingent on sub-1.3 PUE targets, steering bids toward seawater and liquid immersions. Tokyo’s densification strategy stacks multi-story halls using direct-expansion coils for each floor, while Mumbai’s coastal humidity inclines projects toward hybrid fluid coolers that mitigate water scarcity.
Europe generated USD 1.14 billion in 2026, with Nordic states extracting 250 MW of district-heating value from data center exhaust water. Frankfurt and Amsterdam now impose waste-heat-reuse quotas, nudging procurements toward high-grade water loops. Middle East and Africa adopt liquid cooling to battle 50 °C ambient peaks; Dubai’s collocated solar farm plus thermal-storage tank trims chiller electricity by 17%. Latin America saw emergent builds in Querétaro and Santiago, where cooler night air favors indirect evaporative modules that achieve 1.2 PUE despite high daytime highs.
Competitive Landscape
Strategic realignments in 2024-2025 reshaped vendor rosters. Johnson Controls offloaded its residential HVAC arm to Bosch for USD 8.1 billion, freeing cash to scale YORK® YVAM centrifugal chillers that cut energy 40% using R-454B refrigerant. Schneider Electric’s Motivair buyout expanded immersion capabilities, while Vertiv absorbed BiXin Energy to bolster modular chiller design for Asian clients.
Challenger firms such as LiquidStack deliver two-phase immersion tanks certified for 100 kW racks, capturing edge pilots with 20-30% bandwidth in ruggedized enclosures. Asetek and JetCool advance cold-plate IP, prompting OEM collaborations with Dell and Lenovo. Patent volume around microfluidic die channels surged 38% YoY, led by IBM and Microsoft filings.
Pricing competition intensifies in commoditized CRAH ranges, but premium differentiation persists in software-defined cooling suites that unify telemetry, AI optimization and carbon reporting dashboards. Customers now award multi-year master service agreements to vendors demonstrating verifiable Scope-1 and Scope-2 emissions cuts.
Data Center Cooling Industry Leaders
Stulz GmbH
Rittal GmbH & Co. KG
Vertiv Group Corp.
Alfa Laval AB
Johnson Controls Inc.
- *Disclaimer: Major Players sorted in no particular order

Recent Industry Developments
- August 2025: Bosch finalizes USD 8.1 billion takeover of Johnson Controls’ light-commercial HVAC unit, doubling its cooling workforce to 26,000.
- June 2025: Johnson Controls forms Global Data Center Solutions arm to integrate chillers, controls and services for hyperscale clients.
- April 2025: Rittal debuts Blue e+ rack coolers with IoT analytics, targeting 80 kW cabinets.
- January 2025: Johnson Controls launches YORK® YVAM magnetic-bearing chiller delivering 40% energy savings and 466 GWP refrigerant compliance.
- October 2024: Vertiv acquires BiXin Energy Technology to reinforce high-capacity chiller line.
- September 2024: Schneider Electric completes Motivair purchase, adding immersion capability for GPU clusters.


Global Data Center Cooling Market Report Scope
Data center cooling is a set of techniques and technologies to maintain optimal operating temperatures in data center environments. It is critical as data center facilities house many computer servers and network equipment that generate heat during operation. Efficient cooling systems are used to dissipate this heat and prevent the equipment from overheating, ensuring continued reliable operation of the data center. Various methods, such as air conditioning, liquid cooling, and hot/cold aisle containment, are commonly used to control temperature and humidity in data centers.
The data center cooling market is segmented by technology (air-based cooling [chiller and economizer, CRAH, cooling towers, and other air-based cooling technologies] and liquid-based cooling [immersion cooling, direct-to-chip cooling, and rear-door heat exchanger]), type of data center (hyperscaler, enterprise, and colocation), end-user industry (IT and telecom, retail and consumer goods, healthcare, media and entertainment, federal and institutional agencies, and other end-user industries), and region (North America, Europe, Asia-Pacific, and Rest of the World). The report offers market sizes and forecasts in terms of value (USD) for all the above segments.
By Cooling Technology
| Air-based Cooling | Chiller and Economizer |
| CRAH (Computer-Room Air Handler) | |
| Cooling Tower (Direct, Indirect, Two-Stage) | |
| Other Air-based Cooling Technologies | |
| Liquid-based Cooling | Immersion Cooling |
| Direct-to-Chip Cooling | |
| Rear-Door Heat Exchanger |
By Cooling Component
| Computer-Room Air Handlers (CRAH/CRAC) |
| Chillers and Heat-Exchanger Units |
| Cooling Towers and Dry Coolers |
| Pumps and Valves |
| Control and Monitoring Software |
By Data Center Type
| Hyperscale (Owned and Leased) |
| Enterprise (On-Premise) |
| Colocation |
By End-user Industry
| IT and Telecom |
| Retail and Consumer Goods |
| Healthcare |
| Media and Entertainment |
| Federal and Institutional Agencies |
| Other End users |
By Geography
| North America | United States |
| Canada | |
| Mexico | |
| South America | Brazil |
| Argentina | |
| Chile | |
| Rest of South America | |
| Europe | Germany |
| United Kingdom | |
| France | |
| Rest of Europe | |
| Asia-Pacific | China |
| India | |
| Japan | |
| Rest of Asia-Pacific | |
| Middle East and Africa | Middle East |
| Africa |
| By Cooling Technology | Air-based Cooling | Chiller and Economizer |
| CRAH (Computer-Room Air Handler) | ||
| Cooling Tower (Direct, Indirect, Two-Stage) | ||
| Other Air-based Cooling Technologies | ||
| Liquid-based Cooling | Immersion Cooling | |
| Direct-to-Chip Cooling | ||
| Rear-Door Heat Exchanger | ||
| By Cooling Component | Computer-Room Air Handlers (CRAH/CRAC) | |
| Chillers and Heat-Exchanger Units | ||
| Cooling Towers and Dry Coolers | ||
| Pumps and Valves | ||
| Control and Monitoring Software | ||
| By Data Center Type | Hyperscale (Owned and Leased) | |
| Enterprise (On-Premise) | ||
| Colocation | ||
| By End-user Industry | IT and Telecom | |
| Retail and Consumer Goods | ||
| Healthcare | ||
| Media and Entertainment | ||
| Federal and Institutional Agencies | ||
| Other End users | ||
| By Geography | North America | United States |
| Canada | ||
| Mexico | ||
| South America | Brazil | |
| Argentina | ||
| Chile | ||
| Rest of South America | ||
| Europe | Germany | |
| United Kingdom | ||
| France | ||
| Rest of Europe | ||
| Asia-Pacific | China | |
| India | ||
| Japan | ||
| Rest of Asia-Pacific | ||
| Middle East and Africa | Middle East | |
| Africa | ||


Key Questions Answered in the Report
What is the forecasted value of the data center cooling market in 2032?
The data center cooling market size is projected to reach USD 28.54 billion by 2032.
Which cooling technology will grow the fastest through 2032?
Liquid-based systems, encompassing direct-to-chip and immersion methods, are forecast at a 17.25% CAGR.
How are regulations influencing cooling technology choices?
Mandatory PUE and refrigerant phase-down rules favor energy-efficient liquid chillers charged with low-GWP blends, accelerating their adoption.
Which region is expanding fastest in data center cooling spend?
Asia-Pacific leads with an 17.85% CAGR, propelled by dense urban builds in Singapore, Tokyo and Mumbai that demand high-performance thermal designs.
What payback period can operators expect when shifting from air to liquid cooling?
In regions with high electricity tariffs, liquid solutions can recoup their higher cap-ex within three to five years via 30-40% energy savings.
Page last updated on:


