Market Overview
| Study Period | 2020 - 2031 |
|---|---|
| Forecast Data Period | 2026 - 2031 |
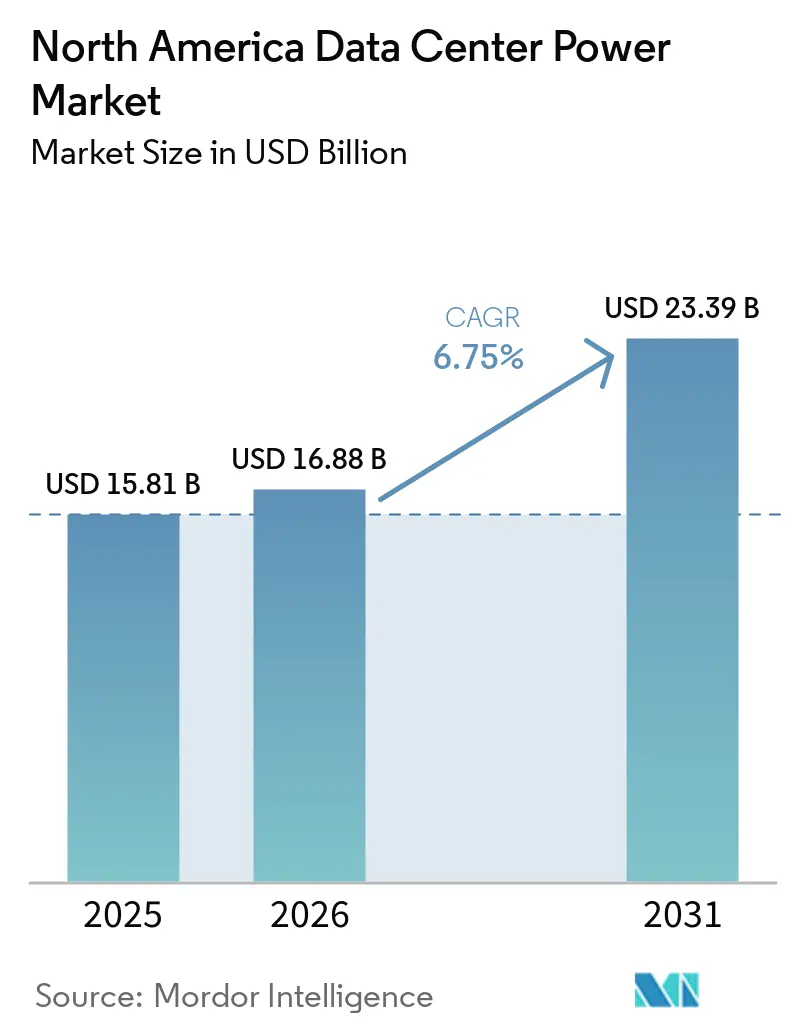
| Base Year Market Size (2025) | USD 15.81 Billion |
| Market Size (2026) | USD 16.88 Billion |
| Market Size (2031) | USD 23.39 Billion |
| Growth Rate (2026 - 2031) | 6.75% CAGR |
| Market Concentration | Medium |
Major Players *Disclaimer: Major Players sorted in no particular order Image © Mordor Intelligence. Reuse requires attribution under CC BY 4.0. | |
North America Data Center Power Market Analysis by Mordor Intelligence
The North America data center power market size in 2026 is estimated at USD 16.88 billion, growing from 2025 value of USD 15.81 billion with 2031 projections showing USD 23.39 billion, growing at 6.75% CAGR over 2026-2031. Solid growth is tied to AI-centric workloads that push rack densities from 5-15 kW to 40-140 kW, forcing operators to modernize electrical architectures. Hyperscale campuses anchor demand as they build gigawatt-scale substations, while edge computing rolls out micro sites that need autonomous UPS and generator sets. Stricter efficiency regulations such as PUE thresholds are accelerating liquid-cooling adoption and battery-energy-storage integration. Renewable power purchase agreements (PPAs) signed in Texas, Quebec, and Alberta have become a hedge against volatile utility tariffs while meeting corporate sustainability goals. Heightened grid-capacity constraints in tier-1 metros now shift expansion toward secondary U.S. markets, hydro-rich Canadian provinces, and Mexico’s emerging colocation hubs.
Key Report Takeaways
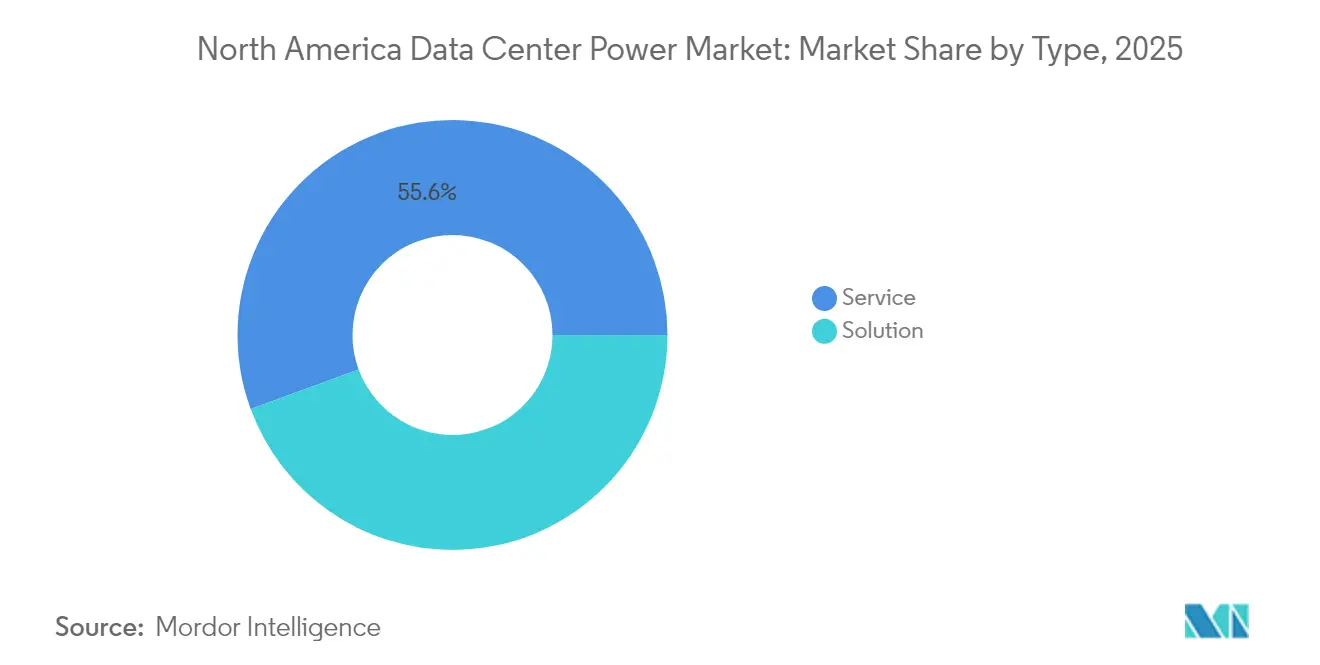
- By type, solution, power-distribution products held a 44.40% share of the North America data center power market size in 2025, whereas specialized services are expected to rise at a 6.98% CAGR through 2031.
- By data center type, hyperscale facilities commanded 47.55% revenue share in 2025; edge and micro data centers are projected to advance at a 6.92% CAGR to 2031.
- By power capacity, sites above 3 MW captured 49.10% of the North America data center power market share in 2025, while the 1.1-3 MW band is forecast to grow at 6.72% CAGR between 2026-2031.
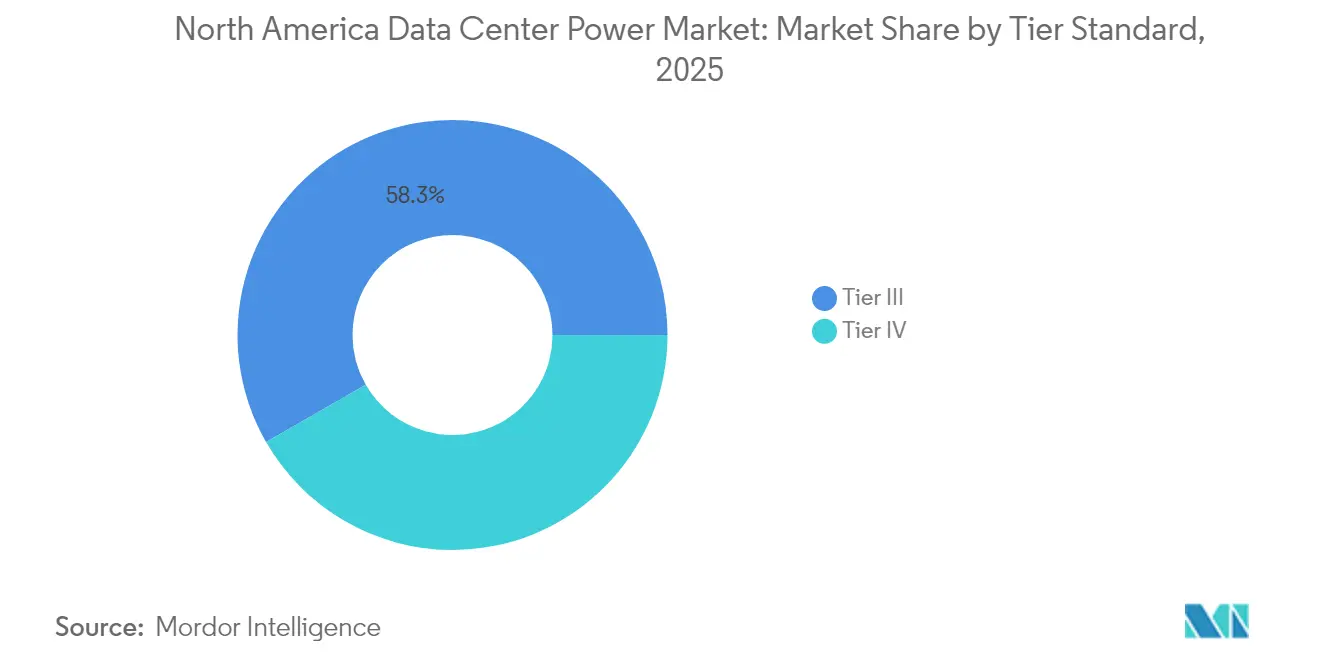
- By tier standard, Tier III facilities represented 58.30% of deployments in 2025; Tier IV is set to record a 6.88% CAGR to 2031.
- By end-user industry, IT and telecom retained 38.40% share in 2025, but healthcare and life sciences is expanding at a 6.79% CAGR through 2031.
Note: Market size and forecast figures in this report are generated using Mordor Intelligence’s proprietary estimation framework, updated with the latest available data and insights as of 2026.
North America Data Center Power Market Trends and Insights
Drivers Impact Analysis*
| DRIVER | (~) % IMPACT ON CAGR FORECAST | GEOGRAPHIC RELEVANCE | IMPACT TIMELINE |
|---|---|---|---|
| Rising adoption of hyperscale and mega data centers | +1.8% | U.S. tier-1 metros, Alberta, Quebec | Medium term (2-4 years) |
| Surge in cloud computing and OTT traffic | +1.2% | North America-wide, rural edge clusters | Short term (≤ 2 years) |
| Stringent PUE / energy-efficiency mandates | +0.9% | U.S. federal, California leadership | Long term (≥ 4 years) |
| Colocation demand from BFSI and healthcare digitalization | +0.7% | U.S. financial hubs, Canadian healthcare corridors | Medium term (2-4 years) |
| Utility-scale renewable PPAs stabilizing power costs | +0.6% | Texas wind, Quebec hydro, Alberta gas-to-power | Long term (≥ 4 years) |
| Edge-AI micro DC rollout in rural and suburban clusters | +0.5% | Suburban U.S., provincial Canadian centers | Medium term (2-4 years) |
| Source: Mordor Intelligence | |||


Rising Adoption of Hyperscale and Mega Data Centers
Hyperscale operators now plan multi-building campuses that draw hundreds of megawatts from on-site substations and deploy liquid-cooled GPU racks requiring continuous, high-quality power. Meta’s USD 65 billion program targets sub-1.1 PUE across North American sites, underscoring how power design has become a cornerstone of sustainability commitments.[1]Meta Platforms, “USD 65B AI data center expansion,” datacenters.comProjects such as Alberta’s Wonder Valley park pair natural-gas turbines with geothermal loops to create 1.4 GW of dedicated capacity, illustrating a shift toward self-generation when grid queues exceed four years. The clustering of campuses around cheap renewable resources generates regional load pockets that utilities must accommodate through accelerated transmission upgrades. Vendors that deliver factory-integrated switchgear, busways, and energy-storage modules win share by shortening electrification timelines and reducing site labor. The scale of investment also drives adoption of software-defined power monitoring that optimizes load placement and sequence-starts generators to prevent grid flicker.
Surge in Cloud Computing and OTT Traffic
Rapid growth in collaboration tools, streaming media, and generative AI inference pushes carriers and cloud providers to place compute closer to end users. Edge nodes ranging from 250 kW to 1 MW are now installed in retail strips, telco hubs, and municipal shelters, each fitted with lithium-ion UPS, compact gensets, and remote-management firmware.[2]Delta Electronics, “AI-related solutions at COMPUTEX 2024,” brandnews.deltaww.com Distributed sites complicate capacity planning because utility feeders vary widely in voltage stability and outage frequency. Operators mitigate risk with dual-feed automatic transfer switches and cloud-based SCADA dashboards that aggregate alarms across hundreds of micro facilities. Content delivery acceleration also demands higher burst power to cover codec transcoding spikes, prompting adoption of static-switch UPS topologies that deliver millisecond transfer times. The cumulative effect of thousands of edge sites lifts overall regional load, yet each location must comply with state energy codes that increasingly cap allowable PUE thresholds.
Stringent PUE / Energy-Efficiency Mandates
Federal and state regulators mandate reporting of real-time energy metrics, which pressures owners to retrofit legacy electrical rooms with high-efficiency rectifiers, solid-state breakers, and battery-energy-storage systems (BESS). Schneider Electric estimates that U.S. data centers will need an incremental 43-92 GW of capacity by 2030, reinforcing the urgency of PUE improvements to forestall grid strain.[3]S. Perri, “Schneider Electric outlines pathways for a modern, resilient grid to power America’s AI-driven future,” se.com Operators respond by adopting on-board 48 VDC power distribution inside servers, cutting AC-DC conversion stages. ABB’s BESS-as-a-Service model allows campuses to arbitrage peak tariffs and shave demand spikes without upfront battery investment. California’s Title 24 revisions already require liquid cooling or equivalent efficiency for high-density halls, a standard many expect New York and Illinois to replicate. Compliance requires sophisticated EMS platforms that track rolling-hour averages and issue corrective commands to chillers and IT loads. Retrofitting brownfield sites consumes capital but often delivers sub-2-year payback because energy savings compound across 20-year asset lives.
Colocation Demand from BFSI and Healthcare Digitalization
Banks migrate core processing to shared facilities that guarantee ≥ 99.999% uptime, spurring installations of 2 N UPS trains and ISO-27001-certified generator yards. Healthcare providers digitize imaging archives and telemedicine platforms, necessitating continuous power to comply with patient-safety statutes. Mitsubishi Electric introduced 2 000 kVA UPS frames to meet the segment’s fault-current and ride-through specifications. Colocation contracts now bundle energy-usage dashboards that isolate each tenant’s CO₂ footprint, aligning with ESG-linked financing requirements. The trend raises demand for managed-service offerings—maintenance, capacity planning, and compliance reporting—valued for reducing client capex outlays. Canadian provinces encourage hospital data-migration through procurement frameworks that give preference to hydro-powered facilities, reinforcing cross-border competition for compliant electrical designs.
Restraints Impact Analysis*
| RESTRAINTS | (~) % IMPACT ON CAGR FORECAST | GEOGRAPHIC RELEVANCE | IMPACT TIMELINE |
|---|---|---|---|
| High upfront CAPEX for power and cooling retrofits | -0.8% | U.S. legacy facilities, older Canadian metros | Short term (≤ 2 years) |
| Grid-capacity bottlenecks in tier-1 metros | -0.6% | New York, San Francisco, Toronto | Medium term (2-4 years) |
| Skilled labor shortage for high-voltage installation projects | -0.5% | U.S. Mid-Atlantic, Canadian Prairies | Medium term (2-4 years) |
| Long lead times for transformers and switchgear | -0.4% | North America-wide, acute in Gulf Coast ports | Short term (≤ 2 years) |
| Source: Mordor Intelligence | |||
High Upfront CAPEX for Power & Cooling Retrofits
Many brownfield data centers were designed for 5-15 kW racks and must be gutted to accommodate 40-140 kW AI loads. Electrical rooms often need transformer upsizing, busway rerouting, and replacement of air-cooled CRAC units with liquid chillers, driving project costs above new-build benchmarks. Operators must stage construction around live workloads, lengthening schedules and elevating risk. Smaller providers struggle to secure financing for large-scale electrical upgrades without anchor customers or government incentives. Even where funding is available, supply-chain lead times for 24-kV switchgear and 3 MVA UPS frames can exceed 60 weeks. The immediate cash outlay thus curbs near-term market penetration of AI-optimized power solutions.
Grid-Capacity Bottlenecks in Tier-1 Metros
Utilities in Northern Virginia, Silicon Valley, and Toronto now face interconnection queues that stretch beyond four years, delaying dozens of planned halls. Transmission substations lack N-1 redundancy, forcing operators to seek alternative supply via on-site gas turbines or fuel-cell arrays. The North American Electric Reliability Corporation warns that rapid clustering of 200-MW campuses could destabilize voltage profiles without synchronous condensers and fast-frequency-response assets. Delays raise carrying costs on land and permits, prompting many firms to shift capex to secondary U.S. cities or Canadian provinces with surplus hydro power. While grid-modernization bills are advancing, completion timelines extend into the next decade, maintaining medium-term drag on growth.
*Our forecasts treat driver/restraint impacts as directional, not additive. The impact forecasts reflect baseline growth, mix effects, and variable interactions.
Segment Analysis
By Type: Services Gain Momentum as AI Complexity Grows
The segment holding 44.40% of 2025 revenue remains power-distribution solutions—switchgear, PDU, and busway—that form the electrical backbone of every facility. However, services are expanding at a 6.98% CAGR because owners need design, integration, and predictive-maintenance expertise. Consulting engagements now begin months before ground-break, covering harmonic analysis, short-circuit studies, and energy-storage ROI modeling. Integration specialists engineer “single-line-diagram” conformity across multi-phase build-outs to avoid stranded capacity. Support teams embed edge analytics in UPS modules, generating data that auto-creates work orders before SLA breaches. Those value-added services raise stickiness, turning hardware suppliers into long-term partners.
Vendors bundle firmware upgrades that enable advanced runtime calculations, extending battery life and cutting replace-ment cycles. Where labor availability is tight, remote-hands contracts cover IR scanning, breaker racking, and thermal runway avoidance. The North America data center power market benefits because service annuities smooth revenue between mega-project cycles, incentivizing firms to maintain large regional field forces that in turn reassure hyperscale clients of rapid response times.


By Data Center Type: Edge Computing Drives Distributed Power
Hyperscale campuses held 47.55% share in 2025, reflecting their sheer size and standardized power blocks. Yet edge and micro data centers deliver the fastest CAGR at 6.92% as AI inference shifts computing toward consumers. These pods rely on 208/415 V distribution with high-efficiency line-interactive data center UPS to minimize footprint, in contrast to 13.8 kV feeders and double-conversion UPS found in hyperscale builds. The North America data center power market size for edge form factors thus grows on a unit-count basis rather than megawatt alone.
In parallel, enterprise facilities embrace hybrid models, expanding electrical capacity to host private-cloud clusters while offloading latency-sensitive tasks to nearby edge nodes. Operators adopt modular battery cabinets that scale in 100 kW increments, matching phased IT expansions. Hyperscale builders experiment with direct renewable feeders combined with short-duration flywheel UPS to shave opex. The convergence of design philosophies drives suppliers to offer “families” of switchgear and UPS that share firmware and monitoring APIs, cutting integration costs across facility classes.
By Power Capacity: Mid-Range Facilities Find Sweet Spot
Sites above 3 MW captured 49.10% of 2025 spend as hyperscale builders lit up 96-rack halls fed by 34.5 kV loops. Meanwhile, the 1.1-3 MW bracket posts 6.72% CAGR, representing a Goldilocks zone for enterprise and colocation users that need flexibility without hyperscale complexity. These customers favor 1 000 kVA UPS blocks and 2.5 MVA pad-mount transformers that balance leading-time efficiency with redundancy. The North America data center power market size in this range rides on standardized skids delivered pre-wired to reduce commissioning risk.
Elsewhere, sub-500 kW edge pods ship with 380 VDC backplanes that trim conversion losses and ease battery integration. High-density AI data center racks push even “small” sites toward 800 A busways, proving that amperage, not square footage, defines future capacity planning. Vendors respond with modular arc-flash detection and sectionalized bus ducts that allow live expansion. Across all sizes, harmonic-filtering becomes mandatory as GPU power supplies inject higher fifth-order currents.
By Tier Standard: Tier IV Gains as Availability Demands Rise
Tier III facilities still account for 58.30% of footprints, reflecting a cost-performance sweet spot. Yet Tier IV momentum builds, growing 6.88% CAGR because AI training jobs cannot restart easily after outages. Operators deploy triple-conversion UPS and geographically separated diesel yards to obtain fault-tolerance certification from the Uptime Institute. Meeting Tier IV also necessitates dual utility feeds, driving collaboration with transmission providers to lay redundant circuits.
In response, switchgear manufacturers introduce segmented bus couplers and arc-quenching devices that confine faults within milliseconds. Generator OEMs offer quick-start gas engines able to reach full load in 25 seconds, shortening ride-through battery requirements. Insurance carriers now discount premiums for certified Tier IV halls, offsetting higher capex. Those economics convince BFSI and health-tech tenants to sign long-term leases, stabilizing cash flows for facility owners.
By End-User Industry: Healthcare Digitalization Accelerates
IT and telecom preserved 38.40% of 2025 spending, but healthcare and life sciences now chart a 6.79% CAGR as imaging archives, genomic analytics, and tele-ICU services require five-nines availability. Hospitals prefer colocation sites certified at Tier III or IV, embedding dual electrical paths and battery chemistries tested for medical-grade compliance. Such deployments uplift the North America data center power market share of service-heavy projects because on-site biomedical staff depend on vendor-held maintenance SLAs.
Fintech adoption of real-time cross-border payments likewise escalates resilience requirements, driving 2 N+1 generator arrays capable of sequential start in 10 seconds. Government agencies digitize land-records and defense telemetry, specifying EMP-hardened switchgear and secure BESS enclosures. Manufacturing firms roll out Industry 4.0 sensors that demand localized micro-UPS to isolate process lines from voltage sags. The diversified vertical mix spreads electrical-component demand across ratings, maintaining a healthy pipeline for OEMs that can customize at scale.
Geography Analysis
The United States led the North America data center power market with roughly 74.20% share in 2025. Despite grid bottlenecks in Northern Virginia and Silicon Valley, nationwide demand still grows at a 6.34% CAGR through 2031 as hyperscale clouds roll out new availability zones. Secondary metros such as Atlanta, Columbus, and Phoenix attract projects by offering sub-8 c/kWh industrial tariffs and faster interconnect permits. Texas stands out for 25-year wind-farm PPAs that underpin multi-building AI campuses.
Canada records the fastest 7.98% CAGR as Quebec leverages hydropower priced near 4 c/kWh. Microsoft’s twin campuses in Lévis and L’Ancienne-Lorette together exceed 135 MW and anchor the province’s AI cluster. Alberta follows with eStruxture’s 90 MW Calgary build, aided by abundant natural gas and a pro-development regulatory stance. Provincial programs streamline renewable PPAs, allowing operators to lock in carbon-free supply ahead of federal clean-electricity targets.
Mexico emerges as a nascent node, propelled by near-shoring and data-sovereignty policies. Colocation spend concentrates around Querétaro’s “Data Center Alley,” where utility CFE commits to 400 kV upgrades. LNG-to-power projects along the Gulf enable on-site generation for campuses exceeding 30 MW. Regulators fast-track permit packages that bundle fiber landing stations with transformer rights-of-way, compressing project timelines. Combined, these dynamics diversify the North America data center power market, steering capex into regions with favorable energy mixes.
Competitive Landscape
Market structure is moderately consolidated: the top five suppliers-ABB, Schneider Electric, Vertiv, Eaton, and Mitsubishi Electric-control roughly 62% of regional revenue. Each now bundles switchgear, UPS, BESS, and digital-twins into turnkey packages to win multi-year master supply agreements. ABB’s SACE Emax 3 breaker adds IEC 62443 Level 2 cybersecurity and predictive-maintenance analytics, catering to AI-centric halls that cannot tolerate unplanned trips. Schneider couples medium-voltage gear with liquid-cooling racks, selling efficiency gains measured in megawatt-hours saved.
Start-ups focus on software-defined power orchestration, integrating telemetry from batteries, generators, and IT loads to flatten spikes and monetize demand-response programs. Partnerships between OEMs and hyperscale buyers drive co-development of 800 VDC rack-level architectures; Infineon and NVIDIA’s 800 V bus exemplar delivers single-digit conversion losses. Edge-specific vendors differentiate by ruggedizing UPS and distribution under wide ambient ranges, critical for unmanned telco shelters. Cybersecurity hardening emerges as a tender prerequisite, favoring firms with IEC 62443 and NERC CIP certifications.
Integration depth, not component price, dictates award decisions. Customers favor suppliers that hold turnkey liability, merging electrical, mechanical, and controls scope into a single warranty. This shift squeezes niche component makers that lack service arms. Still, open-compute-inspired designs encourage interoperable gear, allowing regional VARs to assemble competitive offers with white-label components. Over the forecast horizon, consolidation may intensify as global conglomerates acquire BESS and controls specialists to fill portfolio gaps.
North America Data Center Power Industry Leaders
ABB Ltd.
Schneider Electric SE
Siemens AG
Vertiv
Eaton (incl. Tripp Lite)
- *Disclaimer: Major Players sorted in no particular order

Recent Industry Developments
- July 2025: ABB launched the SACE Emax 3 air circuit breaker with IEC 62443 Level 2 cybersecurity, targeting predictive maintenance for AI clusters.
- July 2025: Meta confirmed a USD 65 billion North American expansion aiming for sub-1.1 PUE and 1.2 million GPUs.
- June 2025: Siemens Energy and Eaton partnered on modular 500 MW gas-turbine power plants for grid-constrained data centers.
- May 2025: Infineon and NVIDIA disclosed an 800 V high-voltage DC power-delivery design for GPU racks.


North America Data Center Power Market Report Scope
Data center power refers to the power infrastructure, which includes electrical components and electrical distribution systems that provide the power necessary to operate and support the devices and servers within the data center. It includes various components and technologies designed to ensure a reliable, uninterruptible power supply for data center IT equipment, including, uninterruptible power supplies (UPS), power distribution units (PDU), backup generators, and other power management solutions tailored to the specific needs of data centers. Data center operators achieve redundancy through duplicated components to maintain uninterrupted operations in the event of failure of some components and to maintain uptime during maintenance.
The North American data center power market is segmented by type (by solution (power distribution solution (PDU – basic & smart – metered & switched solutions, transfer switches (static, automatic), switchgear (low-voltage, medium-voltage), power panels & components, others)), power backup solutions (UPS, generators)), by service (design & consulting, integration, support & maintenance)), by data center type (colocation, enterprise & cloud, and hyperscaler), by end user (IT & telecom, BFSI, government, media & entertainment, manufacturing, and other end user) and country (United States, Canada). The market sizes and forecasts are provided in terms of value (USD) for all the above segments.
By Type
| By Solution Type | Power Distribution Solutions | Transfer Switches |
| Switchgear | ||
| Power Panels and Components | ||
| Others | ||
| Power Backup Solutions | UPS | |
| Generators | ||
| Service – Design and Consulting, Integration, Support and Maintenance | ||
By Data Center Type
| Colocation Facilities |
| Enterprise/Edge Facilities |
| Hyperscale/Self-built Facilities |
By End-User Industry
| BFSI |
| IT and Telecom |
| Government and Defense |
| Manufacturing and Industrial |
| Media and Entertainment |
| Healthcare and Life Sciences |
| Retail and E-commerce |
By Power Capacity
| less than or equal to 500 kW |
| 501 kW – 1 MW |
| 1.1 – 3 MW |
| greater than 3 MW |
By Tier Standard
| Tier I and II |
| Tier III |
| Tier IV |
By Country
| United States |
| Canada |
| Mexico |
| By Type | By Solution Type | Power Distribution Solutions | Transfer Switches |
| Switchgear | |||
| Power Panels and Components | |||
| Others | |||
| Power Backup Solutions | UPS | ||
| Generators | |||
| Service – Design and Consulting, Integration, Support and Maintenance | |||
| By Data Center Type | Colocation Facilities | ||
| Enterprise/Edge Facilities | |||
| Hyperscale/Self-built Facilities | |||
| By End-User Industry | BFSI | ||
| IT and Telecom | |||
| Government and Defense | |||
| Manufacturing and Industrial | |||
| Media and Entertainment | |||
| Healthcare and Life Sciences | |||
| Retail and E-commerce | |||
| By Power Capacity | less than or equal to 500 kW | ||
| 501 kW – 1 MW | |||
| 1.1 – 3 MW | |||
| greater than 3 MW | |||
| By Tier Standard | Tier I and II | ||
| Tier III | |||
| Tier IV | |||
| By Country | United States | ||
| Canada | |||
| Mexico | |||


Key Questions Answered in the Report
What is the forecast CAGR for data-center power spending in North America through 2031?
Spending is projected to advance at a 6.75% CAGR, reaching USD 23.39 billion by 2031.
Which data-center type is expanding fastest?
Edge and micro facilities post a 6.92% CAGR as AI inference drives low-latency compute.
Why are Tier IV certifications gaining popularity?
AI training and financial-services workloads demand fault-tolerant power systems that remove single points of failure, pushing Tier IV adoption at 6.88% CAGR.
How does Canada attract AI data-center investment?
Provinces such as Quebec offer low-cost hydroelectric power and long-term PPAs, supporting a 7.98% CAGR in Canadian spending.
Which component makers lead in North America?
ABB, Schneider Electric, Vertiv, Eaton, and Mitsubishi Electric collectively hold roughly 62% share, reflecting their integrated power portfolios.
Page last updated on:


