Market Overview
| Study Period | 2020 - 2031 |
|---|---|
| Forecast Data Period | 2026 - 2031 |
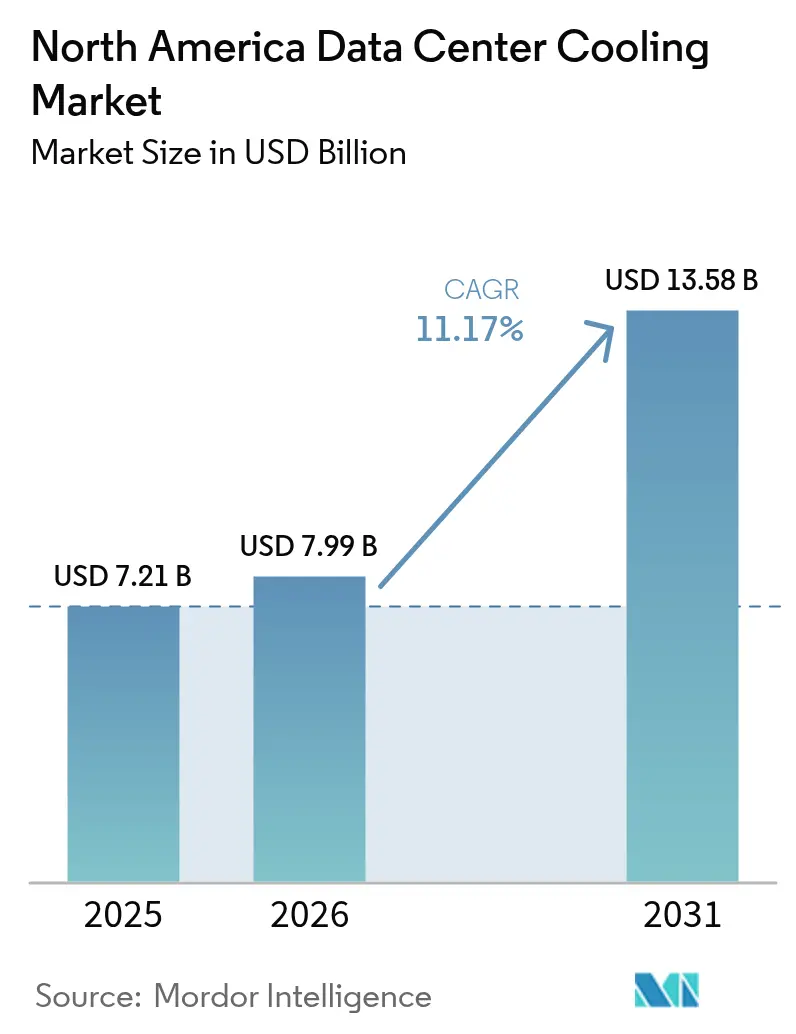
| Base Year Market Size (2025) | USD 7.21 Billion |
| Market Size (2026) | USD 7.99 Billion |
| Market Size (2031) | USD 13.58 Billion |
| Growth Rate (2026 - 2031) | 11.17% CAGR |
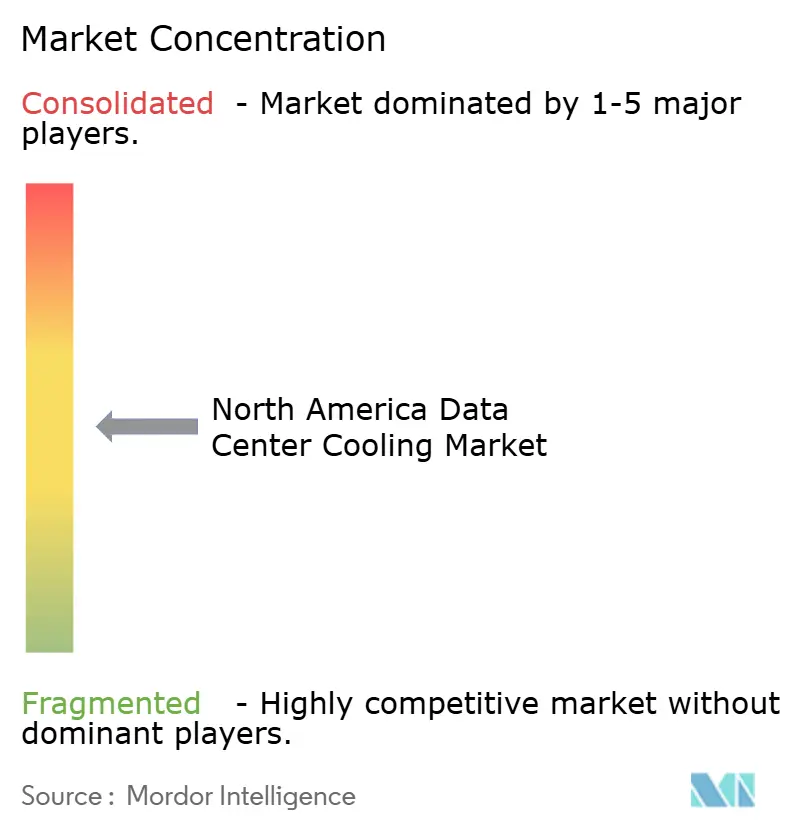
| Market Concentration | Medium |
Major Players *Disclaimer: Major Players sorted in no particular order Image © Mordor Intelligence. Reuse requires attribution under CC BY 4.0. | |
North America Data Center Cooling Market Analysis by Mordor Intelligence
The North America data center cooling market size is projected to be USD 7.21 billion in 2025, USD 7.99 billion in 2026, and reach USD 13.58 billion by 2031, growing at a CAGR of 11.17% from 2026 to 2031. Rising rack densities above 40 kilowatts are pressuring operators to swap legacy air systems for liquid architectures that draw heat directly from processors, a shift reinforced by federal mandates that link lease renewals to power-usage-effectiveness benchmarks. Inflation Reduction Act tax credits covering up to 30% of eligible equipment costs accelerate the retirement of high-GWP chillers, while state water-use caps in desert markets push demand for closed-loop dry coolers. Competitive intensity remains elevated as HVAC majors retrofit chiller portfolios and liquid-cooling specialists secure design wins by guaranteeing sub-25 °C chip temperatures. Developers are also navigating power-grid constraints in Northern Virginia and drought-related insurance surcharges that influence site selection and total cost of ownership.
Key Report Takeaways
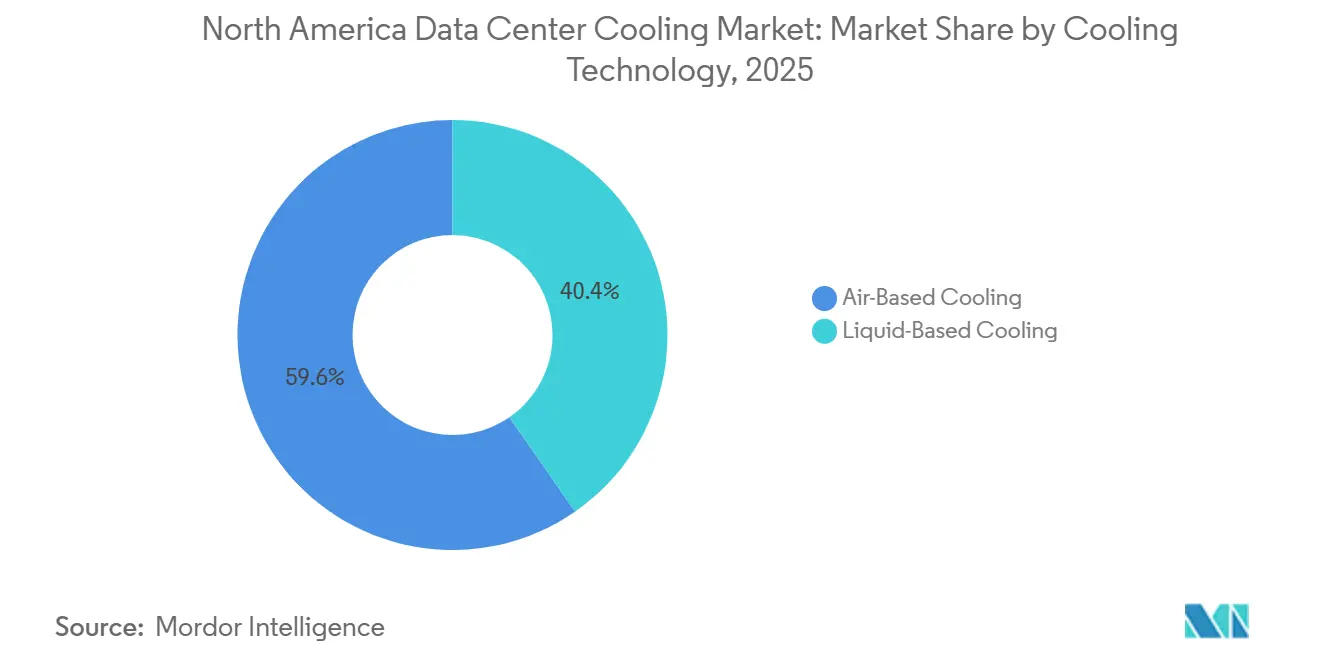
- By cooling technology, air-based systems held 59.64% share of the North America data center cooling market in 2025, whereas liquid-based systems are projected to grow at a 12.54% CAGR between 2026 and 2031.
- By data-center type, colocation facilities captured 53.68% of the market share in 2025, but hyperscalers are expected to post the fastest 12.74% CAGR during the forecast period.
- By tier type, tier 3 sites accounted for a 52.82% share in 2025, yet tier 4 installations are projected to advance at a 12.83% CAGR to 2031.
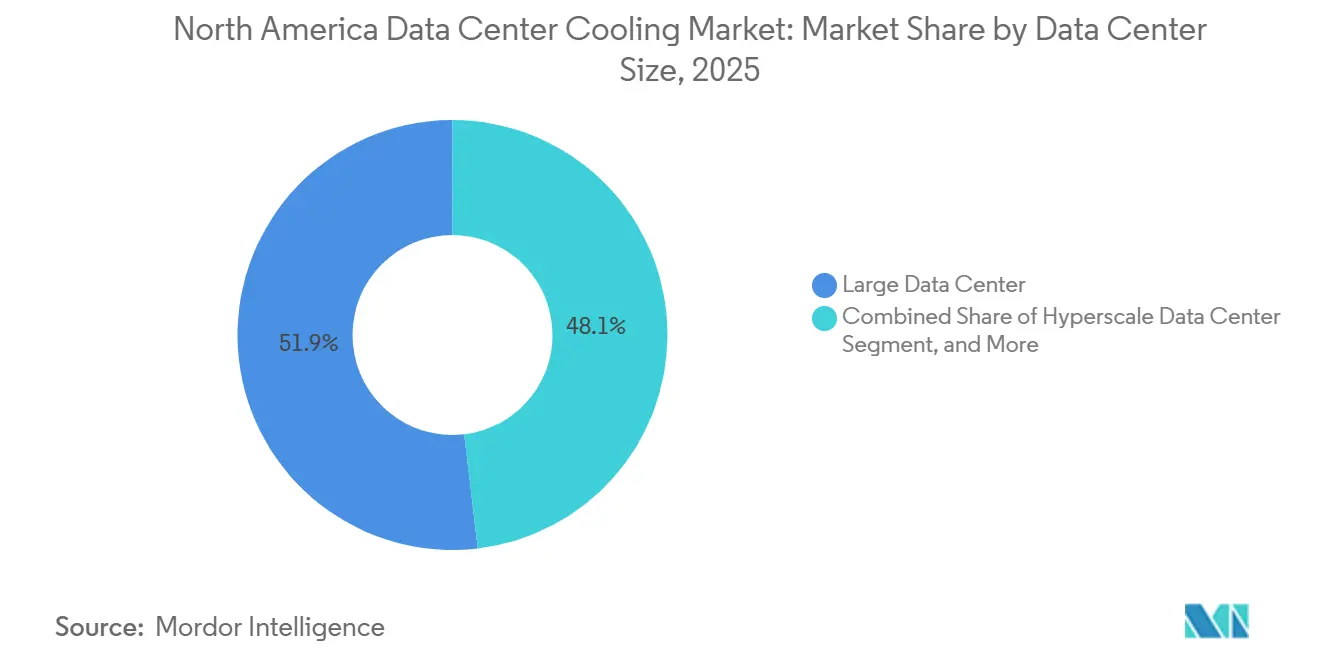
- By data center size, large data centers accounted for 51.88% of market share in 2025, while hyperscale campuses are set to register a 12.36% CAGR through 2031.
- By component, computer room air handlers commanded a 40.72% share in 2025, but pumps and valves linked to liquid loops will escalate at a 12.66% CAGR over 2026-2031.
- By country, the United States led with 79.83% of the North America data center cooling market share in 2025, while Mexico is forecast to expand at a 12.92% CAGR through 2031.
Note: Market size and forecast figures in this report are generated using Mordor Intelligence’s proprietary estimation framework, updated with the latest available data and insights as of 2026.
North America Data Center Cooling Market Trends and Insights
Drivers Impact Analysis*
| DRIVER | (~) % IMPACT ON CAGR FORECAST | GEOGRAPHIC RELEVANCE | IMPACT TIMELINE |
|---|---|---|---|
| Stringent PUE Targets Under U.S. Executive Order on Federal Sustainability | +2.3% | United States federal facilities and contractors | Medium term (2-4 years) |
| Escalating Rack Densities in Hyperscale Facilities | +2.8% | United States (Northern Virginia, Phoenix, Dallas), Canada (Toronto, Montreal) | Short term (≤ 2 years) |
| Growing Adoption of Liquid Cooling for AI and ML Workloads | +3.1% | United States hyperscale campuses, emerging in Mexico | Short term (≤ 2 years) |
| Heat-To-District Energy Purchase Agreements in Canadian Provinces | +0.9% | Canada (Ontario, Quebec, British Columbia) | Long term (≥ 4 years) |
| Inflation Reduction Act Tax Credits for Low-GWP Chillers | +1.7% | United States | Medium term (2-4 years) |
| State-Level Water Withdrawal Caps Accelerating Closed-Loop Retrofits | +1.4% | United States (Arizona, California, Nevada) | Medium term (2-4 years) |
| Source: Mordor Intelligence | |||


Stringent PUE Targets Under U.S. Executive Order on Federal Sustainability
Federal agencies must now prove PUE ratios below 1.4 for new builds and below 1.5 for existing sites by fiscal 2027, effectively disqualifying legacy raised-floor designs that rely on perimeter air handlers. Updated leasing rules require landlords to share sub-metered cooling energy data, giving tenants the right to terminate contracts if efficiency covenants are missed.[1]U.S. General Services Administration, “Data Center Optimization Initiative,” GSA.gov Contractors are pivoting to modular chiller plants with variable-speed compressors that trim PUE by up to 0.20 points. Defense workloads that once favored air-gapped security are adopting rear-door heat exchangers to cut the load seen by central plants. Commercial tenants are mirroring federal expectations, forcing multi-tenant providers to guarantee similar efficiency thresholds.
Escalating Rack Densities in Hyperscale Facilities
Training clusters for frontier AI models routinely exceed 40 kW per rack, with some GPU configurations nearing 80 kW as high-bandwidth memory and multi-die packages condense heat output. Air systems struggle to keep inlet temperatures under 27 °C at these loads without energy-intensive fan over-provisioning.[2]IEEE Staff, “High-Density Computing Challenges,” IEEE.org Hyperscalers are moving to direct-to-chip cold plates that intercept 70%-90% of processor heat before it enters room air, easing demand on air handlers. This density also reshapes site selection, pushing operators toward regions with affordable electricity and climates that permit more free-cooling hours. Legacy air infrastructure is being repurposed for lower-density storage rows, maximizing sunk investments while liquid systems protect the compute core.
Growing Adoption of Liquid Cooling for AI and ML Workloads
Inference clusters running generative-AI models sustain utilization above 80%, creating continuous thermal loads that conventional air designs cannot manage economically. Direct-to-chip loops deliver coolant at 40-50 °C, warm enough to reject heat through dry coolers without mechanical refrigeration for much of the year in temperate zones. Immersion cooling is gaining favor at space-constrained edge facilities, allowing dense compute in quiet, compact footprints. Asetek reported that liquid-cooling attach rates for AI servers in North America rose to 35% in 2025, up from below 10% two years earlier.[3]Asetek Management, “Annual Report 2025,” Asetek.com Operators now negotiate multi-year take-or-pay contracts with dielectric-fluid suppliers to hedge price and supply-chain risk as volume ramps.
Inflation Reduction Act Tax Credits for Low-GWP Chillers
The IRA offers credits covering up to 30% of equipment costs, accelerating the swap of R-134a chillers for units using R-1234ze or R-513A. HVAC majors have launched variable-speed models optimized for low-GWP refrigerants, allowing operators to meet Kigali Amendment timelines without inflating PUE. The incentive tilts procurement toward modular chillers that can be scaled in 500 kW blocks as IT load grows. Smaller colocation firms leverage the credit to close the cost gap with hyperscalers that already enjoy bulk-purchase discounts. While refrigerant price volatility remains a hurdle, the credit shortens simple payback periods and unlocks deferred projects.
Restraints Impact Analysis*
| Restraint | (~) % Impact on CAGR Forecast | Geographic Relevance | Impact Timeline |
|---|---|---|---|
| Volatility in Refrigerant Prices Amid HFC Phase-Down | -1.6% | United States, Canada, Mexico | Short term (≤ 2 years) |
| Power-Grid Constraints Delaying New Builds in Northern Virginia | -2.1% | United States (Northern Virginia) | Medium term (2-4 years) |
| Limited Skills for Immersion-Cooling Maintenance | -0.8% | United States and Canada | Medium term (2-4 years) |
| Insurance-Premium Surcharges for Water-Based Systems in Drought Zones | -0.7% | United States (Arizona, California, Nevada, Texas) | Long term (≥ 4 years) |
| Source: Mordor Intelligence | |||
Power-Grid Constraints Delaying New Builds in Northern Virginia
Dominion Energy’s transmission queue listed more than 7 GW of interconnection requests in January 2026, with average waits of 36 months for projects needing new substations. Underinvestment in 500 kV lines and local opposition to new corridors stall capacity expansions and force developers to explore backup generation or relocate to Ohio and North Carolina. Interim solutions such as hydrogen fuel cells add significant capital expense and trigger additional air-permit reviews. Some operators downsize footprints to fit within existing feeder headroom, fragmenting once-megasite-oriented investment plans. The congestion risk also elevates financing costs, as lenders price delays into required returns.
Volatility in Refrigerant Prices Amid HFC Phase-Down
The accelerated hydrofluorocarbon phase-down under the Kigali Amendment cuts North American production quotas for R-134a and R-410A by 10% each year through 2028, causing spot-market spikes that complicate budgeting. R-1234ze prices climbed from USD 45 per kg in early 2025 to USD 72 per kg by December as automotive demand absorbed supply. Chiller makers now offer dual-refrigerant units, but retrofits require technician retraining and lift project costs by up to 15%. Smaller colocation providers lacking hedging scale pass price swings through variable operating-expense reconciliations, eroding competitiveness versus integrated hyperscalers. Procurement uncertainty slows approvals for multi-year refresh programs, lengthening refresh cycles and deferring energy-efficiency gains.
*Our forecasts treat driver/restraint impacts as directional, not additive. The impact forecasts reflect baseline growth, mix effects, and variable interactions.
Segment Analysis
By Cooling Technology: Liquid Systems Capture AI Thermal Loads
Liquid-based approaches will grow at a 12.54% CAGR through 2031, far ahead of air methods that still dominated with 59.64% share in 2025. The North America data center cooling market size for liquid solutions is expanding as hyperscalers retrofit compute rows that now host GPUs drawing 40-80 kW per rack. Immersion baths in edge nodes solve space and acoustic limits, while direct-to-chip plates dominate large training clusters. Rear-door heat exchangers act as a bridge, extending the life of air-cooled halls and reducing capex burdens. HVAC vendors disclose multi-hundred-percent order growth for liquid skids, signaling a secular pivot rather than a niche experiment. Regulatory pushes for low-GWP refrigerants further encourage operators to bypass chillers altogether, relying on warm-water loops that reject heat through dry coolers.
The hybridization trend means both technologies will coexist. Operators segment halls by workload, dedicating liquid zones to AI while leaving storage and network gear on air cooling. This flexible approach protects prior investments and allows gradual skill-set development among facilities staff. Suppliers now bundle control software that orchestrates both regimes, shifting workloads to racks with the most favorable thermal headroom. As liquid penetration rises, aftermarket demand emerges for sensors, fittings, and quick-disconnect couplings, opening ancillary revenue pools. The North America data center cooling market continues to witness pilots that evaluate two-phase refrigerant loops, though commercial readiness may postdate the current forecast period.

By Cooling Component: Pumps And Valves Scale With Liquid Loops
Computer room air handlers held 40.72% share in 2025, reflecting the historical base of raised-floor halls across the region. Yet pumps and valves are projected to rise at a 12.66% CAGR, mirroring the liquid-technology surge. Modern loops require precision flow control; even slight imbalances can spike chip temperatures and throttle performance. Manufacturers respond with variable-speed pumps featuring embedded flow sensors and smart valves that auto-balance circuits in real time. Chillers remain the single largest line-item in capital projects, but their role shifts toward modularity, arriving on site in 500 kW blocks that match staged IT deployments.
Control software differentiates offerings as AI-driven platforms learn load patterns and pre-cool loops before inference bursts. Operators integrate these systems with workload schedulers so compute and cooling act as a unified efficiency engine. Hybrid dry-coolers cut water draw by 60-70%, aiding compliance in jurisdictions with withdrawal caps. Upstream component vendors enjoy pull-through sales as hyperscalers lock in multi-year contracts to guarantee supply continuity. The North America data center cooling market share for traditional air components will erode, but retrofit demand ensures an extended tail for replacement filters, belts, and economizer kits.
By Tier Type: Tier 4 Gains As Regulated Sectors Prioritize Uptime
Tier 3 sites delivered 52.82% share in 2025 because they balance 99.982% availability with acceptable capital intensity. Financial services and healthcare tenants now steer spending toward Tier 4, projected to grow at 12.83% CAGR, as emerging regulations impose steep penalties for downtime. Tier 4 cooling requires duplicated chillers, pumps, and distribution paths, adding USD 1,500-2,000 per kW, but eliminates single points of failure and shortens incident-recovery windows. Insurance carriers reward redundancy with lower premiums, narrowing the lifetime-cost differential.
Designers adopt phased-redundancy strategies that deploy extra capacity only when occupancy thresholds are met, protecting early cash flows. Standards bodies update frameworks such as ISO 22237 to clarify how liquid loops achieve N+1 or 2N equivalence, giving investors confidence that newer architectures still merit Tier 4 classification. The North America data center cooling market size for Tier 4 solutions is further buoyed by sovereign-AI initiatives that treat uninterrupted compute access as national critical infrastructure, channeling subsidies toward the highest-availability designs.
By Data Center Size: Hyperscale Facilities Drive Absolute Demand
Large data centers held 51.88% of the market share in 2025, but hyperscale campuses exceeding 100 MW will advance at a 12.36% CAGR through 2031. Economies of scale let cloud providers negotiate better pricing on pumps, heat exchangers, and chillers, and amortize R&D across vast portfolios. The North America data center cooling market benefits as hyperscalers pioneer heterogeneous halls, mixing liquid-cooled AI rows with air-cooled storage bays to optimize capital allocation. Zoned architectures save 18-22% on total cost over uniform designs, according to a 2025 white paper by Schneider Electric.
Medium-sized centers grow in secondary metros where land and power are cheaper, offering competitive latency for regional traffic. Small-footprint edge nodes remain essential for 5G densification and autonomous-vehicle telemetry, yet their limited scale often precludes advanced liquid deployment. Instead, these nodes adopt rear-door heat exchangers or micro evaporative coolers. Over the forecast window, hyperscale activity will dominate absolute equipment demand even as thousands of smaller sites proliferate.

By Data Center Type: Hyperscalers Internalize Cooling Innovation
Colocation providers secured 53.68% market share in 2025 because enterprises favor opex-based models that avoid capex lock-in. Hyperscalers are forecast to post a 12.74% CAGR by internalizing cooling R&D and vertically integrating component supply to protect gross margins on AI inference. Some cloud giants now own pump manufacturers and heat-exchanger fabs, compressing vendor margins and accelerating bespoke product cycles. The North America data center cooling industry responds with premium-priced liquid suites, allowing colocation operators to compete on performance metrics rather than square-foot pricing alone.
Digital Realty stated that liquid deployments across its North American footprint grew 320% year-over-year in 2025, driven by finance and life-science tenants. Colocation firms bundle direct-to-chip capacity at USD 150-250 per kW-month versus USD 80-120 for air space, justifying higher rents through energy savings and performance gains. Edge and enterprise sites adopt containerized modules that move where demand arises, guarding against stranded assets. The North America data center cooling market will therefore reflect a mosaic of ownership models, with innovation diffusing outward from hyperscalers to the broader ecosystem.
Geography Analysis
The United States dominated the North America data center cooling market with 79.83% share in 2025, fueled by hyperscale density in Northern Virginia, Phoenix, Dallas, and Silicon Valley. Federal sustainability mandates and generous tax credits accelerate the replacement of aged chillers with low-GWP units, while statewide water-withdrawal caps push operators toward closed-loop dry coolers. Grid congestion in Loudoun County lengthens project timelines, redirecting some new builds to Columbus and Raleigh, although these secondary hubs lack the deep interconnection ecosystems of established metros. A parallel wave of edge deployments supports 5G densification and autonomous-vehicle trials, favoring containerized solutions that can be sited in constrained urban parcels.
Canada, though smaller, claims strategic differentiation through waste-heat recovery programs. Provincial utilities in Ontario and Quebec pilot purchase agreements that monetize exhaust heat for district networks, offsetting 5-8% of annual opex and improving community acceptance. Cold ambient temperatures grant longer free-cooling windows, lowering energy spend and enhancing sustainability narratives. Data-sovereignty rules in finance and healthcare further buoy demand for Tier 3 and Tier 4 halls with fully redundant cooling. Hyperscalers eye Toronto and Montreal for expansion due to competitive electricity tariffs and renewable-power availability, aligning with corporate decarbonization goals.
Mexico is poised for the fastest 12.92% CAGR as nearshoring shifts manufacturing clusters closer to the U.S. border. Monterrey and Querétaro emerge as data-center nodes leveraging improving fiber backbones and competitive labor costs. Most early builds favor economizer-based air systems to conserve water in arid northern states, yet liquid uptake will rise when AI workloads migrate south to improve latency for Latin American users. Regulatory clarity on cross-border data flows remains a work in progress, but economic momentum from nearshoring and a growing digital middle class sustains investor interest. Collectively, these geographic currents keep the North America data center cooling market on a robust expansion trajectory.
Competitive Landscape
The North America data center cooling market is moderately fragmented. HVAC stalwarts such as Johnson Controls, Trane Technologies, and Carrier lean on installed-base relationships to preserve air-cooled revenue, while liquid specialists including Asetek, LiquidStack, and Iceotope win hyperscale tenders by pledging chip junction temperatures below 25 °C under continuous AI inference. Vertiv and Schneider Electric follow hybrid strategies, upgrading air-handler lines with liquid kits and acquiring start-ups for immersion IP. White-space opportunities arise in thermal storage and waste-heat monetization, attracting innovators that pair cooling with grid-services revenue.
Patent filings concentrate on microchannel cold plates and dielectric-fluid chemistry. Asetek holds foundational direct-to-chip IP and has enforced claims through licensing deals and litigation. Hyperscalers now design proprietary systems, bypassing OEMs and depressing margins for mid-tier vendors that lack comparable R&D budgets. This pressure triggers consolidation as larger firms acquire regional specialists to broaden service footprints. Supplier negotiations increasingly bundle multi-year spares and fluid contracts, recognizing that downtime penalties for AI clusters far exceed hardware costs.
Insurance trends also shape the field. Underwriters impose 8-12% premium surcharges on water-based systems in drought states, nudging demand toward dry coolers and sealed liquid loops. Vendors respond with products certified for low water risk, using epoxied coils and redundant leak-detection sensors. Meanwhile, district-heat partnerships in Canada open an ancillary revenue channel, prompting some equipment makers to add heat-pump modules that upgrade rejected heat to residential supply temperatures. Competitive dynamics therefore hinge not only on thermodynamics but also on regulatory foresight, water stewardship, and grid strategy.
North America Data Center Cooling Industry Leaders
Vertiv Group Corp.
Stulz GmbH
Schneider Electric SE
Rittal GmbH & Co. KG
Asetek A/S
- *Disclaimer: Major Players sorted in no particular order

Recent Industry Developments
- January 2026: Schneider Electric won a USD 200 million contract for an Arizona hyperscale campus that pairs direct-to-chip cooling with adiabatic dry coolers expected to achieve sub-1.15 PUE.
- December 2025: Asetek partnered with a major server OEM to integrate cold plates into next-generation AI servers shipping in Q2 2026.
- November 2025: LiquidStack closed a USD 50 million Series C round led by a sovereign fund to scale immersion-cooling production in North America.
- October 2025: Johnson Controls introduced variable-speed chillers using R-1234ze refrigerant, available in modular 500 kW blocks.


North America Data Center Cooling Market Report Scope
The equipment, tools, methods, and procedures used to maintain an ideal operating temperature inside a data center building are collectively referred to as data center cooling. There is a growing need for energy-efficient cooling of IT equipment mainly due to the increased capacity and higher data density. In addition, advantages provided by technology and government support by imposing efficiency rules for data centers are anticipated to directly contribute to developing the data center cooling market in several applications, including IT, BFSI, telecommunication, etc.
The North America Data Center Cooling Market Report is Segmented by Cooling Technology (Air-Based, and Liquid-Based), Cooling Component (CRAH/CRAC, Chillers and Heat Exchangers, Cooling Towers and Dry Coolers, Pumps and Valves, and Control and Monitoring Software), Tier Type (Tier 1 and 2, Tier 3, and Tier 4), Data Center Size (Small, Medium, Large, and Hyperscale), Data Center Type (Colocation, Hyperscalers/CSPs, and Enterprise and Edge), and Country (United States, Canada, Mexico). The Market Forecasts are Provided in Terms of Value (USD).
By Cooling Technology
| Air-Based Cooling | CRAH |
| Chiller and Economizer | |
| Cooling Tower (Direct, Indirect, Two-Stage) | |
| Others | |
| Liquid-Based Cooling | Immersion Cooling |
| Direct-to-Chip Cooling | |
| Rear-Door Heat Exchanger |
By Cooling Component
| Computer-Room Air Handlers (CRAH/CRAC) |
| Chillers and Heat-Exchanger Units |
| Cooling Towers and Dry Coolers |
| Pumps and Valves |
| Control and Monitoring Software |
By Tier Type
| Tier 1 and 2 |
| Tier 3 |
| Tier 4 |
By Data Center Size
| Small Data Center |
| Medium Data Center |
| Large Data Center |
| Hyperscale Data Center |
By Data Center Type
| Colocation Data Center |
| Hyperscalers Data Center/CSPs |
| Enterprise and Edge Data Center |
By Country
| United States |
| Canada |
| Mexico |
| By Cooling Technology | Air-Based Cooling | CRAH |
| Chiller and Economizer | ||
| Cooling Tower (Direct, Indirect, Two-Stage) | ||
| Others | ||
| Liquid-Based Cooling | Immersion Cooling | |
| Direct-to-Chip Cooling | ||
| Rear-Door Heat Exchanger | ||
| By Cooling Component | Computer-Room Air Handlers (CRAH/CRAC) | |
| Chillers and Heat-Exchanger Units | ||
| Cooling Towers and Dry Coolers | ||
| Pumps and Valves | ||
| Control and Monitoring Software | ||
| By Tier Type | Tier 1 and 2 | |
| Tier 3 | ||
| Tier 4 | ||
| By Data Center Size | Small Data Center | |
| Medium Data Center | ||
| Large Data Center | ||
| Hyperscale Data Center | ||
| By Data Center Type | Colocation Data Center | |
| Hyperscalers Data Center/CSPs | ||
| Enterprise and Edge Data Center | ||
| By Country | United States | |
| Canada | ||
| Mexico | ||


Key Questions Answered in the Report
How large will the North America data center cooling market be by 2031?
It is forecast to reach USD 13.58 billion by 2031, expanding at an 11.17% CAGR over 2026-2031.
Which cooling technology is growing fastest?
Liquid-based methods, including direct-to-chip and immersion systems, are projected to grow at a 12.54% CAGR through 2031.
Why are Tier 4 facilities gaining traction?
Financial services and healthcare firms need higher fault tolerance, driving Tier 4 cooling demand at a 12.83% CAGR despite higher capital costs.
What limits new builds in Northern Virginia?
Transmission-grid congestion forces developers to face 36-month interconnection delays, pushing some projects to Ohio and North Carolina.
How do state water caps influence cooling choices?
In drought-prone Arizona and California, operators favor closed-loop dry coolers, cutting evaporative losses and meeting regulatory mandates.
Page last updated on:


