Market Overview
| Study Period | 2020 - 2031 |
|---|---|
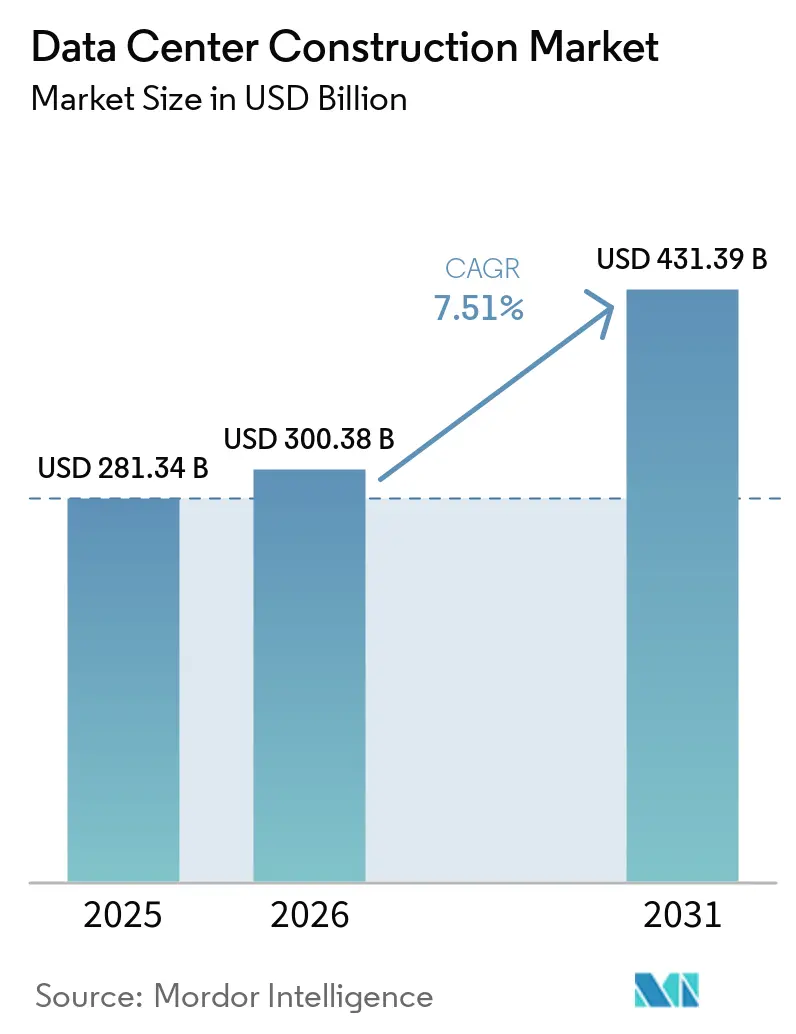
| Market Size (2026) | USD 300.38 Billion |
| Market Size (2031) | USD 431.39 Billion |
| Growth Rate (2026 - 2031) | 7.51% CAGR |
| Fastest Growing Market | Asia Pacific |
| Largest Market | North America |
| Market Concentration | Medium |
Major Players *Disclaimer: Major Players sorted in no particular order Image © Mordor Intelligence. Reuse requires attribution under CC BY 4.0. | |
Data Center Construction Market Analysis by Mordor Intelligence
The Data Center Construction Market size is expected to grow from USD 281.34 billion in 2025 to USD 300.38 billion in 2026 and is forecast to reach USD 431.39 billion by 2031 at 7.51% CAGR over 2026-2031.
Surging demand for sovereign-grade compute infrastructure, the rapid rollout of 40 kW–100 kW AI racks, and capital-intensive grid-deposit rules are the decisive forces lifting industry outlays. Developers are prioritizing liquid-cooling expertise, on-site power generation, and powered-land inventory to shave months off delivery schedules. At the same time, mechanical systems are absorbing a rising share of budgets as operators race to meet tightening power-usage-effectiveness thresholds. Competitive intensity is increasing as construction-management majors, colocation landlords, and edge specialists battle for hyperscale contracts that now dominate the data center construction market.
Key Report Takeaways
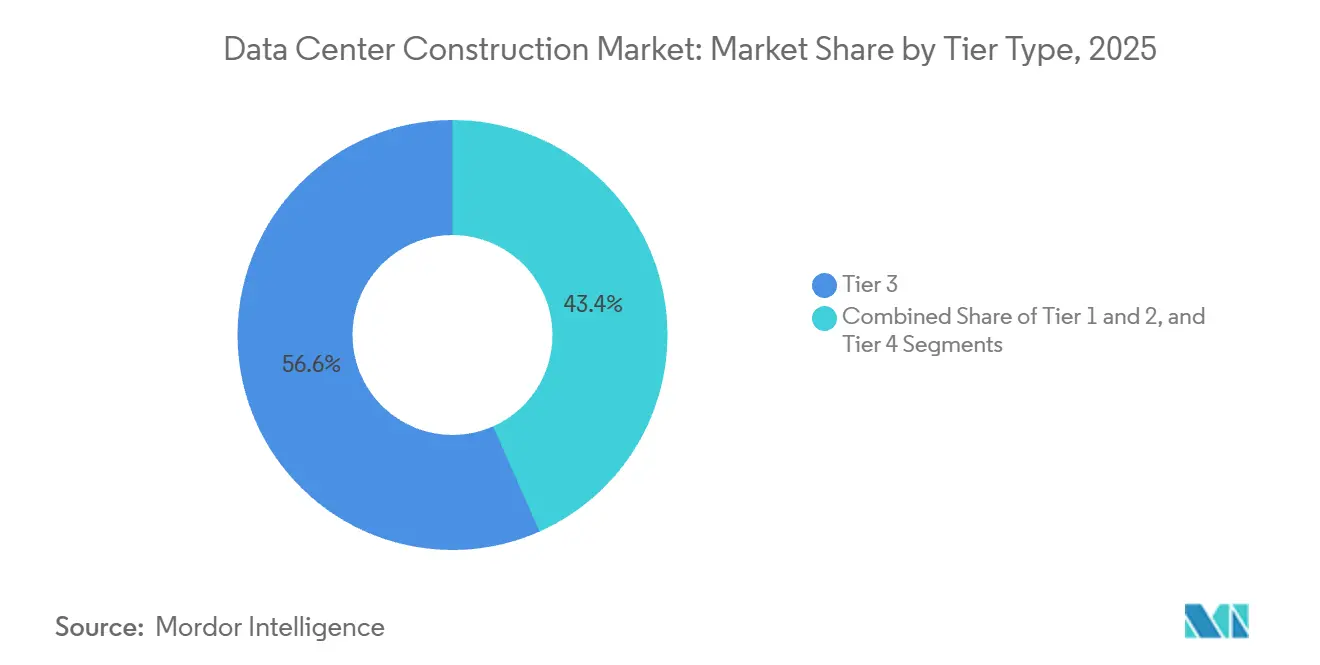
- By tier type, tier 3 facilities led with 56.64% installations in 2025, while tier 4 builds are expanding at an 8.12% CAGR through 2031.
- By data center size, hyperscale campuses accounted for 58.49% of floor space in 2025 and are advancing at an 8.67% CAGR through 2031.
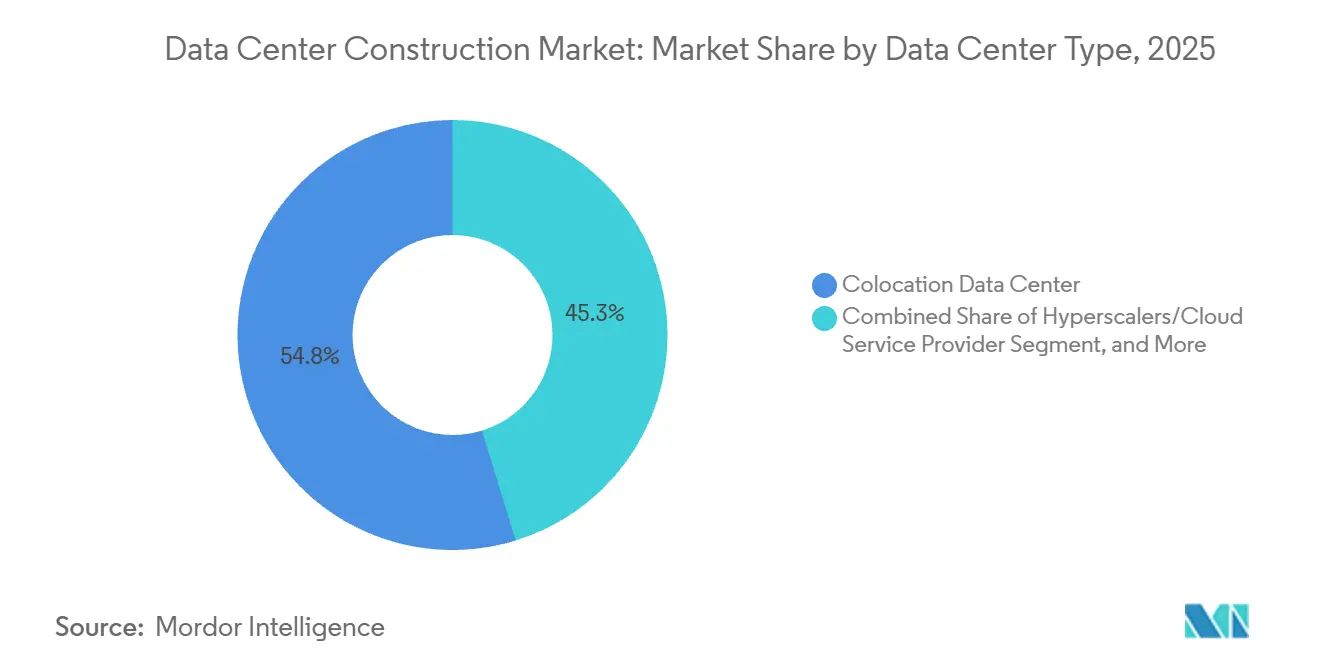
- By data-center type, colocation operators accounted for 54.75% of revenue in 2025, whereas hyperscalers are growing at a 9.12% CAGR through 2031.
- By infrastructure category, electrical systems accounted for 39.95% of 2025 budgets, yet mechanical systems are growing at a 9.31% CAGR through 2031.
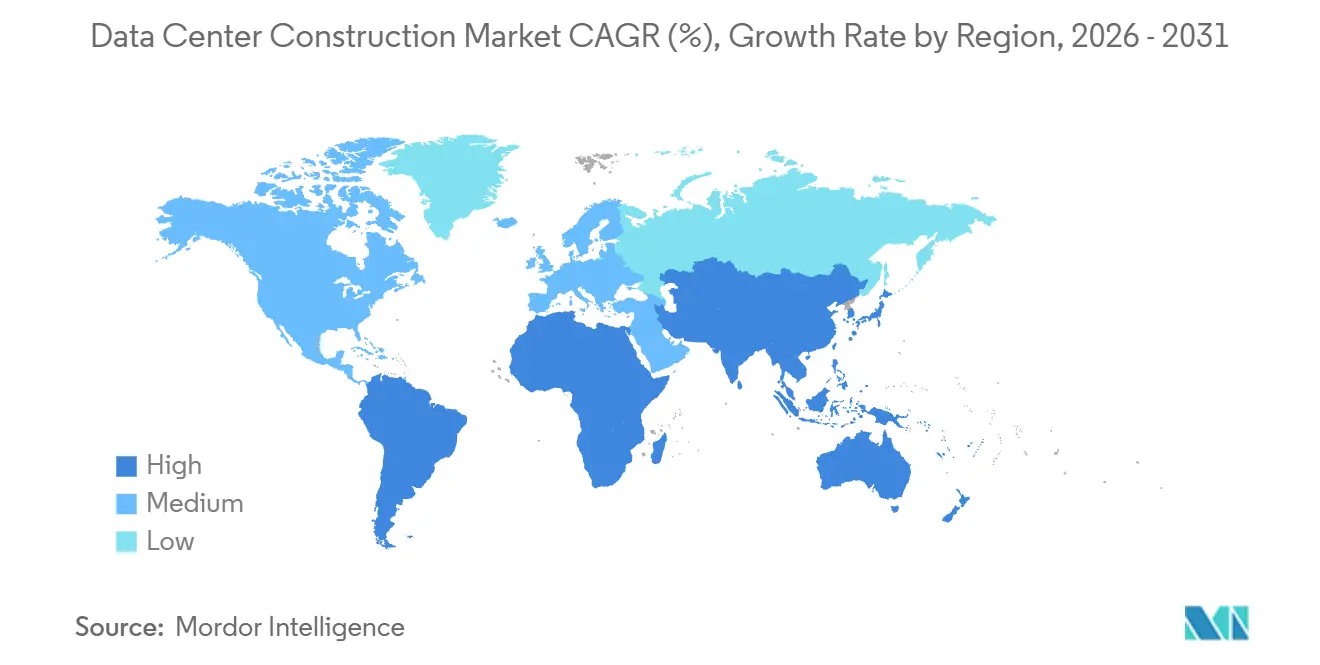
- By geography, North America held a 40.65% share in 2025; Asia-Pacific is projected to post the fastest 9.71% CAGR to 2031.
Note: Market size and forecast figures in this report are generated using Mordor Intelligence’s proprietary estimation framework, updated with the latest available data and insights as of January 2026.
Global Data Center Construction Market Trends and Insights
Drivers Impact Analysis*
| Driver | (~) % Impact on CAGR Forecast | Geographic Relevance | Impact Timeline |
|---|---|---|---|
| Deployment of On-Site Small Modular Reactors | +1.8% | North America, Europe, APAC | Long term (≥ 4 years) |
| Growing Cloud Applications, AI, and Big Data | +1.5% | Global, concentrated in North America and APAC | Short term (≤ 2 years) |
| Accelerating Adoption of Hyperscale Facilities | +1.3% | North America, Europe, APAC | Medium term (2-4 years) |
| Emergence of Powered-Land Speculative Campuses | +1.2% | United States Midwest, Nordics | Medium term (2-4 years) |
| Rising Edge-Computing Build-Outs | +0.9% | Global metro hubs | Short term (≤ 2 years) |
| Renewable-Energy Mandates Shaping Design | +0.8% | Europe, United States West Coast, APAC | Medium term (2-4 years) |
| Source: Mordor Intelligence | |||


Deployment of On-Site Small Modular Reactors to Bypass Grid Constraints
Developers increasingly view small modular reactors as the only carbon-free option capable of delivering gigawatt-scale baseload within competitive timelines. Google’s 500 MW Kairos Power deal signed in 2024 enables delivery before 2030 and circumvents seven-year interconnection queues. In 2025, Westinghouse and Data4 advanced a plan to co-locate AP300 units at French campuses, cutting transmission losses and insulating operators from volatile day-ahead power markets. Federal support is widening; the U.S. Department of Energy earmarked USD 900 million toward streamlined licensing, trimming the typical decade-long approval slog.[1]Publication Staff, “Generation III+ Small Modular Reactor Program Funding Announcement,” U.S. Department of Energy, energy.gov The constraint is fuel because annual high-assay low-enriched uranium capacity supports fewer than ten commercial reactors. Consequently, only hyperscalers with deep pockets and in-house nuclear teams can underwrite parallel fuel and reactor procurement, reinforcing their edge in the data center construction market.
Growing Cloud Applications, AI and Big Data Workloads
Generative-AI and analytics clusters now demand 40 kW–100 kW per rack, a jump that quadruples traditional thermal loads. OpenAI’s 500 MW Michigan build, announced in 2025, pairs custom substations with battery buffers to ride out grid fluctuations. Microsoft’s USD 80 billion capital plan channels 60% toward data-center builds, underscoring the strategic priority of owning AI infrastructure. Traffic unpredictability at scale is steering providers away from 2 MW edge pods toward 50 MW–200 MW hyperscale campuses, where spare headroom absorbs inference spikes without latency penalties. Yet talent scarcity looms; two-thirds of operators struggled in 2025 to hire technicians capable of commissioning direct-to-chip and immersion loops. Contractors that secure cooling-system integrators early often beat rivals to market by up to a year, a decisive advantage in the data center construction market.
Accelerating Adoption of Hyperscale Facilities
State governments are handing out tax abatements and frozen utility rates to capture multi-gigawatt campuses anchoring regional growth. Vantage committed USD 25 billion to a Texas mega-site in 2025 spanning 2 000 acres and delivering 2 GW IT load, the industry’s largest single project. Meta broke ground on a 900 MW Wisconsin facility leveraging nearby hydropower to meet its 100% renewable-energy goal. Such builds funnel capital into corridors with cheap energy, though PJM’s interconnection queue ballooned to 270 GW in 2025, requiring 20% deposits long before construction. Smaller colocation firms cannot absorb these costs, yielding hyperscale market share to cloud titans.
Emergence of Powered-Land Speculative Campuses Shortening Pre-Lease Timelines
Powered-land developers pre-install substations, fiber laterals, and zoning clearances, allowing tenants to break ground 90 days after signing rather than waiting two years for utility approvals. A 400-acre Kansas campus energized 500 MW capacity in 2025 under this model. Norway replicated the approach by pre-wiring 1 000 MW of hydro capacity across three sites. While the strategy shifts capital risk to landholders, early movers that anticipate tenant needs command premiums. An Oklahoma powered-land parcel failed to attract bids after local utilities refused fiber extensions, illustrating that power alone is insufficient.
Restraints Impact Analysis*
| Restraint | (~) % Impact on CAGR Forecast | Geographic Relevance | Impact Timeline |
|---|---|---|---|
| Escalating Real Estate, Installation and Maintenance Costs | -1.4% | Northern Virginia, Frankfurt, Singapore, Sydney, London | Short term (≤ 2 years) |
| Utility Take-Or-Pay Deposits Locking Up Capital | -1.1% | United States PJM, ERCOT, Europe core | Medium term (2-4 years) |
| Shortage Of Skilled Labor for Advanced Liquid Cooling | -1.0% | North America, Western Europe, Singapore, Australia | Short term (≤ 2 years) |
| Stricter Energy-Consumption and Carbon-Compliance Limits | -0.8% | Europe, California, Washington, Singapore, Australia | Medium term (2-4 years) |
| Source: Mordor Intelligence | |||
Escalating Real-Estate, Installation and Maintenance Cost
Transformer lead times doubled and copper prices surged between 2023 and 2025, pushing total project costs up 15%–25%. Northern Virginia acreage climbed to USD 1 million–USD 2 million, redirecting developers to Ohio and the Carolinas where fiber delays offset cheaper land. Electricians qualified for 480-V busways now earn USD 120 000–USD 150 000. Mechanical upgrades required for AI racks add USD 200–USD 400 per kW, inflating capital budgets. Colocation landlords locked into pre-inflation leases face margin compression below the 25% threshold needed to service construction debt.
Utility Take-or-Pay Deposits Locking Up Capital and Deterring Mid-Tier Developers
Grid operators now require non-refundable deposits equal to 20% of total project cost, ranging from USD 50 million to USD 200 million, before queuing interconnection studies.[2]Publication Staff, “2025 Generation Interconnection Queue Status Report,” PJM Interconnection, pjm.com ERCOT adopted similar rules in 2025, requiring USD 100 million for projects above 500 MW. These policies favor hyperscalers with deep balance sheets and crowd out mid-tier players, accelerating consolidation. Many regional builders pivot to sub-10 MW edge sites that bypass costly grid studies, reshaping capacity distribution.
*Our forecasts treat driver/restraint impacts as directional, not additive. The impact forecasts reflect baseline growth, mix effects, and variable interactions.
Segment Analysis
By Tier Type: Fault-Tolerant Tier 4 Builds Gain Traction
Tier 3 assets commanded 56.64% of installations in 2025. Tier 4 builds are scaling at an 8.12% CAGR as financial-services and healthcare buyers demand fault-tolerant uptime. A 2025 study pegged unplanned-outage costs at USD 9 000 per minute, justifying Tier 4 premiums. [3]Publication Staff, “Cost of Data Center Outages Study 2025,” Ponemon Institute, ponemon.org Dual utility feeds limit suitable sites to hubs such as Northern Virginia, Frankfurt, and Singapore. Retrofit projects often add USD 50 million to USD 100 million to budgets originally scoped for electrical work alone. Smaller providers continue marketing Tier 3 infrastructure with contractual workarounds that mask the absence of true fault tolerance.
Heightened Tier 4 interest is shifting supply-chain dynamics. Switchgear and chiller vendors prioritize quick-ship inventories for fault-tolerant projects, accelerating lead times by up to three months. Designers increasingly specify modular electrical rooms to speed commissioning, while owners weigh whether to convert Tier 2 sites or exit them entirely.


By Data Center Size: Hyperscale Dominance Reshapes Supply Chains
Hyperscale campuses held 58.49% of floor space in 2025 and are pushing forward at an 8.67% CAGR. Microsoft allocated USD 80 billion for capital expenditures, with the majority aimed at 50 MW–200 MW builds. Medium builds of 30 MW–50 MW are increasingly delivered as shells energized in 10 MW increments to align capital with lease uptake.
Edge sites under 5 MW prosper near city cores where latency under 10 milliseconds is mandatory for AR/VR and trading workloads. Hyperscale procurement drives global pricing for transformers and immersion tanks, frequently squeezing availability for regional projects. Enterprises, facing higher capex, often opt to migrate workloads to the cloud instead of upgrading on-premise footprints.
By Data Center Type: Hyperscalers Outpace Colocation Growth
Although colocation generated 54.75% of 2025 revenue, hyperscalers are advancing at a 9.12% CAGR through 2031. Equinix and Digital Realty now lease whole buildings to single tenants, pivoting toward wholesale deals. This trend highlights the growing demand for scalable and dedicated data center solutions.
Vertical integration allows hyperscalers to self-perform mechanical and electrical trades, trimming per-kW build costs by 20%–30%. Edge data centers of 1 MW–5 MW fill a latency niche that exurban campuses cannot meet. Vapor IO deployed 50 U.S. nodes in 2025 using existing central offices, cutting capex but ceding some control over infrastructure.
By Infrastructure: Mechanical Systems Outpace Electrical Spend
Electrical systems accounted for 39.95% of 2025 project budgets. Mechanical investments are climbing at a 9.31% CAGR as rack densities breach 10 kW. Direct-to-chip cooling adds USD 200–USD 400 per kW but lowers ongoing electricity bills by up to 40%. This shift is expected to drive further innovation in cooling technologies.
Rear-door exchangers and immersion tanks enable 100 kW cabinets within existing footprints, extending site lifecycles. Cabinet vendors introduced 60U frames with integrated dripless connectors in 2025. Service providers now sell commissioning packages that guarantee PUE below 1.2 to comply with California Title 24 requirements.
Geography Analysis
North America added 5 GW of capacity in 2025 across Virginia, Texas, and Ohio. Microsoft, Meta, and Google together committed USD 150 billion toward U.S. builds through 2027. Canada’s hydro-rich Quebec and British Columbia attract hyperscalers seeking low-carbon power. Mexico’s Monterrey and Querétaro clusters grow on cross-border fiber, though grid reliability remains a concern. California’s Title 24 now caps PUE at 1.2, effectively banning air-cooled designs.
Europe’s pipeline centers on Frankfurt, Amsterdam, and London where land hits USD 6 000 per m². Germany’s Renewable Energy Sources Act pushes developers toward on-site solar and batteries. Brexit-driven data sovereignty boosts Tier 4 demand in London and Manchester. France and Spain entice hyperscale projects with tax incentives, though southern grids face capacity shortfalls. The Corporate Sustainability Reporting Directive, effective 2025, forces Scope 3 carbon disclosures.
Asia-Pacific posts the fastest growth. Chinese state-owned utilities back 2 GW campuses despite export-control limits on AI chips. India expands at double-digit rates as foreign hyperscalers localize to meet data-residency rules. Singapore’s land scarcity drives 30 kW-plus rack densities with liquid cooling standard. South Korea, Australia, and New Zealand attract edge nodes for gaming and streaming. Japan’s aging grid imposes multiyear interconnection delays, nudging demand offshore.
The Middle East and Africa emerge as new hubs. Saudi Arabia’s NEOM allocates 1 GW data-center capacity within a USD 500 billion smart-city plan. Dubai and Abu Dhabi offer tax-free zones and expedited permits aimed at intercontinental colocation. Submarine cables linking Europe and Asia elevate Turkey and Israel as low-latency transit nodes. South Africa, Nigeria, and Egypt see edge build-outs tied to 5G rollouts and cloud gaming.

Competitive Landscape
The market is moderately concentrated. Turner, DPR, and AECOM lock in design-build contracts 24 months before groundbreaking, compressing procurement by up to nine months. Equinix and Digital Realty self-perform mechanical and electrical trades, preserving 15%–20% margins. This approach allows these companies to maintain better control over project timelines and costs.
Vapor IO places 1 MW–5 MW modules within 10 miles of urban cores, achieving sub-10 ms latency. Powered-land developers like PowerTransitions pre-energize acreage to cut tenant move-in to 90 days. Operators achieving PUE below 1.15 through direct-to-chip cooling save USD 2 million–USD 5 million annually per 10 MW site. Schneider Electric filed 12 modular UPS patents in 2025.
Digital Realty’s 150 MW Virginia campus will integrate NuScale reactors, bypassing a seven-year PJM queue. Keppel Data Centres and Sembcorp plan a 200 MW Singapore site powered by offshore wind, targeting PUE under 1.1. Skanska secured a USD 900 million Ohio contract leveraging low-cost transitional gas power. Strategic moves in 2025 indicate consolidation and regional depth building across the data center construction market.
Data Center Construction Industry Leaders
AECOM
Turner Construction Co.
DPR Construction
Jacobs Solutions Inc.
Skanska AB
- *Disclaimer: Major Players sorted in no particular order


Recent Industry Developments
- January 2026: Equinix announced a USD 15 billion plan for 25 new International Business Exchange facilities across Europe and Asia-Pacific through 2028.
- December 2025: Digital Realty broke ground on a 150 MW Northern Virginia campus featuring NuScale small modular reactors and direct-to-chip cooling for 100 kW racks.
- November 2025: NTT Global Data Centers acquired three Mumbai and Bangalore sites for USD 800 million, lifting its India footprint to 200 MW.
- October 2025: Turner Construction secured a USD 1.2 billion design-build contract for a 300 MW Texas hyperscale campus with 500 MW on-site solar.


Research Methodology Framework and Report Scope
Market Definitions and Key Coverage
Mordor Intelligence defines the data center construction market as the total value of greenfield builds that combine civil works, electrical and mechanical fit-outs, and embedded services needed to deliver an operational facility that can house IT infrastructure. Activity tied only to IT equipment procurement or ongoing facility maintenance is outside this boundary.
Scope Exclusion: Retrofits and cosmetic upgrades of existing data centers are not counted.
Segmentation Overview
- By Tier Type
- Tier 1 and 2
- Tier 3
- Tier 4
- By Data Center Size
- Small
- Medium
- Large
- Hyperscale
- By Data Center Type
- Colocation Data Center
- Hyperscalers/Cloud Service Provider (CSPs)
- Enterprise and Edge Data Center
- By Infrastructure
- Electrical Infrastructure
- Power Distribution Solution
- Power Backup Solutions
- Mechanical Infrastructure
- Cooling Systems
- Racks and Cabinets
- Servers and Storage
- Other Mechanical Infrastructure
- General Construction
- Services - Design and Consulting, Integration, Support and Maintenance
- Electrical Infrastructure
- By Geography
- North America
- United States
- Canada
- Mexico
- South America
- Brazil
- Argentina
- Rest of South America
- Europe
- Germany
- United Kingdom
- France
- Italy
- Spain
- Rest of Europe
- Asia-Pacific
- China
- Japan
- India
- South Korea
- Australia and New Zealand
- Rest of Asia-Pacific
- Middle East and Africa
- Middle East
- Gulf Cooperation Countries
- Turkey
- Israel
- Rest of Middle East
- Africa
- South Africa
- Egypt
- Nigeria
- Rest of Africa
- Middle East
- North America
Detailed Research Methodology and Data Validation
Primary Research
We interviewed project managers at design-build firms, procurement heads at colocation operators in North America, Europe, and India, plus regional permitting consultants. These discussions clarified real build cost per megawatt, grid connection delays, and liquid cooling adoption, letting us fine-tune assumptions uncovered during desk work.
Desk Research
Our analysts first mapped global construction outlays using freely available sources such as the U.S. Census 'Value of Construction Put in Place,' Eurostat building permits, and the Japan MLIT construction statistics. Trade flows for gensets and UPS units were checked through UN Comtrade, while the Uptime Institute Global Data Center Survey and AFCOM State of the Data Center reports offered demand benchmarks. Company filings, contractor 10-Ks, and regional permitting portals then anchored project pipelines. Select paid datasets, including D&B Hoovers for contractor revenues and Dow Jones Factiva for deal news, filled remaining gaps. This list is illustrative, not exhaustive; many additional publications guided validation.
A second pass pulled price indices from the BLS Producer Price Index (electrical gear) and the IMF's metal cost trackers to calibrate cost escalation so our desk findings stayed grounded in current realities.
Market-Sizing & Forecasting
A top-down model starts with non-residential construction spending and hyperscale capital expenditures, which are then filtered through data center specific penetration ratios. Results are cross-checked bottom up with sampled cost per MW multiplied by announced capacity additions to test reasonableness. Key variables include average build cost per MW, global hyperscale CAPEX, rack density trends, transformer lead times, and regional electricity pricing. Multivariate regression coupled with scenario analysis projects values to 2030, with gaps in bottom up samples bridged by regional cost curves derived from primary interviews.
Data Validation & Update Cycle
Outputs pass a three-layer review: automated variance flags, senior analyst peer checks, and a final reconciliation against new permits and CAPEX disclosures. Mordor refreshes every twelve months and re-contacts experts when material events, policy shifts, and major supply chain shocks arise.
Why Mordor's Data Center Construction Baseline Commands Reliability
Published figures can diverge because providers choose different cost baskets, treat mixed-use campuses inconsistently, or lock forecasts to static ASPs. Our disciplined scope selection and yearly refresh reduce those pitfalls.
Key gap drivers include: some studies omit general construction labor; others freeze cost inflation at historical averages; a few exclude edge or self-built hyperscale projects outside North America. Mordor captures all of these elements and validates currency conversions quarterly.
Benchmark comparison
| Market Size | Anonymized source | Primary gap driver |
|---|---|---|
| USD 281.34 B (2025) | Mordor Intelligence | |
| USD 240.97 B (2024) | Global Consultancy A | Narrower infrastructure scope and static cost indices |
| USD 239.00 B (2025) | Industry Journal B | Excludes general construction labor, uses fixed ASP per MW |
| USD 182.51 B (2025) | Regional Consultancy C | Limited Asia Pacific coverage and outdated hyperscale CAPEX |
Taken together, the comparison shows that Mordor's numbers rest on the broadest cost base, live cost escalators, and multi-region coverage, giving decision makers a transparent and repeatable baseline they can trust.


Key Questions Answered in the Report
How fast is spending on new facilities expected to grow through 2031?
Outlays are forecast to expand at a 7.51% CAGR, rising from USD 300.38 billion in 2026 to USD 431.39 billion in 2031.
Which size category adds the most square footage today?
Hyperscale campuses held 58.49% of global floor space in 2025 and are advancing at an 8.67% CAGR, the fastest among all size classes.
Why are Tier 4 builds receiving more attention?
Financial-services and healthcare clients demand fault-tolerant uptime, driving an 8.12% CAGR for Tier 4 facilities despite their 40%-60% capital premium.
What is the primary power challenge facing new projects?
Grid operators now require non-refundable deposits equal to 20% of project cost, locking up USD 50 million-USD 200 million for up to three years.
How are developers meeting stringent energy-efficiency targets?
Many new builds use direct-to-chip or immersion cooling and on-site renewables, enabling sub-1.2 PUE compliance with rules such as California Title 24.
Which regions are emerging beyond the core U.S. and European hubs?
India, Singapore, Saudi Arabia, and the Pacific Northwest show accelerating activity due to favorable power prices, permitting, and local digital-economy growth.
Page last updated on:


