India Data Center Cooling Market Size and Share
Market Overview
| Study Period | 2020 - 2031 |
|---|---|
| Forecast Data Period | 2026 - 2031 |
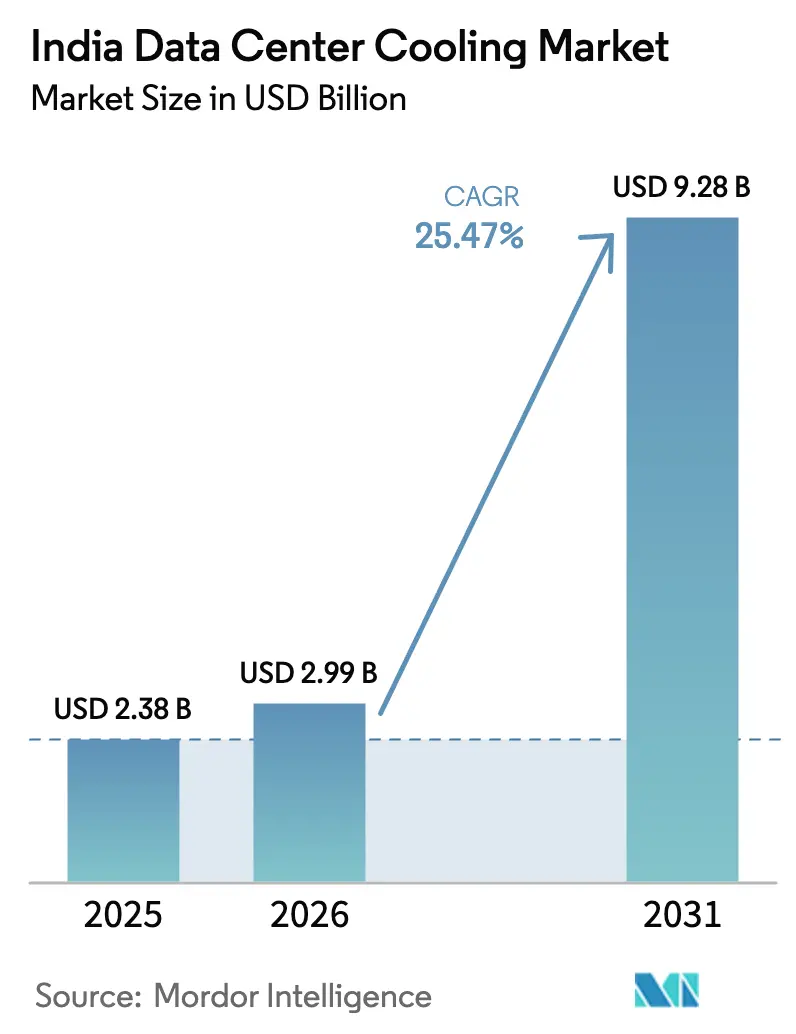
| Base Year Market Size (2025) | USD 2.38 Billion |
| Market Size (2026) | USD 2.99 Billion |
| Market Size (2031) | USD 9.28 Billion |
| Growth Rate (2026 - 2031) | 25.47% CAGR |
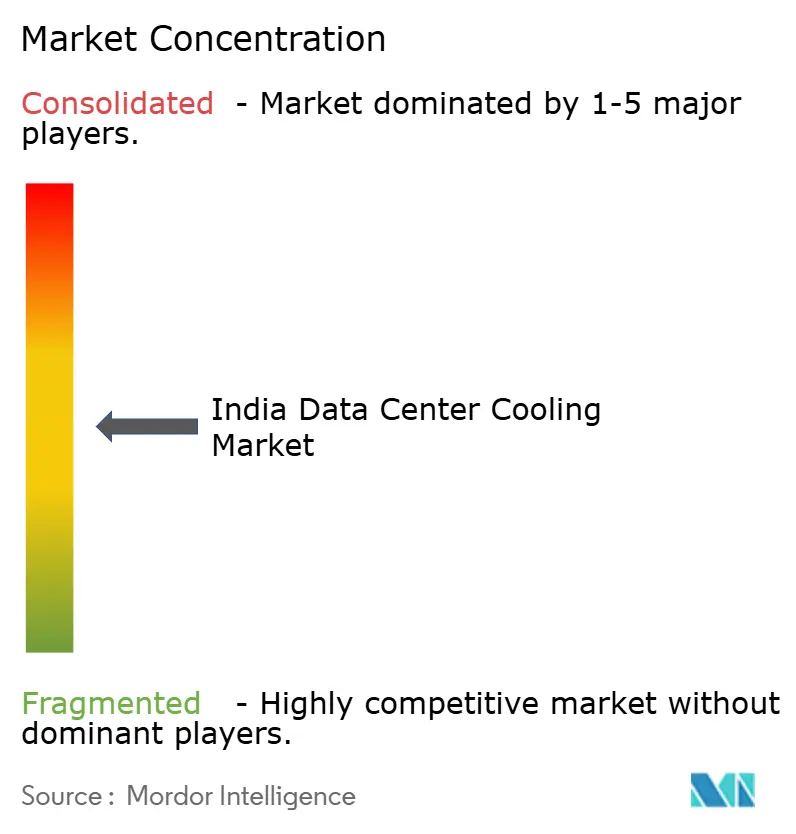
| Market Concentration | Medium |
Major Players *Disclaimer: Major Players sorted in no particular order Image © Mordor Intelligence. Reuse requires attribution under CC BY 4.0. | |
India Data Center Cooling Market Analysis by Mordor Intelligence
India data center cooling market size in 2026 is estimated at USD 2.99 billion, growing from 2025 value of USD 2.38 billion with 2031 projections showing USD 9.28 billion, growing at 25.47% CAGR over 2026-2031. Sustained hyperscale cloud build-outs, data-sovereignty mandates, and large-scale government digital programs are the primary growth catalysts for the India data center cooling market. Cooling demand is intensifying as rack densities cross the 15 kW threshold, prompting rapid evaluation of liquid-based solutions alongside incremental upgrades to traditional air-cooling assets. Policy-led incentives that streamline land acquisition and renewable power sourcing strengthen project economics, while escalating carbon-pricing deadlines reinforce the business case for high-efficiency systems. Vendors that combine hardware, software, and lifecycle services are gaining traction because operators seek predictable performance, reduced downtime risk, and measurable energy savings across multi-site portfolios.
Key Report Takeaways
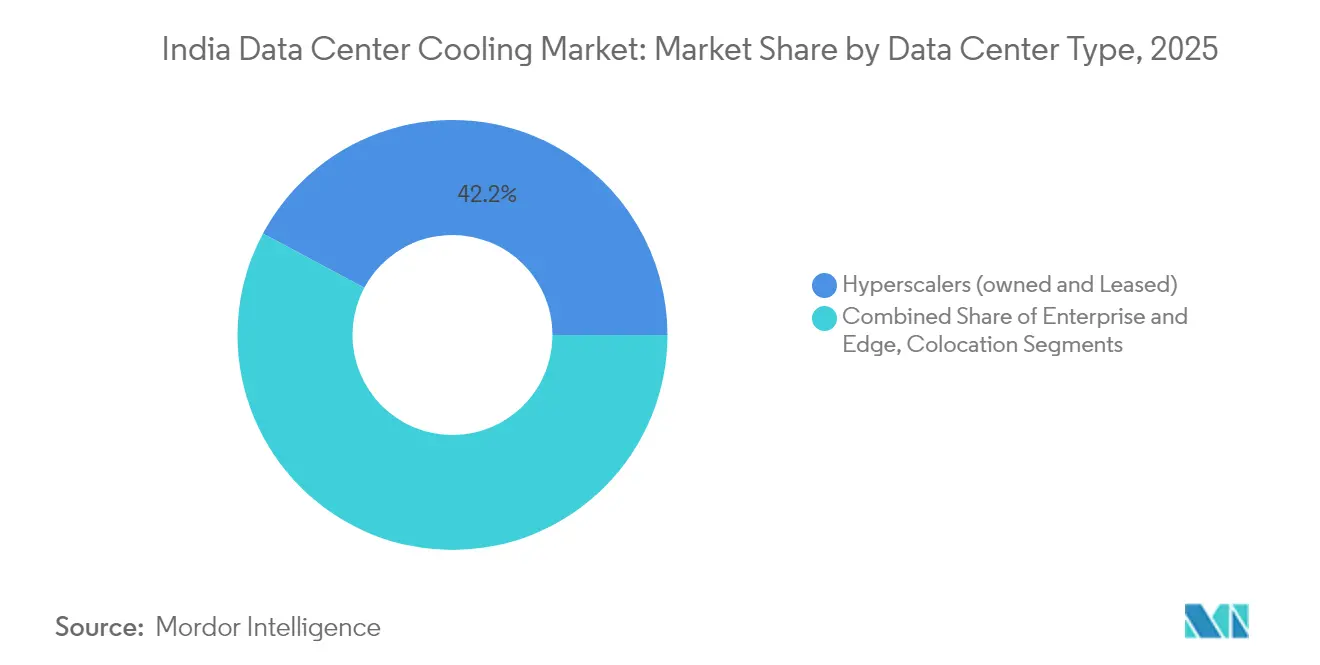
- By data center type, hyperscalers led with 42.18% of India data center cooling market share in 2025 and are expanding at a 25.78% CAGR to 2031.
- By tier classification, Tier 3 facilities commanded 62.85% share of the India data center cooling market size in 2025, while Tier 4 facilities are projected to grow at 26.88% CAGR through 2031.
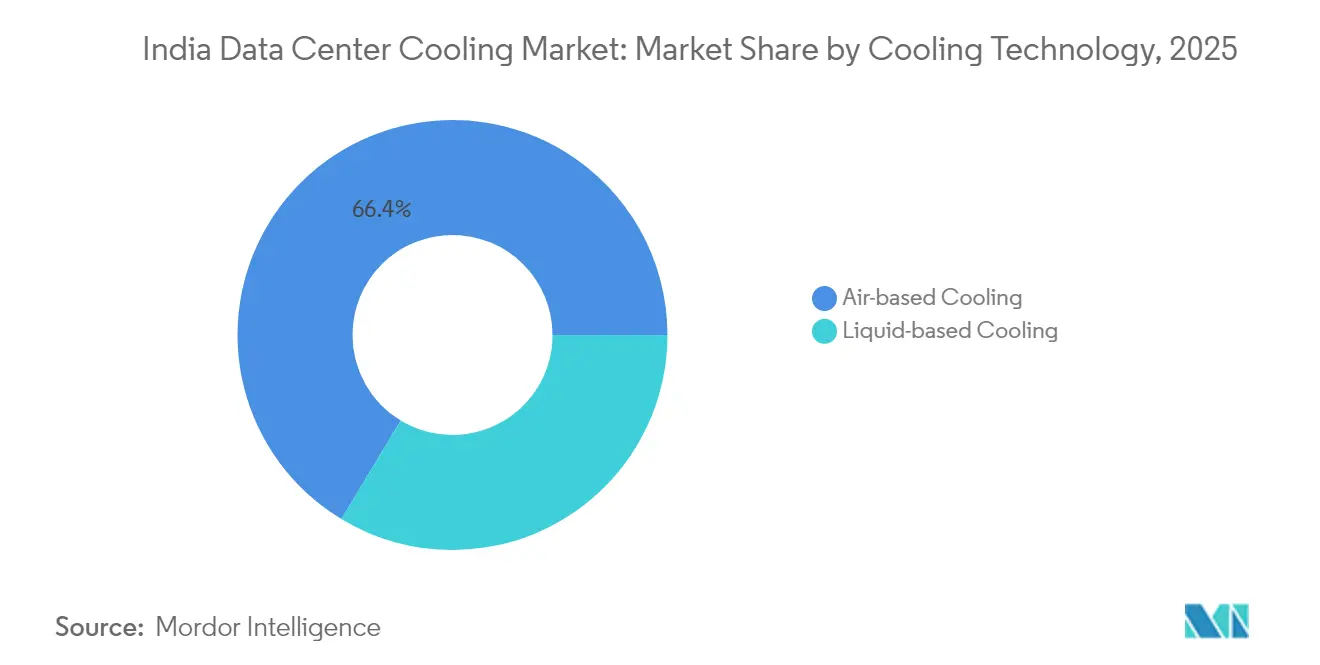
- By cooling technology, air-based solutions held 66.35% revenue share in 2025; liquid solutions represent the fastest growth at 27.34% CAGR.
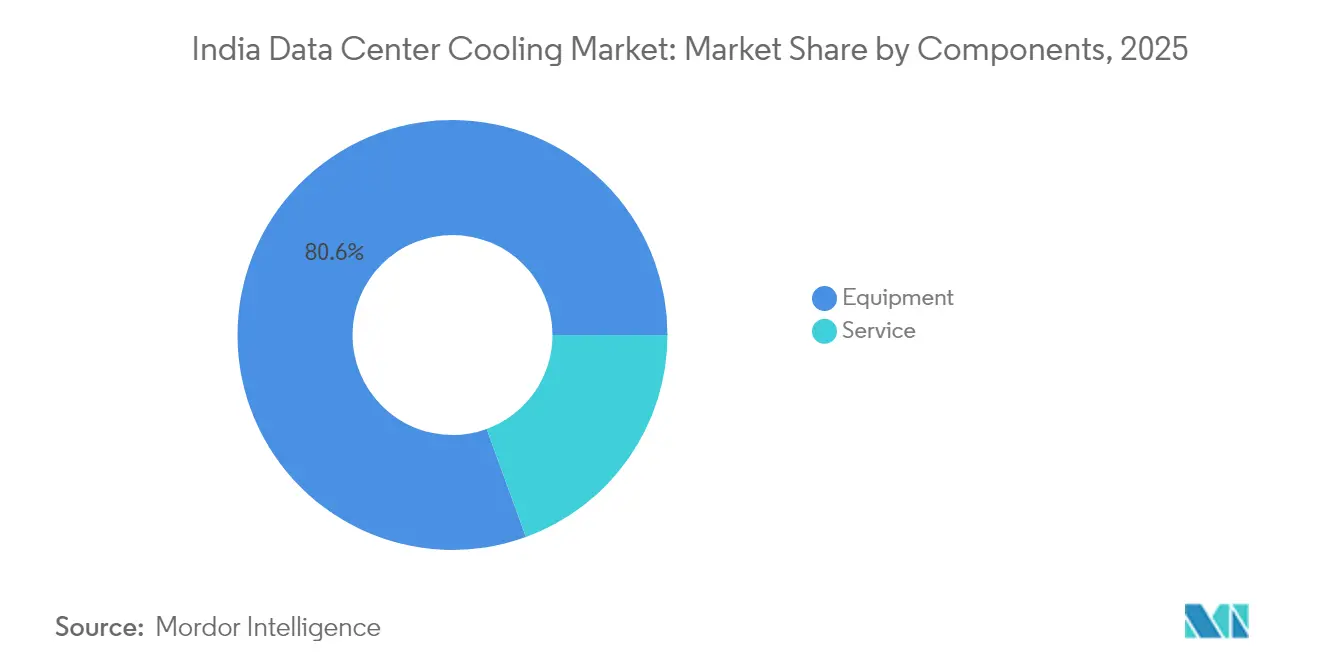
- By component, equipment accounted for 80.55% share of the India data center cooling market size in 2025, and services are advancing at 26.12% CAGR.
Note: Market size and forecast figures in this report are generated using Mordor Intelligence’s proprietary estimation framework, updated with the latest available data and insights as of 2026.
India Data Center Cooling Market Trends and Insights
Drivers Impact Analysis*
| Driver | (~) % Impact on CAGR Forecast | Geographic Relevance | Impact Timeline |
|---|---|---|---|
| Hyperscale cloud build-outs accelerating capacity additions | +6.8% | Mumbai, Chennai, Hyderabad | Medium term (2-4 years) |
| Government-backed digital initiatives expanding data generation | +5.2% | National metro clusters | Long term (≥ 4 years) |
| Rising rack power densities heightening cooling intensity requirements | +4.1% | Tier 1 cities, fringe Tier 2 markets | Short term (≤ 2 years) |
| Edge data-center roll-outs in Tier 2/3 cities creating niche demand | +3.4% | Pune, Ahmedabad, Kochi | Medium term (2-4 years) |
| Carbon-pricing deadlines pushing liquid-cooling adoption | +2.8% | Corporate hubs | Medium term (2-4 years) |
| Rapid decline in renewable power LCOE enabling retrofits | +2.1% | Solar-rich states | Long term (≥ 4 years) |
| Source: Mordor Intelligence | |||
Hyperscale cloud build-outs accelerating capacity additions
Hyperscale operators continue to redefine the India data center cooling market through multibillion-dollar capacity expansions that require advanced thermal management. Sify Technologies’ USD 5 billion AI campus exemplifies the shift toward GPU-dense facilities that mandate liquid cooling for racks beyond 20 kW. [1]Data Center Dynamics, “Sify Technologies Commits USD 5 Billion to AI Campus,” datacenterdynamics.com Vertiv recorded a 60% jump in organic orders in Q1 2024 as hyperscale clients accelerated procurement of high-density cooling platforms. Long-term offtake contracts with these operators enable vendors to allocate larger R&D budgets to immersion and direct-to-chip systems, establishing Mumbai, Chennai, and Hyderabad as concentrated innovation hubs.
Government-backed digital initiatives expanding data generation
Nationwide programs such as Digital India and the Digital Personal Data Protection Act are scaling data creation and promoting onshore storage, thereby extending the addressable base for the India data center cooling market. Mandates tied to Aadhaar integrations push both public and private entities to maintain domestic infrastructure, stimulating demand for dependable cooling systems in metro and edge environments.
Rising rack power densities heightening cooling intensity requirements
AI and high-performance computing workloads are now driving average rack densities beyond 15 kW; certain GPU clusters surpass 40 kW, outstripping the efficiency envelope of conventional air arrangements. PhonePe’s collaboration with Dell Technologies achieved 26% power savings using alternative cooling architectures, reinforcing the operational payoff of liquid solutions.[2]Dell Technologies, “Driving Efficiency in PhonePe’s Data Center,” dell.com Facility layout, power distribution, and control software are therefore being redesigned to handle higher thermal footprints, accelerating the technology transition within the India data center cooling market.
Edge data-center roll-outs in Tier-2/3 cities creating niche cooling demand
Latency-sensitive content delivery and industrial IoT deployments are stimulating edge data center builds across tier-2 and tier-3 cities. Pi Datacenters anticipates that capacity outside primary metros will triple in five years, underscoring a fresh revenue pool for modular cooling vendors. Elevated ambient temperatures and intermittent utilities necessitate autonomous, ruggedized solutions, creating headroom for regional integrators that can furnish responsive after-sales support.
Restraints Impact Analysis*
| Restraint | (~) % Impact on CAGR Forecast | Geographic Relevance | Impact Timeline |
|---|---|---|---|
| Large upfront capex for advanced liquid cooling systems | -3.2% | National, SME operators | Short term (≤ 2 years) |
| Elevated power tariffs and intermittent grid reliability | -2.8% | Northern states, industrial zones | Medium term (2-4 years) |
| Shallow domestic supply chain for specialized components | -2.1% | National, acute in Tier 2/3 | Long term (≥ 4 years) |
| Water-use restrictions in drought-prone states | -1.6% | Maharashtra, Karnataka, Tamil Nadu | Medium term (2-4 years) |
| Source: Mordor Intelligence | |||
Large upfront capex for advanced liquid cooling systems
Capex premiums of 40-60% over air-cooled deployments deter rapid adoption among smaller operators. Custom engineering, specialized pumps, and skilled labor extend deployment cycles, elongating payback beyond 3-4 years.[3]Verne Global, “Liquid Cooling TCO Analysis,” verneglobal.comWhile OPEX savings are material, financing hurdles persist unless project sponsors can lock in long-term workloads or secure incentive backing.
Elevated power tariffs and intermittent grid reliability increasing OPEX volatility
Electricity constitutes as much as 70% of data-center OPEX, with cooling systems responsible for up to 40% of that usage. Regions with higher tariffs force operators to weigh location versus redundancy investments. Pending guidelines to standardize thermal set points could further restrict cooling flexibility, prompting larger operators to integrate renewable energy and intelligent controls to mitigate tariff shocks.
*Our forecasts treat driver/restraint impacts as directional, not additive. The impact forecasts reflect baseline growth, mix effects, and variable interactions.
Segment Analysis
By Data Center Type: Hyperscalers drive cooling innovation
Hyperscale facilities captured 42.18% India data center cooling market share in 2025 and are projected to record a 25.78% CAGR through 2031. Extensive AI training clusters and stringent data-localization clauses compel hyperscalers to specify liquid-ready architectures capable of 40+ kW racks. Microsoft, Google, and Amazon Web Services are standardizing direct-to-chip cooling to improve power usage effectiveness, shaping vendor roadmaps. The enterprise and edge cohort remains substantial but fragmented, often starting with incremental CRAH upgrades before considering immersion solutions. Colocation providers balance legacy and next-generation workloads, deploying hybrid cooling to serve a diverse tenant base. As a result, integrated service suites that cover design, deployment, and predictive maintenance are becoming a default requirement across operator classes.
Hyperscale procurement volumes are reshaping supplier dynamics. Vertiv’s USD 2,036 million Q1 2025 net sales highlight demand concentration among large cloud clients. Enterprise operators are evaluating densification projects to consolidate smaller server rooms into purpose-built cores that leverage higher-efficiency chillers. Colocation players, keen to differentiate, advertise rack-ready liquid cooling pods aimed at GPU tenants while retaining air-cooled halls for conventional IT stacks. The resultant mixed-technology footprint amplifies the role of software-defined thermal management that orchestrates varied equipment profiles within a single site, reinforcing lifecycle revenue for OEMs and integrators.


By Tier Type: Tier 4 facilities lead growth despite Tier 3 dominance
Tier 3 sites accounted for 62.85% India data center cooling market size in 2025, favored for cost-reliability balance. Tier 4 builds, though fewer, are expanding fastest at 26.88% CAGR, driven by sectors where downtime penalties exceed incremental capex. Financial services, healthcare, and sovereign clouds prioritize N+1 or 2N redundancy across chillers, distribution pumps, and heat rejection stacks. Yotta Infrastructure’s NM1 facility illustrates engineered resiliency with dual independent cooling loops available for live maintenance. Tier 1 and Tier 2 installations focus on edge aggregation and price-sensitive content caching where partial redundancy suffices.
Growth in Tier 4 adoption is encouraging multi-vendor redundancy schemes, heightening integration complexity and favoring suppliers with open-protocol control platforms. Meanwhile, Tier 3 operators are retrofitting adiabatic units and free-cooling coils to contain PUE targets within regulatory thresholds. Government purchasing guidelines are increasingly referencing Uptime Institute standards, indirectly steering adoption of higher-tier designs and by extension more robust cooling investments. As the uptime imperative intensifies, lifecycle service contracts that guarantee performance are gaining prominence, especially among Tier 4 facilities where SLA breaches carry steep penalties.
By Cooling Technology: Liquid solutions gain momentum
Air-based solutions retained 66.35% revenue share in 2025, including chillers, CRAH units, and cooling towers adapted for India’s climatic variance. Liquid methods—immersion, direct-to-chip, and rear-door heat exchangers—are, however, growing at 27.34% CAGR, forming the fastest-rising share within the India data center cooling market. Submer’s USD 55.5 million fundraising underscores investor conviction in immersion technology for GPU-centric loads. Vertiv’s CoolPhase Flex platform blends air and liquid pathways, letting operators migrate incrementally while protecting legacy assets.
Liquid technology uptake is closely tied to rack density. At 15-20 kW, rear-door heat exchangers present a transitional path with minimal floorplan disruption. Once racks exceed 30 kW, direct-to-chip loops outclass air systems on energy and space metrics. Immersion pools see adoption where white-space availability is tight and water restrictions curb evaporative towers. Policy debate around refrigerant GWP is another lever steering adoption toward sealed liquid loops that minimize refrigerant charge volumes.
By Component: Services emerge as growth driver
Equipment continued to dominate with 80.55% share in 2025, yet services represent the strongest growth vector at 26.12% CAGR. Consulting, installation, and predictive maintenance are indispensable as operators face multiple cooling technologies within a single campus. Johnson Controls’ creation of a Global Data Center Solutions division indicates a strategic shift to service-centric revenue that complements hardware pull-through. Nxtra by Airtel’s deployment of an AI-driven SmartSense platform demonstrates operators’ willingness to pay for analytics that shave energy consumption and pre-empt faults.
Lifecycle service bundles now include capacity planning, CFD modeling, regulatory compliance support, and on-site training, all billed under long-term contracts. Integrators that can deliver turnkey packages—combining chillers, CDUs, software, and field support—are distancing themselves from equipment-only competitors. As liquid cooling spreads, specialist maintenance skills command premium margins, reinforcing services’ share of wallet in the India data center cooling market.
Geography Analysis
Supply constraints and rising real estate premiums are pushing new builds toward Navi Mumbai, where zoning permits large footprints. Despite these challenges, Mumbai remains the preferred launchpad for international cloud entrants, sustaining outsized demand for high-density cooling modules. Chennai stands out as the fastest-growing metro due to port proximity and cost advantages, with Equinix investing USD 65 million for a 4,950-cabinet campus powered entirely by renewable energy. This pipeline positions Chennai as a showcase for sustainable liquid-ready facilities in humid coastal climates.
Delhi-NCR and Bengaluru form secondary hubs with steady enterprise and hyperscale activity, albeit tempered by power-distribution bottlenecks that add lead-time risk to cooling deployments. Government parks in Noida and Greater Noida are incentivizing greenfield builds with subsidized power tariffs, spurring interest in hybrid cooling approaches that balance upfront cost with energy resilience. Hyderabad registers the fastest MW-scale expansion, rising from 44 MW to 128 MW, supported by state incentives and availability of large parcels that permit modular campus layouts
Competitive Landscape
The India data center cooling market is moderately fragmented, with no vendor holding a dominant share. Global OEMs—Vertiv, Schneider Electric, and Johnson Controls—extend broad product lines and established global supply chains, securing the bulk of hyperscale contracts. Regional brands such as Blue Star and Kirloskar Chillers offer cost-competitive units tailored to local climatic conditions, serving mid-market colocation and enterprise segments. Recent strategic moves highlight the pivot toward integrated solutions. Schneider Electric acquired Motivair to reinforce its liquid cooling depth, while Vertiv bought centrifugal chiller IP from BiXin Energy to upgrade its high-performance compute portfolio
Partnership strategies are emerging as vendors align with renewable developers to offer bundled cooling-plus-power propositions that meet carbon intensity targets. Service specialization is another theme: Johnson Controls formed a Global Data Center Solutions unit to deliver design-build-operate packages inclusive of predictive analytics. Disruptive entrants like Submer focus solely on immersion technology, pushing incumbents to accelerate R&D. White-space opportunities persist in Tier-2/3 edge deployments where local system integrators can differentiate through rapid response times and region-specific support.
India Data Center Cooling Industry Leaders
Vertiv Co.
Stulz GmbH
Schneider Electric SE
Rittal GmbH & Co. KG
Alfa Laval AB
- *Disclaimer: Major Players sorted in no particular order

Recent Industry Developments
- June 2025: Vertiv launched MegaMod CoolChip, a prefabricated modular data center with direct-to-chip cooling that halves deployment timelines.
- April 2025: Vertiv posted USD 2,036 million net sales, up 24%, citing surging AI cooling demand in Asia-Pacific.
- April 2025: iGenius commissioned a sovereign AI data center using Vertiv infrastructure and NVIDIA GPUs.
- March 2025: Blue Star earmarked INR 400 crore (USD 48 million) for capacity expansion targeting 20% growth in FY26.


Research Methodology Framework and Report Scope
Market Definitions and Key Coverage
Our study defines the India data-center cooling market as the yearly spending on dedicated equipment, air-based and liquid-based chillers, CRAH/CRAC units, containment, pumps, and the related design, installation, and maintenance services that keep server halls within recommended thermal envelopes. The valuation is expressed in constant 2025 US dollars and spans hyperscale, colocation, enterprise, and edge facilities of Tier 1-4.
Scope exclusion: office HVAC systems or generic building chillers that are not deployed to cool active IT loads are outside this study.
Segmentation Overview
- By Data Center Type
- Hyperscalers (owned and Leased)
- Enterprise and Edge
- Colocation
- By Tier Type
- Tier 1 and 2
- Tier 3
- Tier 4
- By Cooling Technology
- Air-based Cooling
- Chiller and Economizer (DX Systems)
- CRAH
- Cooling Tower (covers direct, indirect and two-stage cooling)
- Others
- Liquid-based Cooling
- Immersion Cooling
- Direct-to-Chip Cooling
- Rear-Door Heat Exchanger
- Air-based Cooling
- By Component
- By Service
- Consulting and Training
- Installation and Deployment
- Maintenance and Support
- By Equipment
- By Service
Detailed Research Methodology and Data Validation
Primary Research
We interviewed facility managers at hyperscalers, regional colocation providers, OEM engineers, and energy-efficiency consultants across Mumbai, Bengaluru, Chennai, and Hyderabad. These conversations helped us verify average unit prices, service contract structures, and adoption timelines for liquid immersion and rear-door heat exchangers that secondary material only hinted at.
Desk Research
We begin by mapping the installed data-center footprint with material published by the Bureau of Energy Efficiency, the Ministry of Electronics & IT, and the Telecom Regulatory Authority of India, then cross-checking capacity additions reported by the Data Centre Council of India and Uptime Institute insights. Company filings, IPO prospectuses, and reputable press articles add project-specific capex and service contract values, while paid tools such as D&B Hoovers and Dow Jones Factiva supply private-operator financial hints that enrich our baseline. Mordor analysts finally validate technical coefficients, typical PUE, rack density, and cooling load per megawatt, using patent abstracts from Questel and shipment traces from Volza. The sources listed are illustrative; many additional open and subscription references support data gathering and clarification.
Market-Sizing & Forecasting
A top-down capacity reconstruction converts operational IT power (MW) into cooling demand using validated PUE ranges, which is then valued with blended equipment and service ASPs. Results are stress-tested with bottom-up samplings of large build-outs announced during 2024-2025. Key model drivers include new megawatt additions, average rack heat density, service contract renewal cycles, electricity tariffs, regulatory PUE targets, and penetration of liquid cooling systems. A multivariate regression anchored on these variables produces the 2025-2030 outlook, while scenario analysis adjusts for policy shifts and energy price volatility. Where supplier counts are partial, we bridge gaps with edge-site density proxies collected through field surveys.
Data Validation & Update Cycle
We apply variance checks against import data, public tenders, and energy audit disclosures, followed by a peer review round before sign-off. Reports refresh every twelve months, and analysts trigger interim revisions when large hyperscale deals, policy mandates, or technology breakthroughs materially move the baseline.
Why Mordor's India Data Center Cooling Baseline Commands Confidence
Published market numbers often diverge because firms choose different equipment baskets, revenue streams, and refresh cadences. Our disciplined scoping, variable selection, and annual update rhythm minimize those gaps and give decision-makers a dependable starting point.
Key gap drivers include whether service revenue is counted, how tier classifications are mapped, and the aggressiveness of PUE and rack density assumptions.
Benchmark comparison
| Market Size | Anonymized source | Primary gap driver |
|---|---|---|
| USD 2.38 B (2025) | Mordor Intelligence | - |
| USD 1.04 B (2024) | Regional Consultancy A | Counts only equipment capex and omits Tier 1-2 edge sites |
| USD 0.61 B (2024) | Trade Journal B | Relies on vendor revenue snippets with limited primary validation |
| USD 2.10 B (2024) | Industry Association C | Includes equipment plus install labor yet excludes recurring service contracts |
The comparison shows that Mordor's balanced mix of equipment and service revenue, full facility tier coverage, and annually refreshed variables delivers a transparent, reproducible baseline that clients can track with confidence.


Key Questions Answered in the Report
What is the current size of the India data center cooling market?
The market is valued at USD 2.99 billion in 2026 and is projected to reach USD 9.28 billion by 2031.
Which data center type generates the largest cooling demand?
Hyperscale facilities account for 42.18% of cooling spend in 2025 and will continue to lead growth at 25.78% CAGR through 2031.
Why is liquid cooling gaining popularity in India?
AI and high-performance computing workloads push rack densities beyond 15 kW, making liquid solutions more energy-efficient than traditional air systems.
Which Indian metro is the fastest growing data center hub?
Chennai shows the highest capacity growth trajectory due to lower costs, strong policy support, and strategic cable connectivity.
Page last updated on:


