Market Overview
| Study Period | 2020 - 2031 |
|---|---|
| Forecast Data Period | 2026 - 2031 |
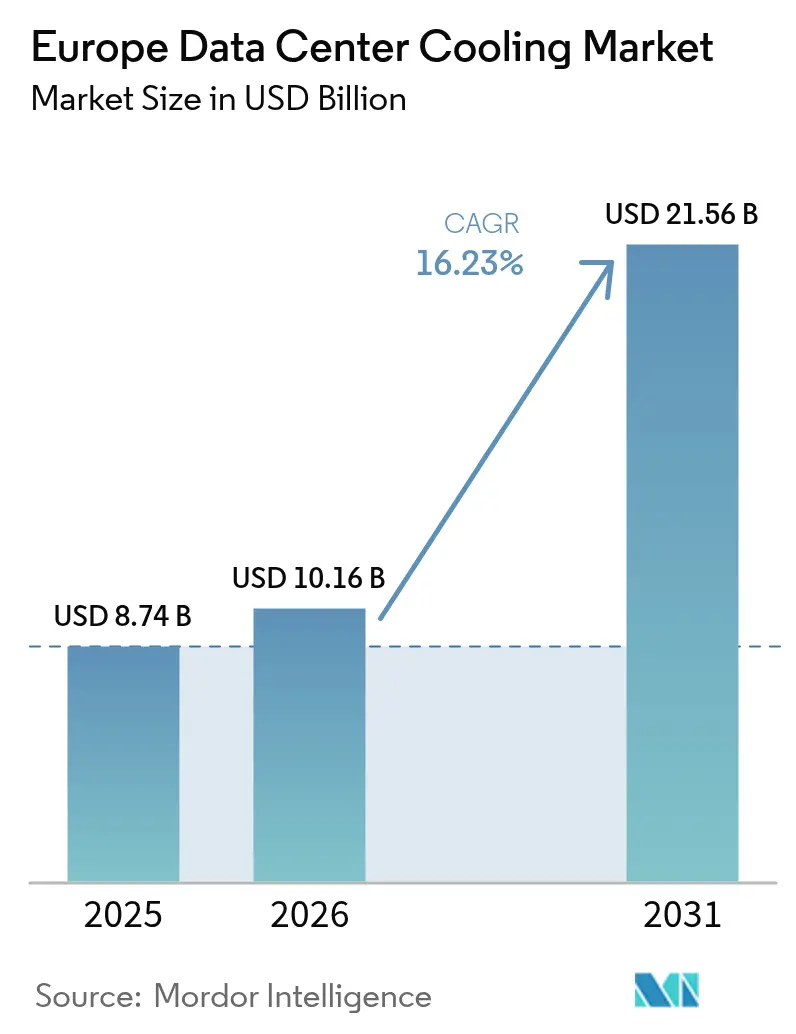
| Base Year Market Size (2025) | USD 8.74 Billion |
| Market Size (2026) | USD 10.16 Billion |
| Market Size (2031) | USD 21.56 Billion |
| Growth Rate (2026 - 2031) | 16.23% CAGR |
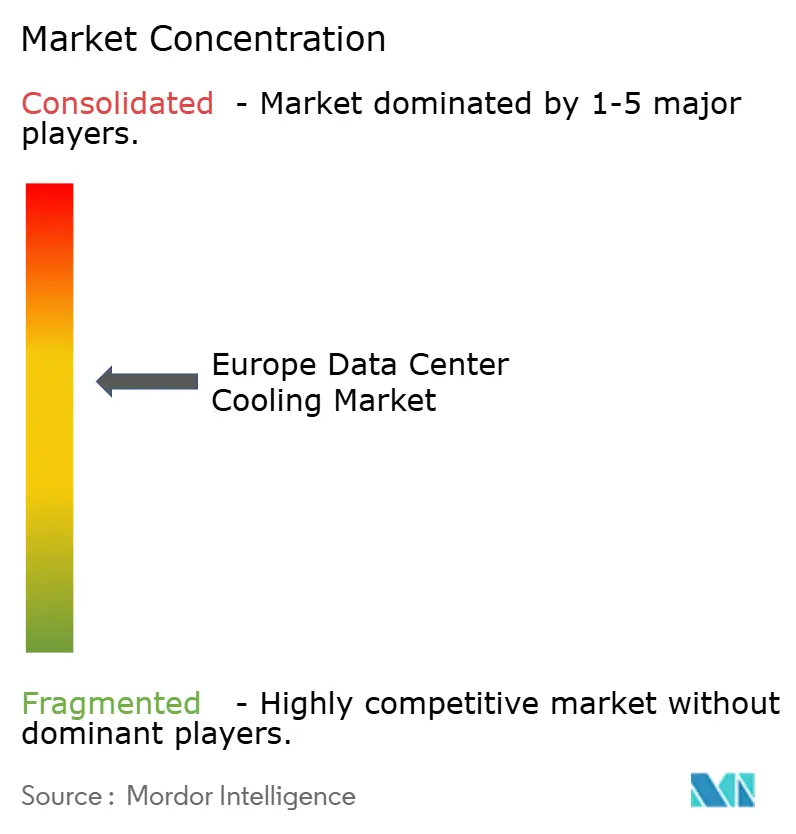
| Market Concentration | Medium |
Major Players *Disclaimer: Major Players sorted in no particular order Image © Mordor Intelligence. Reuse requires attribution under CC BY 4.0. | |
Europe Data Center Cooling Market Analysis by Mordor Intelligence
Europe data center cooling market size in 2026 is estimated at USD 10.16 billion, growing from 2025 value of USD 8.74 billion with 2031 projections showing USD 21.56 billion, growing at 16.23% CAGR over 2026-2031. Demand for AI-ready capacity, tougher energy-efficiency rules, and persistent supply constraints in the FLAP-D corridor have combined to accelerate investment in advanced thermal management. Natural free-cooling conditions across the Nordic region, together with mandatory waste-heat reuse for sites above 1 MW, are reshaping technology choices toward liquid systems and district-heating integration. Vendor consolidation is intensifying as incumbent HVAC suppliers purchase liquid-cooling specialists to secure the competencies needed for high-density racks. Component shortages and grid-connection delays remain near-term brakes, yet operators with capital headroom are using liquid cooling to unlock higher rack densities and premium AI margins, reinforcing the region’s lead in sustainable digital infrastructure.
Key Report Takeaways
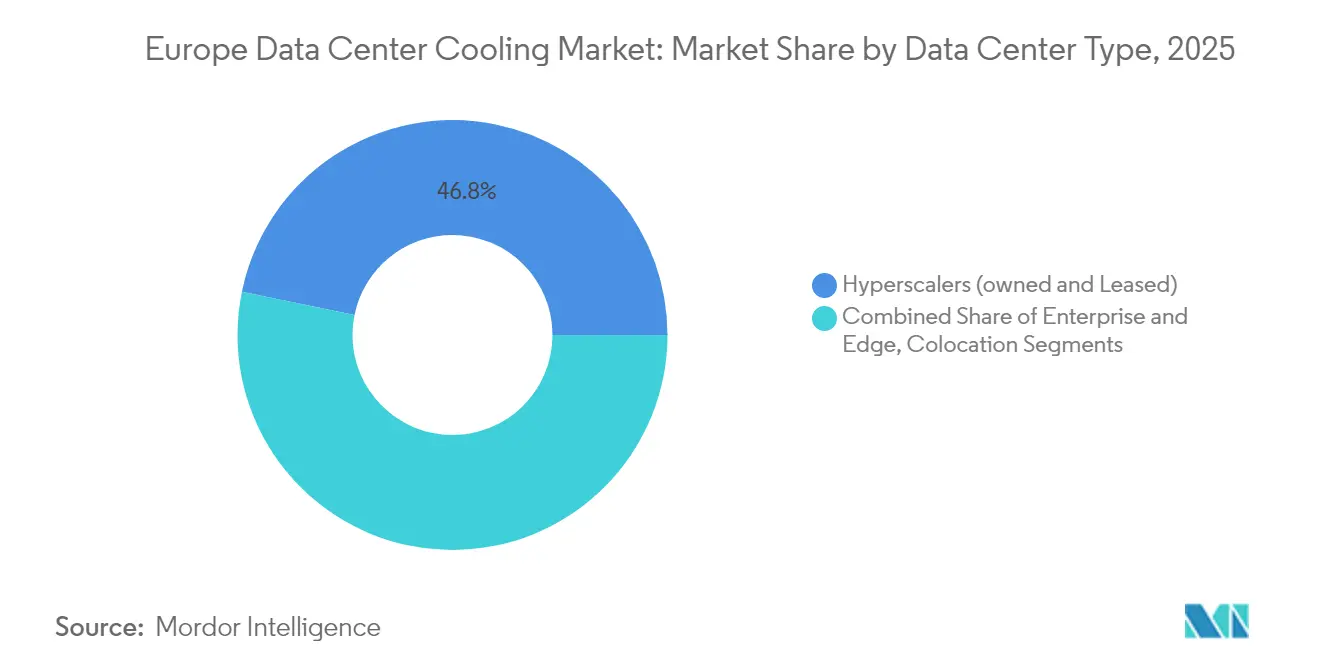
- By data center type, hyperscalers held 46.78% of the European data center cooling market share in 2025 while recording the fastest expansion at a 16.62% CAGR through 2031.
- By tier classification, Tier 3 sites led with 64.92% revenue share in 2025; Tier 4 facilities are projected to grow at 17.05% CAGR over 2026-2031.
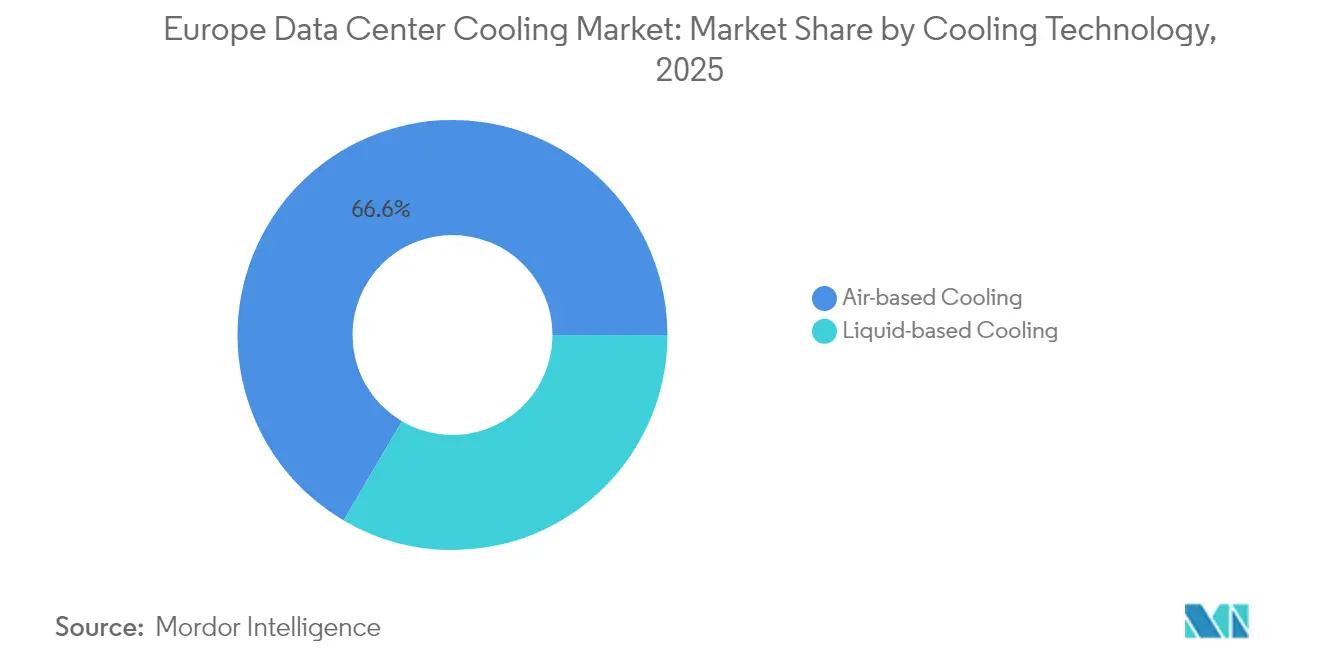
- By cooling technology, air-based solutions retained 66.55% share in 2025 whereas liquid systems are forecast to climb at an 17.76% CAGR to 2031.
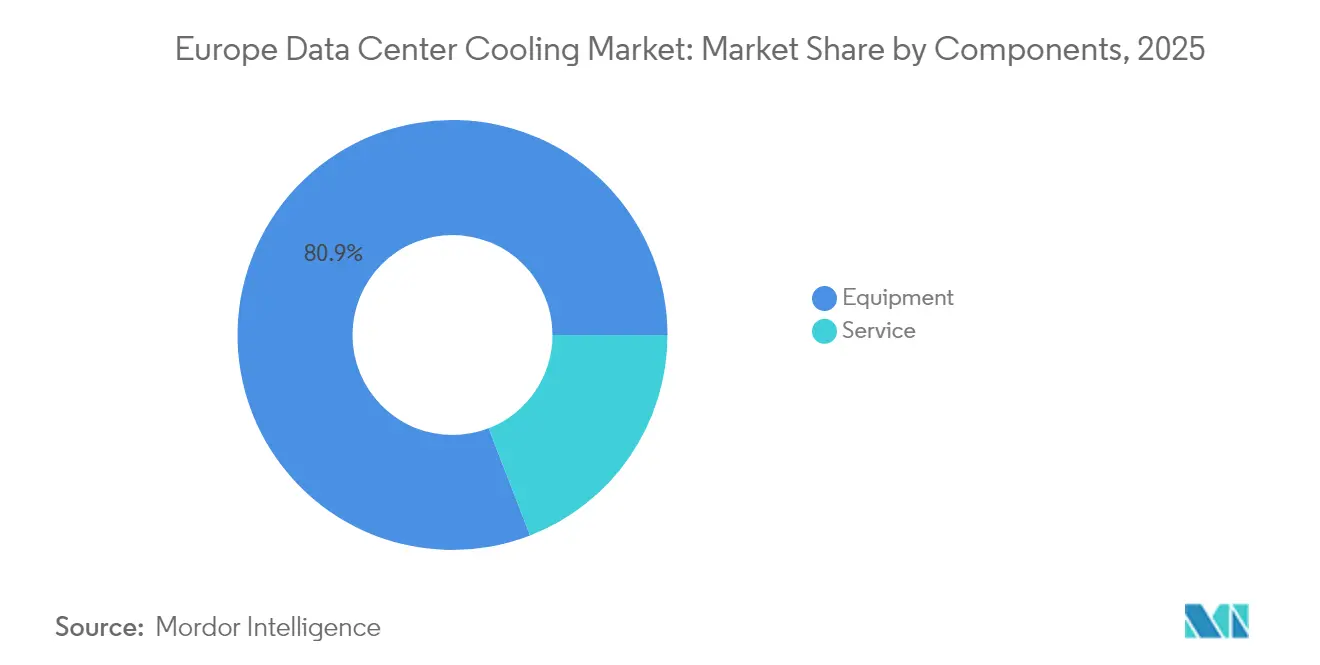
- By component, equipment commanded 80.88% share of the Europe data center cooling market size in 2025; services are set to rise at a 17.01% CAGR through 2031.
- By country, the United Kingdom accounted for 33.88% of the Europe data center cooling market size in 2025; Poland represents the fastest-growing national market at 16.39% CAGR to 2031.
Note: Market size and forecast figures in this report are generated using Mordor Intelligence’s proprietary estimation framework, updated with the latest available data and insights as of 2026.
Europe Data Center Cooling Market Trends and Insights
Drivers Impact Analysis*
| Driver | (~)% Impact on CAGR Forecast | Geographic Relevance | Impact Timeline |
|---|---|---|---|
| Surging AI-led rack power densities | +4.2% | Global, with concentration in FLAP-D corridor | Short term (≤ 2 years) |
| EU Green Deal and related energy-efficiency mandates | +3.8% | EU-wide, strongest in Germany and Netherlands | Medium term (2-4 years) |
| Hyperscale and colocation build-outs in FLAP-D corridor | +3.1% | Frankfurt, London, Amsterdam, Paris, Dublin | Medium term (2-4 years) |
| Northern Europe's free-cooling climate advantage | +2.4% | Nordic countries, extending to Northern Germany | Long term (≥ 4 years) |
| District-heating revenue from waste-heat re-use | +1.8% | Nordic countries, Germany, Netherlands | Long term (≥ 4 years) |
| Sovereign AI clusters adopting micro-modular liquid cooling | +1.3% | National initiatives across major EU economies | Medium term (2-4 years) |
| Source: Mordor Intelligence | |||
Surging AI-led Rack Power Densities
AI training clusters are pushing rack loads from 10-15 kW toward 40-60 kW, a shift that renders conventional CRAH units inadequate. Vertiv cited a 37% year-on-year rise in liquid-cooling orders during Q3 2024 as GPU-intensive builds accelerated. Sovereign AI programs amplify the trend: Beyond.pl’s new Sovereign AI Factory in Poland uses micro-modular liquid pods to condense national compute into secure footprints.[1]Beyond.pl, “Sovereign AI Factory launch press release,” telekomtalk.infoHigher fluid-cooling content is driving copper demand, adding further strain to supply chains already coping with long lead times.
EU Green Deal and Related Energy-Efficiency Mandates
The Energy Efficiency Directive obliges sites above 1 MW to recover waste heat unless technically infeasible, steering designs toward low-exergy cooling loops linked to municipal networks. Retelit’s Avalon 3 centre in Milan already diverts 2.5 MWt into district heating, cutting 3,300 t of annual CO₂.[2]Retelit, “Avalon 3 heat-reuse project,” retelit.it In parallel, the F-gas phase-down accelerates migration to low-GWP refrigerants or non-refrigerant liquid technologies.
Hyperscale and Colocation Build-outs in FLAP-D Corridor
Vacancy in FLAP-D declined in 2024 and is projected to rise in 2025, prompting hyperscalers to pre-lease capacity 16 months before go-live. Colt’s Frankfurt West campus was fully committed before shell completion. Cooling systems are now a key differentiator; Digital Realty’s Frankfurt expansion markets AI-optimized liquid systems as a premium feature.[3]Digital Realty, “Digital Realty expands in Frankfurt,” digitalrealty.com
Northern Europe’s Free-Cooling Climate Advantage
Nordic temperatures let operators deliver PUE figures near 1.1 while shaving energy bills up to 40%. XTX Markets committed EUR 1 billion to a Kajaani campus that will rely on ambient air and heat export to the local grid. Norway’s fjord-water cooling at Green Mountain removes chiller loads entirely and underpins the government’s digital-export strategy.
Restraints Impact Analysis*
| Restraint | (~)% Impact on CAGR Forecast | Geographic Relevance | Impact Timeline |
|---|---|---|---|
| High CAPEX for liquid-cooling retrofits | -2.8% | Global, particularly affecting legacy facilities | Short term (≤ 2 years) |
| EU-wide F-gas / refrigerant phase-down complexity | -1.9% | EU-wide, strongest impact in Southern Europe | Medium term (2-4 years) |
| Shortage of certified water-treatment skills | -1.4% | Global, acute in Eastern and Southern Europe | Medium term (2-4 years) |
| Grid-connection moratoria in power-tight metros | -1.1% | Amsterdam, Dublin, London metropolitan areas | Short term (≤ 2 years) |
| Source: Mordor Intelligence | |||
High CAPEX for Liquid-Cooling Retrofits
Upgrading an existing hall to direct-to-chip loops can cost beyond USD 1,000 per kW, a figure that drives operators to weigh greenfield builds against retrofits. Component lead times of 12-16 months for pumps, CDU valves, and high-capacity chillers extend project paybacks. Skills scarcity adds opex, as water-chemistry expertise commands premium rates.
EU-wide F-gas / Refrigerant Phase-Down Complexity
The 2030 F-gas cap compresses the availability of high-GWP blends, sending prices upward and complicating maintenance scheduling. Rittal’s Blue e+ S launch, cutting GWP 56%, illustrates design revision costs but also the pathway toward compliance. Divergent enforcement calendars across member states increase legal workload for multi-country operators.
*Our forecasts treat driver/restraint impacts as directional, not additive. The impact forecasts reflect baseline growth, mix effects, and variable interactions.
Segment Analysis
By Data Center Type: Hyperscalers Drive Market Transformation
Hyperscaler facilities captured 46.78% of the European data center cooling market share in 2025 and are projected to rise at a 16.62% CAGR, confirming their outsized influence on technology migration. Their extensive capital budgets absorb the higher upfront costs of immersion tanks and rear-door heat exchangers, accelerating ecosystem learning curves. Enterprise and edge sites lag in adoption but are piloting modular coolant distribution to meet localized AI inference. Colocation operators are carving a middle path by offering “liquid-cooling suites” that de-risk client transformation, an approach that underpins rising service revenue.
Sovereign AI mandates intensify hyperscaler momentum. Microsoft’s newest European builds dedicate entire halls to liquid-ready racks, enabling compute footprints that conventional air layouts cannot host. Colocation landlords respond by marketing liquid cooling as a service, a premium they recover via higher-density fees. Edge operators, pressured by latency requirements, are embracing compact dielectric-fluid pods, illustrating how scale dynamics filter through the entire ecosystem.


By Tier Type: Tier 4 Emerges as Liquid-Cooling Pioneer
Tier 3 remains the mainstream choice with 64.92% share of the Europe data center cooling market size in 2025, favored for balanced resilience and cost. Yet Tier 4 footprints expand at 17.05% CAGR as sovereign clouds and regulated sectors require simultaneous maintainability. Tier 4 blueprints frequently integrate dual coolant loops with N+N pumps, setting new reliability norms.
Tier 3 managers are adopting selective liquid retrofits, rear-door exchangers for AI tenants, CRAH rows for general-purpose racks, creating hybrid environments that prolong asset life. Tier 1/2 facilities hold niche relevance for content distribution and backup; their simplified cooling often leverages indirect free cooling to minimize spend. Standards bodies are reviewing whether current Tier definitions sufficiently account for liquid system redundancy, suggesting future design codifications.
By Cooling Technology: Liquid Systems Gain Strategic Momentum
Air methods still account for 66.55% of 2025 revenue. Economizer chillers and CRAH units dominate brown-field estates, and indirect evaporative towers remain cost-effective in moderate climates. Pressure, however, is mounting from 17.76% CAGR liquid-cooling growth led by direct-to-chip plates and single-phase immersion. Immersion vendors demonstrate chip thermal design power beyond 1,000 W, allowing AI racks to breach historical density ceilings.
Retrofit-friendly rear-door heat exchangers bridge the gap for legacy halls, delivering cooling of 30 kW per rack without floor-level plumbing changes. The technology race fuels M&A: Baltimore Aircoil licensed DUG’s immersion patents to secure a presence in high-density niches. Traditional air-cooling specialists are forming partnerships to safeguard share, reflecting a recognition that the performance ceiling of air alone has been reached for next-generation compute.
By Component: Services Growth Reflects Implementation Complexity
Equipment retained 80.88% share in 2025, a ratio supported by hardware-intensive build cycles. Yet the services segment is projected to grow 17.01% CAGR as operators outsource design, commissioning, and predictive maintenance. Liquid-cooling start-ups are bundling fluid-quality monitoring, leak-detection analytics, and training into recurring contracts, expanding lifetime revenue per MW.
Installation services capture the largest slice, reflecting the specialized pipe-fit, welding, and containment skills needed for coolant loops. Maintenance demand is likewise elevated because pump reliability directly affects uptime SLA metrics. Consultancy around waste-heat valorization and EU regulation compliance is emerging as a lucrative niche, with engineering firms modeling thermodynamic and financial returns of district-heating tie-ins.
Geography Analysis
The United Kingdom led with 33.88% of Europe data center cooling market size in 2025, propelled by London’s finance-centric cloud demand and favorable depreciation allowances. Power-grid constraints around the M25 ring have nudged designs toward sub-1.2 PUE solutions. Green Mountain’s 30 MW East London build targets high-performance workloads and leverages advanced liquid loops to stay within power-allocation caps. Government projections valuing the sector at GBP 44 billion contribution by 2035 sustain policy support.
Poland is the standout growth frontier with 16.39% CAGR. Hyperscalers, lured by mid-tier power costs and EU proximity, committed multibillion-euro spends; Google alone earmarked EUR 3 billion for regional cloud zones Atman’s USD 344 million Warsaw campus adds 14.4 MW with liquid-cooling loops that support 50 kW racks.
Competitive Landscape
Europe data center cooling market competition is tightening as scale and technology breadth become decisive. Schneider Electric’s USD 850 million Motivair acquisition secured immersion IP and high-capacity CDU manufacturing. Vertiv leverages a global service franchise to lock multiyear support deals and posted 19.2% organic net sales growth in Q3 2024.
Strategic alliances complement M&A. Munters and ZutaCore combine adiabatic air handling with direct-on-chip dielectric loops, bridging mixed-density halls. Carrier’s QuantumLeap platform bundles chillers, CDU racks, and AI controls, signaling a pivot from discrete hardware to integrated ecosystems.
Disruptors such as Submer, Iceotope, and Asperitas target immersion niches, prompting incumbents to license or acquire. The white-space opportunity lies in hybrid architectures: vendors that unify airside economization with close-coupled liquid loops position themselves to win refresh cycles across brown-field estates. Services capability is emerging as a moat; vendors offering design-build-operate packages lock operators into decade-long revenue streams.
Europe Data Center Cooling Industry Leaders
Vertiv Group Corp.
Stulz GmbH
Schneider Electric SE
Rittal GmbH & Co. KG
Asetek A/S
- *Disclaimer: Major Players sorted in no particular order

Recent Industry Developments
- February 2025: Carrier Global introduced QuantumLeap, a suite integrating direct-to-chip cooling and smart controls for AI data centers.
- February 2025: Green Mountain and KMW topped out a FLAP-D-area facility near Frankfurt, adding liquid-ready capacity.
- January 2025: XTX Markets earmarked EUR 1 billion for a Kajaani, Finland campus leveraging ambient air cooling and heat export.
- January 2025: Lidl owner announced a 200 MW campus in Lübbenau, Germany, advancing the country’s high-density build pipeline.


Research Methodology Framework and Report Scope
Market Definitions and Key Coverage
Our study defines the European data center cooling market as the yearly revenue generated from equipment, fluids, controls, and related services that remove heat inside hyperscale, colocation, enterprise, and edge data halls across the EU-27, United Kingdom, Norway, Switzerland, and Iceland. Solutions span air systems (CRAC/CRAH units, chillers, towers, free-air or adiabatic setups) and liquid techniques (rear-door heat exchangers, direct-to-chip, immersion) deployed within the white space.
Scope exclusion: Building HVAC for office space, power-conversion rooms, and telecom shelters is not counted.
Segmentation Overview
- By Data Center Type
- Hyperscalers (owned and Leased)
- Enterprise and Edge
- Colocation
- By Tier Type
- Tier 1 and 2
- Tier 3
- Tier 4
- By Cooling Technology
- Air-based Cooling
- Chiller and Economizer (DX Systems)
- CRAH
- Cooling Tower (covers direct, indirect and two-stage cooling)
- Others
- Liquid-based Cooling
- Immersion Cooling
- Direct-to-Chip Cooling
- Rear-Door Heat Exchanger
- Air-based Cooling
- By Component
- By Service
- Consulting and Training
- Installation and Deployment
- Maintenance and Support
- By Equipment
- By Service
- By Country
- United Kingdom
- Germany
- Netherlands
- Spain
- Poland
- Switzerland
- Austria
- Rest of Europe
Detailed Research Methodology and Data Validation
Primary Research
Mordor analysts interviewed facility engineers, design consultants, equipment product leads, and colocation procurement heads across FLAP-D hubs, Iberia, Nordics, and Central-Eastern Europe. These exchanges confirmed density trajectories, price corridors, liquid-cooling adoption intent, and service attach rates that underpin our model.
Desk Research
We began by gathering regulatory and technical baselines from Eurostat energy balances, the European Commission's JRC efficiency studies, national grid emissions files, Uptime Institute outage logs, and briefs from EUDCA and Bitkom. Company filings, IPO prospectuses, and municipal permitting portals revealed rack power, floor area, and PUE benchmarks, while respected news sources detailed expansion pipelines. Financial intelligence and real-time news flags were accessed through D&B Hoovers and Dow Jones Factiva. This set is illustrative; many additional references informed data collection, validation, and clarification.
Market-Sizing & Forecasting
A top-down construct converts installed IT load by metro into cooling CAPEX and OPEX pools through prevailing PUE, equipment life, and service-intensity ratios, which are then cross-checked bottom-up with sampled supplier revenues and average price-times-volume roll-ups. Key variables include hyperscale megawatt additions, rack power density migration, liquid-cool penetration, wholesale electricity futures, carbon-tax paths, and free-cooling hour availability. Five-year projections rely on multivariate regression blended with scenario analysis around AI workload growth, with coefficients vetted in follow-up calls with senior technologists.
Data Validation & Update Cycle
Outputs undergo variance checks against grid-consumption statistics and construction pipelines before senior review. We refresh the file annually, issuing interim updates when more than 10 MW projects, energy-price shocks, or material policy shifts surface.
Why Mordor's Europe Data Center Cooling Baseline Commands Confidence
Published estimates often diverge; other firms may widen geography, tally building HVAC, or roll forward stale install bases.
Reported 2024 views swing from USD 13.49 billion to USD 4.77 billion.
Benchmark comparison
| Market Size | Anonymized source | Primary gap driver |
|---|---|---|
| USD 8.74 B (2025) | Mordor Intelligence | - |
| USD 13.49 B (2024) | Regional Consultancy A | Includes office HVAC plus wider EMEA remit |
| USD 4.77 B (2024) | Trade Journal B | Counts equipment only; omits services and Nordics |
| USD 3.90 B (2025) | Global Consultancy C | Limits scope to cooling hardware, excluding maintenance |
The comparison shows that once variables are harmonized, figures converge toward our midpoint, underscoring that Mordor's balanced, transparent process offers decision-makers a dependable baseline.


Key Questions Answered in the Report
What is the current size of the Europe data center cooling market?
The Europe data center cooling market is valued at USD 10.16 billion in 2026 and is projected to hit USD 21.56 billion by 2031.
Which segment holds the largest share of Europe data center cooling market?
Hyperscale data centers lead with 46.78% market share in 2025, driven by large AI and cloud deployments.
Why are liquid-cooling technologies gaining traction in Europe?
AI racks now exceed 40 kW, surpassing air-cooling limits, and EU energy-efficiency rules favor liquid systems that support waste-heat reuse and low PUE.
How does EU regulation influence cooling choices?
The Energy Efficiency Directive requires heat-recovery for large sites, and the F-gas phase-down limits high-GWP refrigerants, pushing operators toward efficient liquid or low-GWP solutions.
Page last updated on:


