Market Overview
| Study Period | 2020 - 2031 |
|---|---|
| Forecast Data Period | 2026 - 2031 |
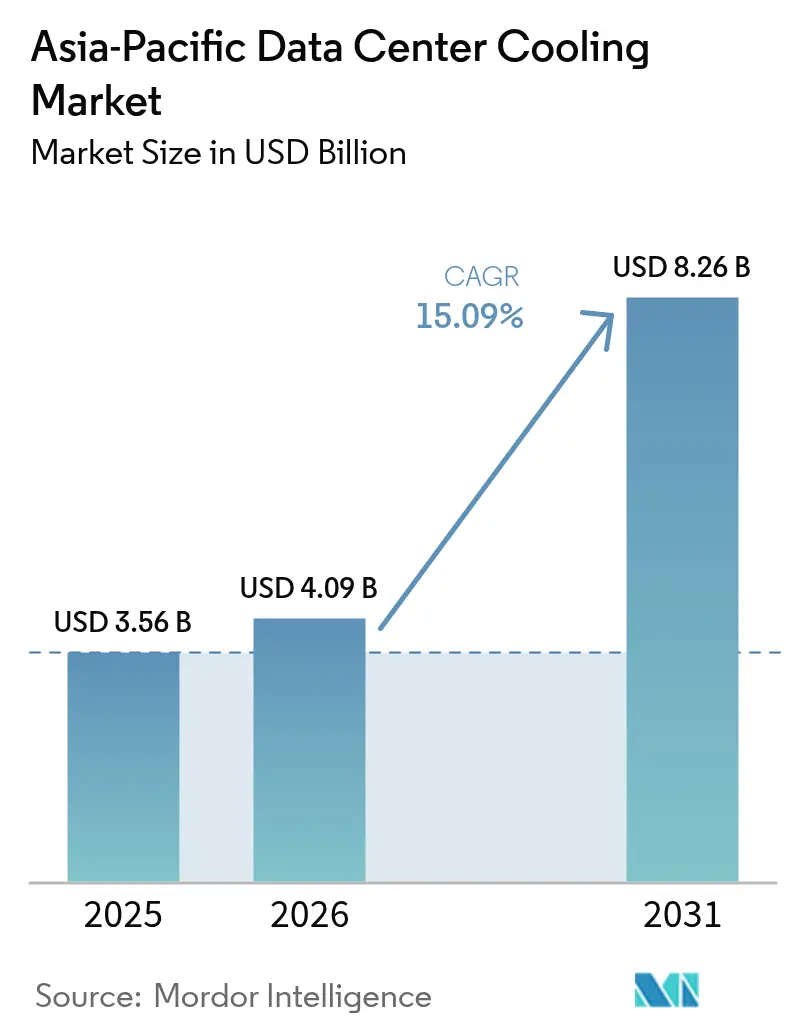
| Base Year Market Size (2025) | USD 3.56 Billion |
| Market Size (2026) | USD 4.09 Billion |
| Market Size (2031) | USD 8.26 Billion |
| Growth Rate (2026 - 2031) | 15.09% CAGR |
| Market Concentration | Low |
Major Players *Disclaimer: Major Players sorted in no particular order Image © Mordor Intelligence. Reuse requires attribution under CC BY 4.0. | |
Asia-Pacific Data Center Cooling Market Analysis by Mordor Intelligence
The Asia-Pacific data center cooling market size is expected to increase from USD 3.56 billion in 2025 to USD 4.09 billion in 2026 and reach USD 8.26 billion by 2031, growing at a CAGR of 15.09% over 2026-2031. Accelerating adoption of generative-AI servers, mandatory efficiency codes such as China’s PUE ≤ 1.3 rule and Singapore’s SS 715:2025 standard, and hyperscale build-outs by Microsoft, Google, Alibaba, and Tencent are expanding demand for high-performance thermal systems. Liquid architectures are gaining traction because air-based cooling reaches economic and technical limits above 30 kW per rack, yet air solutions still dominate legacy estates and sub-30 kW deployments. Vendors that combine hardware, software, and rapid prefabrication are winning contracts as operators compress build schedules from 18 months to six. Supply-chain risk is easing after 2024 steel and semiconductor shortages, but HVAC-skilled labor gaps in Southeast Asia remain a near-term bottleneck.
Note: Market size and forecast figures in this report are generated using Mordor Intelligence’s proprietary estimation framework, updated with the latest available data and insights as of 2026.
Asia-Pacific Data Center Cooling Market Trends and Insights
Drivers Impact Analysis*
| DRIVER | (~) % IMPACT ON CAGR FORECAST | GEOGRAPHIC RELEVANCE | IMPACT TIMELINE |
|---|---|---|---|
| AI/Gen-AI Rack Power Densification | +3.8% | China, Japan, Singapore | Medium term (2-4 years) |
| Hyperscale Build-Outs by US and Chinese Cloud Majors | +3.2% | China, India, Japan, Australia | Short term (≤ 2 years) |
| Edge Data Centers at 5G Micro-Regions | +2.1% | Core APAC, Southeast Asia | Medium term (2-4 years) |
| Corporate Net-Zero and RE100 Pledges | +1.9% | Singapore, Japan, Australia | Long term (≥ 4 years) |
| Modular Prefabricated Cooling Blocks | +1.7% | India, Southeast Asia | Short term (≤ 2 years) |
| District-Cooling Integration Pilots | +1.4% | Singapore, Tokyo, Hong Kong | Long term (≥ 4 years) |
| Source: Mordor Intelligence | |||
AI/Gen-AI Rack Power Densification Drives Liquid Pivot
Generative-AI clusters are lifting rack densities from 8-12 kW toward 40-60 kW, where air systems lose both cost and thermal headroom. Lenovo’s Neptune direct-to-chip platform installed at NTT’s Tokyo campus in 2025 saved 40% energy while supporting 50 kW racks, and China’s 2024 code now obliges liquid cooling above 8 kW per cabinet.[1]National Development and Reform Commission, “Data Center Energy Efficiency Guidelines 2024,” ndrc.gov.cn Singapore’s updated SS 715 demands PUE < 1.2 for high-density halls.[2]Singapore Infocomm Media Development Authority, “SS 715:2025 Green Data Centre Standard,” imda.gov.sgAt densities beyond 30 kW, immersion designs eliminate chillers and cut total cost of ownership by up to 30%, although uptake is moderated by OEM warranty terms and a shortage of technicians versed in dielectric-fluid safety. The Asia-Pacific data center cooling market is therefore shifting capital toward pumps, plates, and heat-exchanger modules that underpin liquid loops.
Hyperscale Build-Outs by Cloud Majors Anchor Demand
Microsoft’s USD 17.5 billion India program and Google’s USD 15 billion Andhra Pradesh campus each require 200-300 MW of IT load, absorbing 15-20% of regional chiller output through 2027. Oracle’s multi-country region specified six-month delivery of modular mechanical blocks, accelerating orders for Vertiv and Schneider Electric.[3]Oracle Corporation, “Southeast Asia Multi-Cloud Region Announcement,” oracle.com Chinese giants Alibaba and Tencent added 180 MW in 2025, drawn by land subsidies in Guangdong and Jiangsu that are conditional on 50% renewable sourcing. The hyperscale wave bifurcates the vendor field, rewarding suppliers with liquid IP and balance-sheet strength capable of vendor financing.
Edge Data Centers at 5G Micro-Regions Need Compact Cooling
Telstra’s 1,200-node Australian edge grid relies on rear-door heat exchangers that fit street-level cabinets. China Mobile standardized indirect evaporative units achieving PUE 1.15 without water use, vital in arid Gansu and Ningxia. Rakuten Mobile’s Open RAN network uses Delta Electronics micro-modules that cut site commissioning from four weeks to five days. Air remains dominant below 50 kW, yet Submer and Iceotope are piloting sealed immersion tanks for 50-100 kW sites where AI inference justifies higher capex. Regulatory codes now subject micro-sites to the same efficiency and acoustic ceilings as large facilities, driving continuous innovation in small-form-factor coolers.
Corporate Net-Zero and RE100 Pledges Elevate Efficiency
Nxtra Data aims for carbon neutrality by 2030, while STT GDC has pledged 100% renewable energy across Southeast Asia by the same year. Fujitsu’s Tatebayashi campus sells 12 MW of server waste heat to a neighboring park, offsetting 40% of Scope 2 emissions. Singapore’s Tampines district plant delivers 4 °C water to multiple tenants, saving 30% energy and preventing 15,000 tCO₂ annually. Such programs elevate power-usage-effectiveness thresholds and make liquid cooling a mandatory path to PUE < 1.2, reinforcing premium component demand across the Asia-Pacific data center cooling market.
Restraints Impact Analysis*
| Restraint | (~) % Impact on CAGR Forecast | Geographic Relevance | Impact Timeline |
|---|---|---|---|
| Rising Electricity and Land Costs in Tier-1 APAC Cities | -2.3% | Singapore, Tokyo, Hong Kong, Sydney | Short term (≤ 2 years) |
| Water-Use Restrictions in Drought-Prone India and Australia | -1.7% | Maharashtra, Karnataka, NSW, Victoria | Medium term (2-4 years) |
| Scarcity of HVAC-Certified Labor in Emerging Southeast Asia | -1.2% | Thailand, Malaysia, Indonesia, Vietnam | Medium term (2-4 years) |
| Lengthy Environmental Permitting and Community Pushback | -0.9% | Singapore, Malaysia, Australia | Long term (≥ 4 years) |
| Source: Mordor Intelligence | |||
Rising Electricity and Land Costs Compress Margins
Singapore’s tariff climbed to SGD 0.35/kWh in 2025 (USD 0.26/kWh) and the city’s land scarcity allocates only 300 MW of extra IT load through 2030, inflating plots above SGD 1,000 ft² (USD 695 ft²). Tokyo inner districts exceed USD 15,000 m², triggering capacity shifts to Osaka despite latency penalties. Similar pressures in Sydney and Hong Kong redirect builds toward outer suburbs or Guangdong, but grid and fiber gaps undermine quick scaling. Because air cooling can represent 40% of a facility’s power bill versus 15% for liquid, cost inflation is nudging incumbents to retrofit direct-to-chip loops even on brownfield assets.
Water-Use Restrictions Squeeze Evaporative Architectures
Maharashtra’s 2024 code caps fresh water at 2 L per kWh and demands 80% recycling, adding USD 3-5 million to a 20 MW project. Karnataka imposes seasonal bans during weak monsoons, impairing Bangalore’s 400 MW cluster. New South Wales requires WUE < 1.2 L per kWh and offset investments in watershed restoration; Victoria enforces stormwater capture that lengthens schedules by up to 18 month. These curbs propel dry coolers and sealed immersion tanks, despite a 15-20% capex premium, reinforcing the shift within the Asia-Pacific data center cooling market toward water-sipping designs.
*Our forecasts treat driver/restraint impacts as directional, not additive. The impact forecasts reflect baseline growth, mix effects, and variable interactions.
Segment Analysis
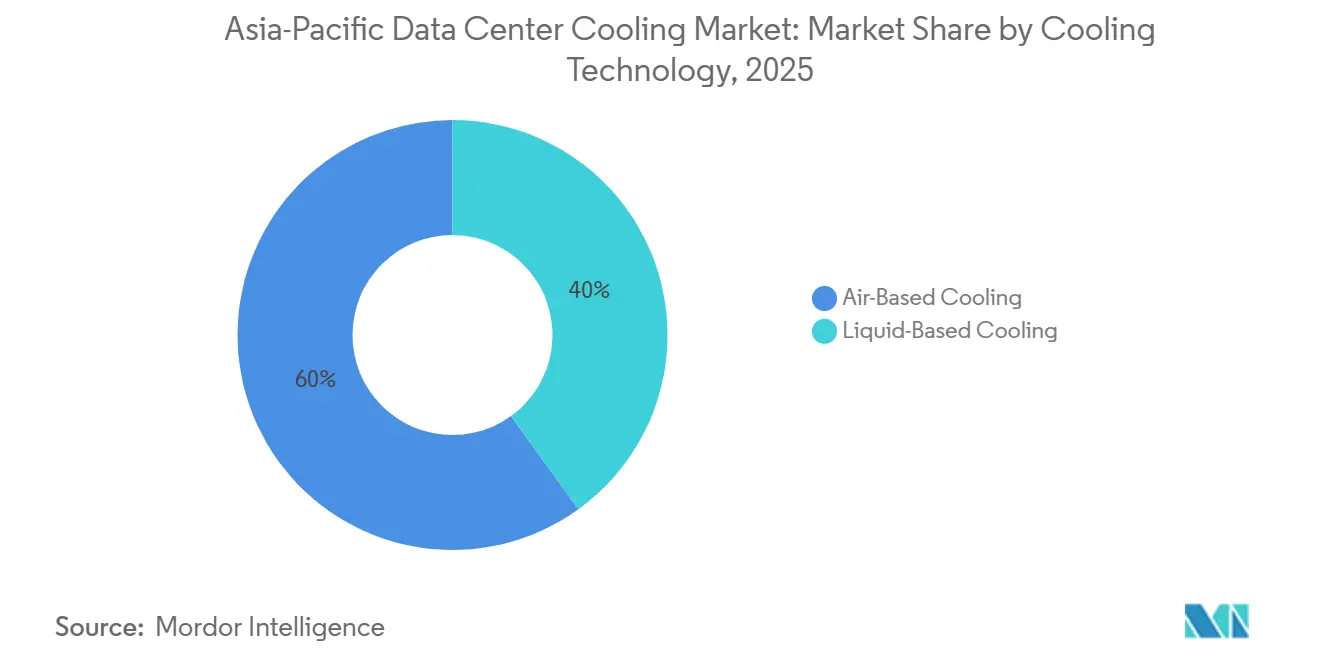
By Cooling Technology: Liquid Designs Capture High-Density Growth
Air-based systems delivered 59.96% revenue in 2025, supported by entrenched operational know-how and a vast installed base. Yet the Asia-Pacific data center cooling market size for liquid architectures is forecast to expand at a 16.13% CAGR as generative-AI racks exceed 40 kW, a density where rear-door exchangers and immersion tanks outrun fan-driven CRAC units. Immersion deployments at Keppel Data Centres achieved PUE 1.03 and removed chillers entirely, proving a 25% capex and 40% opex cut over air baselines. Direct-to-chip loops from CoolIT allowed 50 kW retrofits in Japanese and Australian halls, adding seven years to asset life.
Despite liquid’s momentum, air cooling preserves tactical advantages below 30 kW, in climates with extended free-cooling windows, and in markets short on dielectric-fluid skills such as Indonesia and Vietnam. Daikin’s magnetic-bearing chillers reached 0.45 kW per ton in Tokyo, sustaining air’s relevance where water limits prohibit towers. The Asia-Pacific data center cooling market continues to reward hybrid estates that blend fan coils for low-density rows with pumped liquid loops for AI zones, easing migration paths for cautious operators.


By Cooling Component: Flow-Control Hardware Surges
Computer-room air handlers maintained 41.55% share in 2025, but demand is tilting toward pumps, valves, and plate heat exchangers that orchestrate liquid loops. Grundfos and Xylem introduced variable-speed pumps tailored to 35-60 °C water, securing Microsoft and Google contracts in India. Alfa Laval’s Compabloc plates hit 95% heat-transfer efficiency inside immersion shells, driving multi-megawatt orders from Singapore and Tokyo.
Chillers bifurcate between high-efficiency magnetic-bearing units for air halls and compact skid exchangers for liquid districts. Monitoring software now grows fastest at roughly 17% CAGR, with Schneider Electric EcoStruxure IT and Vertiv Trellis trimming energy 10-15% via machine-learning set-point control. As liquid penetration deepens, the Asia-Pacific data center cooling market will progressively prize precision flow hardware over bulk air movers.
By Tier Type: Tier 4 Demands Premium Redundancy
Tier 3 sites accounted for 51.74% revenue in 2025 as they balance uptime and cost. However, the Asia-Pacific data center cooling market size for Tier 4 halls is climbing at 16.73% CAGR, propelled by banks, sovereign clouds, and healthcare firms that require 2N mechanical redundancy. Singapore’s financial sector mandates Tier 4 accreditation, sustaining Johnson Controls Sabroe sales despite land constraints.
Tier 1 and Tier 2 facilities serve price-sensitive edge loads using single-path DX units. Meanwhile, Tier 3 colocation suites upgrade to N+1 liquid readiness to court AI tenants, and Tier 4 campuses integrate waste-heat exports or district loops to neutralize high capex. Regulatory overlays such as ISO 22301 uphold demand for full mechanical duality within critical national infrastructure.
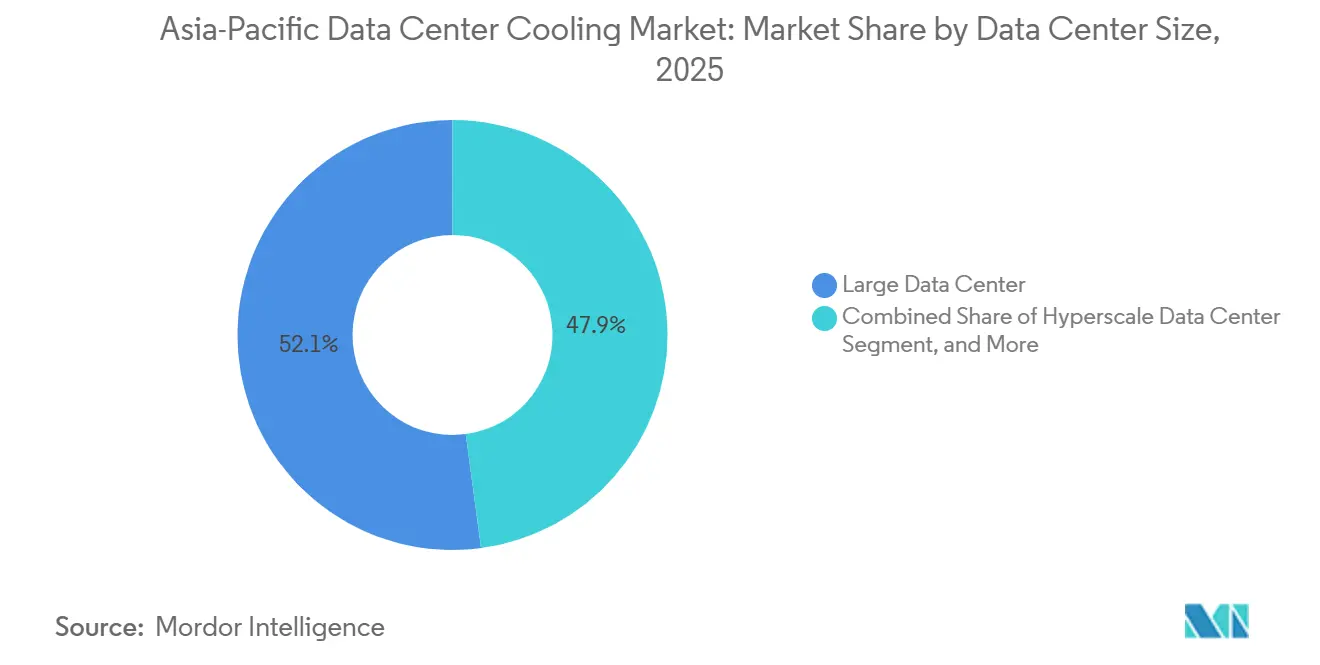
By Data Center Size: Hyperscale Campuses Lead Innovation
Large halls (10-50 MW) delivered 52.12% revenue in 2025, yet hyperscale facilities exceeding 100 MW now record a 16.54% CAGR through 2031. Vertiv’s hybrid cooling in Microsoft Hyderabad marries 8 kW air rows with 50 kW liquid aisles, optimizing spend per workload. Google’s Andhra Pradesh campus adopted six-month prefab blocks, favoring suppliers able to ship fully integrated skids.
Medium (1-10 MW) and small (< 1 MW) sites stay relevant for latency-sensitive and edge workloads, adopting standardized air kits with embedded analytics. Yet hyperscale demand dictates component roadmaps, funding R and D in district chilling, waste-heat resale, and immersion chemistries that will filter down to mid-tier estates over time.

By Data Center Type: Cloud Providers Outpace Colocation
Colocation retained 53.97% revenue in 2025, but vertically integrated hyperscalers are growing at 16.88% CAGR as AWS, Azure, Google Cloud, Alibaba Cloud, and Tencent Cloud design proprietary liquid systems tuned to workload mixes. AWS Osaka delivered evaporative towers achieving WUE 0.8 L/kWh, reflecting scale-driven custom engineering. In response, Equinix and Digital Realty now offer liquid-ready suites, though amortizing capex across mixed-density tenants remains challenging.
Enterprise and edge operators prize turnkey bundles that combine cooling, UPS, and monitoring in one warranty, often selecting Vertiv or Schneider Electric. The Asia-Pacific data center cooling industry therefore exhibits a barbell structure: bespoke high-density liquids at hyperscale and standardized air kits at the periphery.
Geography Analysis
China dominated the Asia-Pacific data center cooling market with 32.64% 2025 share, underpinned by NDRC mandates for PUE ≤ 1.3 and compulsory liquids above 8 kW per rack. Provincial incentives in Guangdong and Jiangsu catalyzed 180 MW of Alibaba and Tencent additions, while Huawei Digital Power’s FusionModule 2000 immersion kits proliferated across Shenzhen and Chengdu. Rising water stress in Beijing and Tianjin, however, is pushing capacity toward inland Wuhan, Xi’an, and Chongqing where land and power cost 30-40% less.
Japan held roughly 18% share, buoyed by METI tax credits that reimburse 20% of liquid-cooling capex and delivered rapid uptake at AirTrunk and NTT campuses. Land scarcity and seismic safety codes elevate prefabricated modules and magnetic-bearing chillers, keeping air and liquid in hybrid coexistence. South Korea’s K-Green certification enforces PUE ≤ 1.4 and 30% renewables, propelling Daikin and Delta Electronics shipments across Seoul and Busan.
India is the fastest-growing territory at a 16.97% CAGR, driven by USD 17.5 billion Microsoft Azure and USD 15 billion Google builds that will absorb one-fifth of regional chiller output by 2027. Stringent water codes in Maharashtra and Karnataka advance dry coolers and sealed immersion even at a 20% capex premium. Australia and New Zealand jointly hold 15% share; New South Wales imposes WUE < 1.2 L/kWh and Victoria enforces stormwater reuse, stimulating seawater exchangers at coastal sites and liquid loops inland.
Southeast Asia, led by Singapore, Malaysia, Thailand, Indonesia, and Vietnam, represents 22% combined share. Singapore’s SS 715:2025 caps PUE at 1.2 for new halls, while Malaysia’s latest EIA rules lengthen approval by up to 18 months, narrowing the regulatory-shopping window that once favored Johor Bahru. Labor scarcity, Thailand projects 15,000 HVAC technician shortfalls could restrain install velocity despite robust demand [MOL.GO.TH]. The region therefore offers outsized growth but requires skill-development programs and water-light technologies.
Competitive Landscape
Air cooling is an oligopoly; Vertiv, Schneider Electric, and Johnson Controls together hold roughly 60% share by leveraging installed-base contracts across 15-plus countries. Each is pivoting toward liquids—Vertiv launched Liebert DSE and XDU direct-to-chip lines, while Schneider Electric rolled out EcoStruxure Cooling Advisor with predictive analytics, blending incremental air retrofit revenue with greenfield liquid wins. Johnson Controls refreshed Sabroe chillers featuring AI load prediction for financial-sector Tier 4 halls.
Liquid cooling remains fragmented. Specialists such as Submer, Iceotope, and CoolIT bring immersion and precision loops, whereas Huawei Digital Power and Delta Electronics ride domestic scale to global bids. Green Revolution Cooling reports PUE 1.03 at Keppel Data Centres yet still faces OEM warranty hesitancy and limited dielectric-fluid workforce. Market white spaces cluster in edge micro-facilities, district chilled-water schemes like Singapore Tampines, and prefabricated blocks that cut schedule by two-thirds, a model Oracle adopted across Southeast Asia.
Strategic divergence is apparent: hyperscalers vertically integrate cooling IP to protect margins, colocation giants partner with incumbent OEMs for turnkey liquid suites, and enterprises choose standardized air kits bundled with five-year service. Competitive intensity will escalate as Chinese vendors export, immersion costs fall with scale, and AI workloads proliferate. Vendors lacking flow-control IP, dielectric chemistry expertise, or AI analytics risk margin compression in the Asia-Pacific data center cooling market.
Asia-Pacific Data Center Cooling Industry Leaders
Schneider Electric SE
Rittal GmbH & Co. KG
Vertiv Group Corp.
Mitsubishi Electric Corporation
STULZ GmbH
- *Disclaimer: Major Players sorted in no particular order

Recent Industry Developments
- February 2026: Schneider Electric announced a partnership with Tata Communications to roll out EcoStruxure prefabricated cooling modules across 15 Indian sites, cutting build time to six months and enabling direct-to-chip support for Azure and Google loads.
- January 2026: Vertiv introduced the Liebert XDU 60 kW direct-to-chip system and shipped 5,000 units to AirTrunk Tokyo and NTT Osaka, generating USD 150 million in revenue.
- December 2025: Huawei Digital Power won a USD 200 million order for FusionModule 2000 immersion systems at China Mobile’s 50 MW Guangdong AI hub.
- November 2025: Daikin Applied expanded its Thai plant by 40% to boost Magnitude chiller output for Oracle and STT GDC contracts.


Asia-Pacific Data Center Cooling Market Report Scope
Datacenter cooling encompasses the tools, techniques, and processes that maintain optimal temperatures in data centers. As data centers expand and their equipment becomes denser, the demand for energy-efficient cooling solutions intensifies. Moreover, the advantages of this technology, coupled with government-imposed efficiency regulations, are poised to drive the growth of the data center cooling market across diverse applications.
The Asia-Pacific Data Center Cooling Market Report is Segmented by Cooling Technology (Air-Based, and Liquid-Based), Cooling Component (CRAH/CRAC, Chillers and Heat Exchangers, Cooling Towers and Dry Coolers, Pumps and Valves, and Control and Monitoring Software), Tier Type (Tier 1 and 2, Tier 3, and Tier 4), Data Center Size (Small, Medium, Large, and Hyperscale), Data Center Type (Colocation, Hyperscalers/CSPs, and Enterprise and Edge), and Country (China, India, Japan, South Korea, Australia and New Zealand, and the Rest of Asia-Pacific). The Market Forecasts are Provided in Terms of Value (USD).
By Cooling Technology
| Air-Based Cooling | CRAH |
| Chiller and Economizer | |
| Cooling Tower (Direct, Indirect, Two-Stage) | |
| Others | |
| Liquid-Based Cooling | Immersion Cooling |
| Direct-to-Chip Cooling | |
| Rear-Door Heat Exchanger |
By Cooling Component
| Computer-Room Air Handlers (CRAH/CRAC) |
| Chillers and Heat-Exchanger Units |
| Cooling Towers and Dry Coolers |
| Pumps and Valves |
| Control and Monitoring Software |
By Tier Type
| Tier 1 and 2 |
| Tier 3 |
| Tier 4 |
By Data Center Size
| Small Data Center |
| Medium Data Center |
| Large Data Center |
| Hyperscale Data Center |
By Data Center Type
| Colocation Data Center |
| Hyperscalers Data Center/CSPs |
| Enterprise and Edge Data Center |
By Country
| China |
| Japan |
| India |
| South-Korea |
| Australia and New Zealand |
| Rest of Asia-Pacific |
| By Cooling Technology | Air-Based Cooling | CRAH |
| Chiller and Economizer | ||
| Cooling Tower (Direct, Indirect, Two-Stage) | ||
| Others | ||
| Liquid-Based Cooling | Immersion Cooling | |
| Direct-to-Chip Cooling | ||
| Rear-Door Heat Exchanger | ||
| By Cooling Component | Computer-Room Air Handlers (CRAH/CRAC) | |
| Chillers and Heat-Exchanger Units | ||
| Cooling Towers and Dry Coolers | ||
| Pumps and Valves | ||
| Control and Monitoring Software | ||
| By Tier Type | Tier 1 and 2 | |
| Tier 3 | ||
| Tier 4 | ||
| By Data Center Size | Small Data Center | |
| Medium Data Center | ||
| Large Data Center | ||
| Hyperscale Data Center | ||
| By Data Center Type | Colocation Data Center | |
| Hyperscalers Data Center/CSPs | ||
| Enterprise and Edge Data Center | ||
| By Country | China | |
| Japan | ||
| India | ||
| South-Korea | ||
| Australia and New Zealand | ||
| Rest of Asia-Pacific | ||


Key Questions Answered in the Report
How large will the Asia-Pacific data center cooling market be by 2031?
It is projected to reach USD 8.26 billion, expanding at a 15.09% CAGR from 2026 to 2031.
Which cooling technology is growing fastest in Asia-Pacific data centers?
Liquid-based solutions, including immersion and direct-to-chip, are forecast to rise at a 16.13% CAGR through 2031 as AI racks exceed 30 kW.
Why are India’s new hyperscale campuses important for regional cooling demand?
Microsoft’s and Google’s combined 350-MW programs will absorb 15-20% of Asia-Pacific chiller and pump production through 2027, accelerating component sales.
What regulatory factors influence data center cooling choices in China?
The NDRC mandates PUE ? 1.3 and enforces liquid cooling above 8 kW per rack, steering new builds toward immersion and direct-to-chip systems.
How do water-use restrictions affect cooling design in Australia and India?
Policies in New South Wales, Victoria, Maharashtra, and Karnataka cap water draw or require high recycling, pushing operators toward dry coolers and sealed immersion loops despite higher upfront costs.
Which vendors lead the liquid-cooling segment?
Specialists such as Submer, Iceotope, CoolIT, and ascending entrants Huawei Digital Power and Delta Electronics are capturing early liquid-cooling share across Asia-Pacific.
Page last updated on:


