United States Data Center Cooling Market Size and Share
Market Overview
| Study Period | 2020 - 2031 |
|---|---|
| Forecast Data Period | 2026 - 2031 |
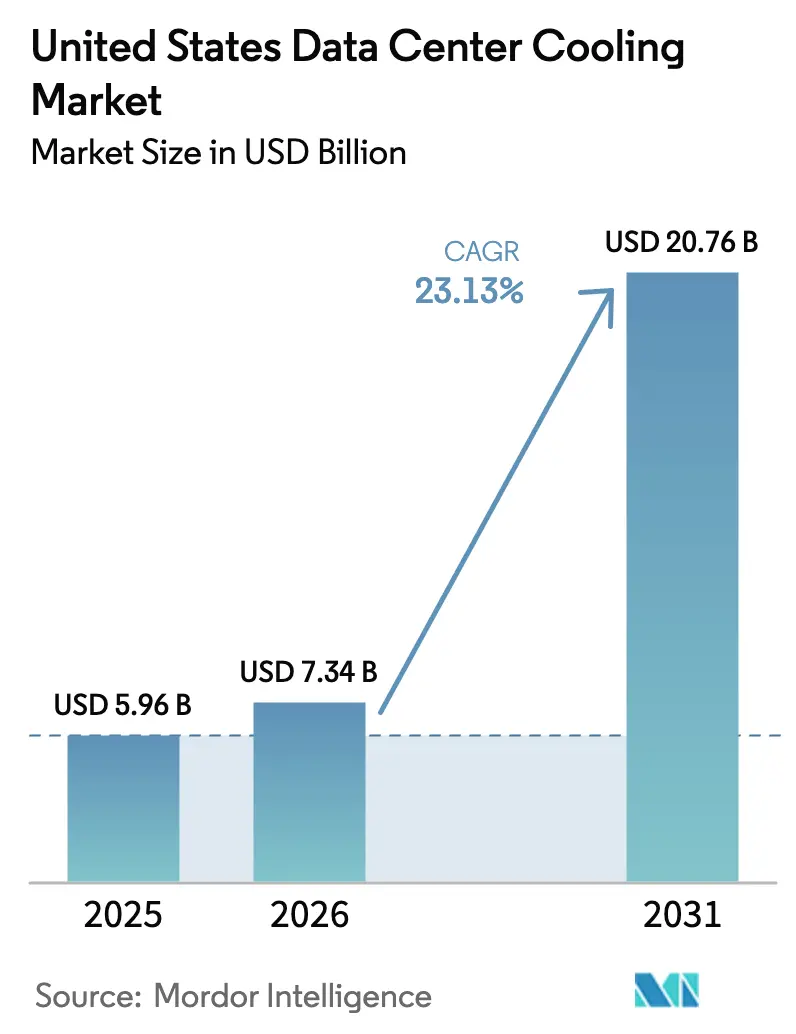
| Base Year Market Size (2025) | USD 5.96 Billion |
| Market Size (2026) | USD 7.34 Billion |
| Market Size (2031) | USD 20.76 Billion |
| Growth Rate (2026 - 2031) | 23.13% CAGR |
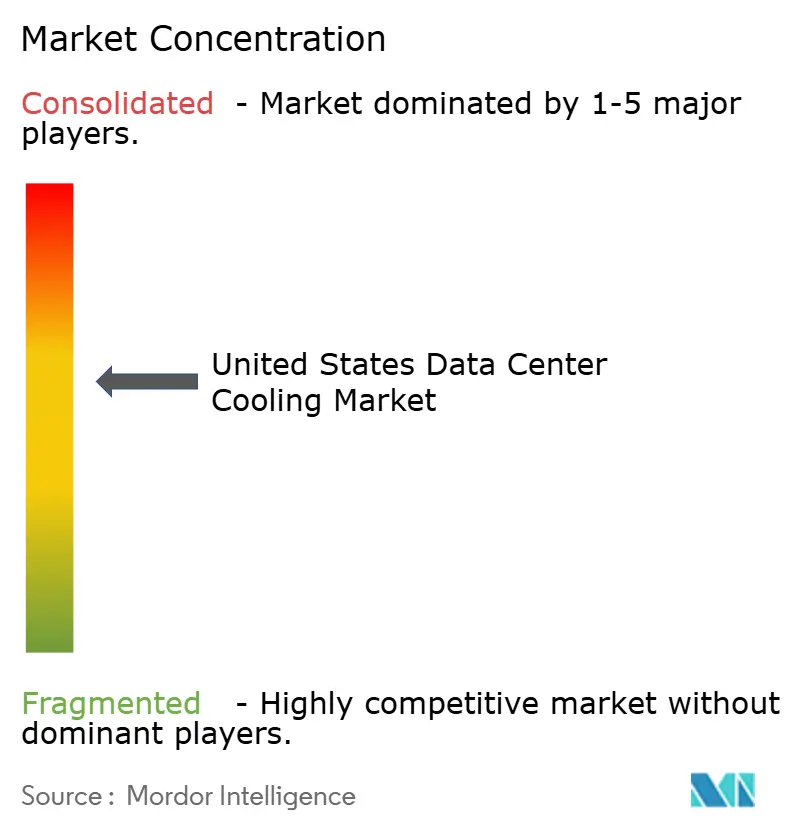
| Market Concentration | Medium |
Major Players *Disclaimer: Major Players sorted in no particular order Image © Mordor Intelligence. Reuse requires attribution under CC BY 4.0. | |
United States Data Center Cooling Market Analysis by Mordor Intelligence
United States data center cooling market size in 2026 is estimated at USD 7.34 billion, growing from 2025 value of USD 5.96 billion with 2031 projections showing USD 20.76 billion, growing at 23.13% CAGR over 2026-2031. Hyperscale operators are accelerating investments as AI workloads push rack densities beyond 50 kW, turning thermal performance into a design-limiting factor. Federal incentives under Section 179D, coupled with state rebates, lower upfront costs, and compressed payback periods, while corporate net-zero mandates shorten retrofit cycles to under a decade. Skills shortages in fluid handling and stricter water-use rules in Western states add cost and execution risk, yet also propel service revenues and drive innovation in water-neutral technologies. As a result, cooling now commands up to 35% of overall data-center capex, double its historical share.
Key Report Takeaways
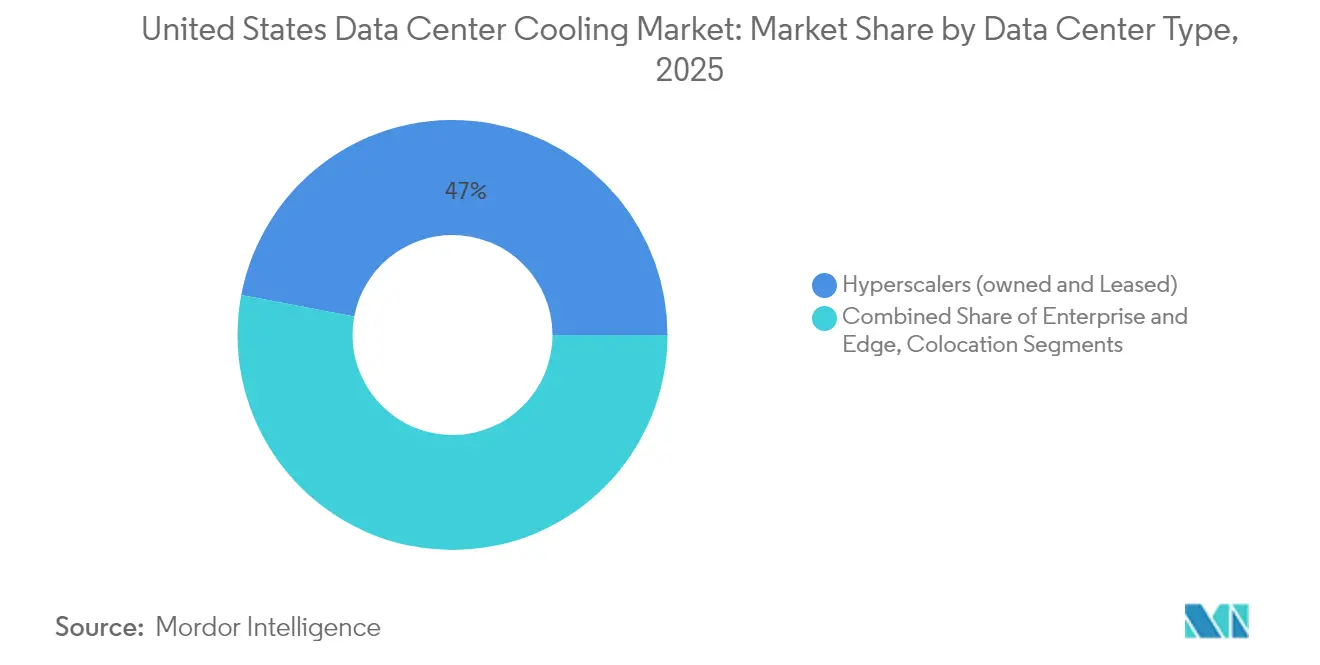
- By data-center type, hyperscalers led with 47.02% of the United States data center cooling market share in 2025 while growing at 24.98% CAGR through 2031.
- By tier, Tier 4 facilities recorded the fastest 24.61% CAGR, whereas Tier 3 kept 67.12% revenue share in 2025.
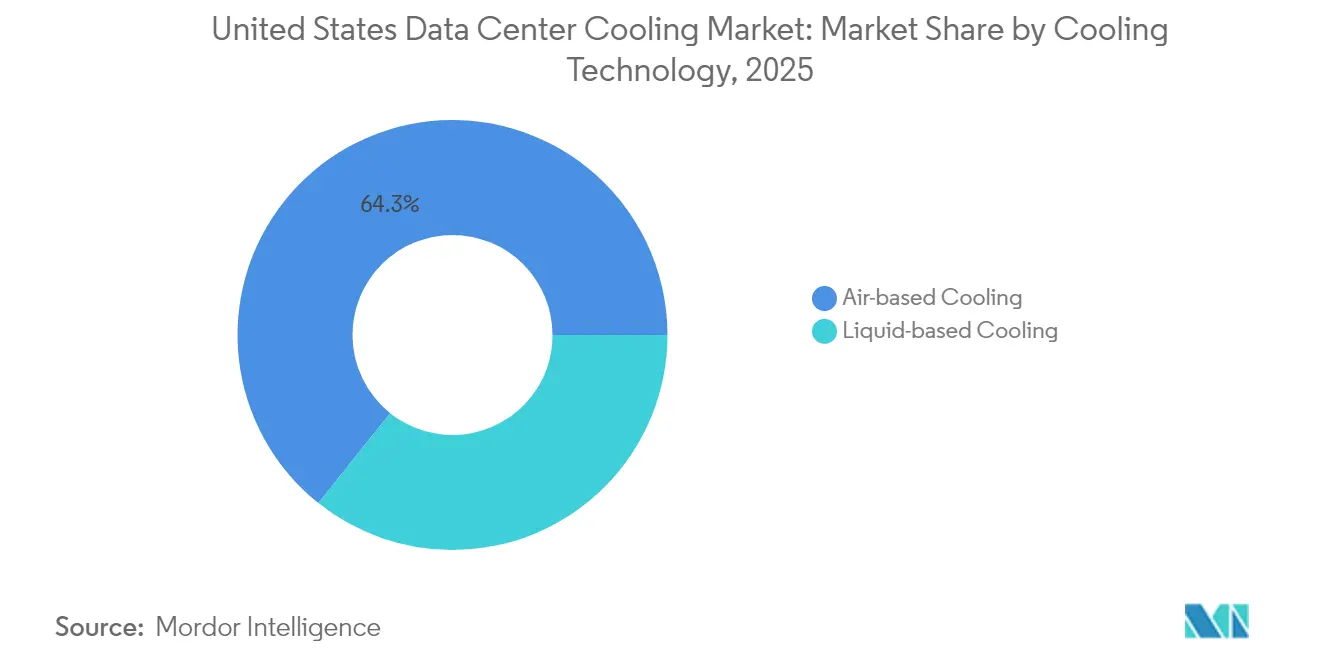
- By cooling technology, liquid solutions advanced at 23.12% CAGR as air systems retained 64.28% share.
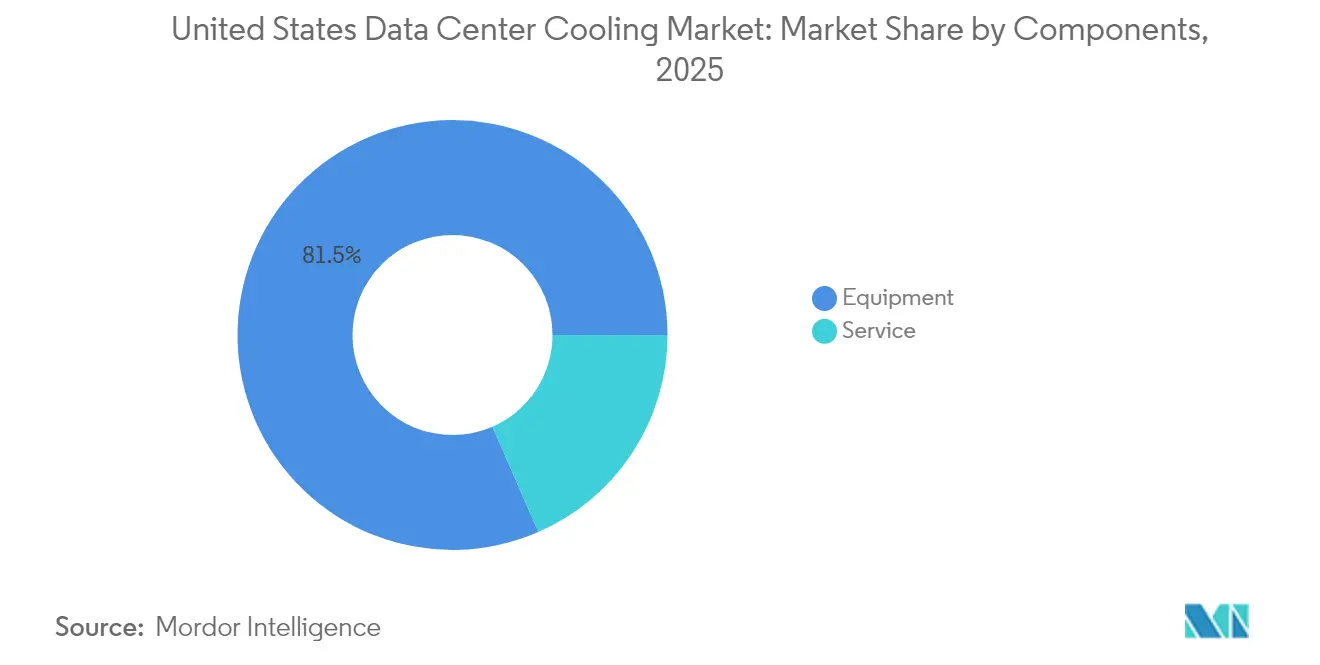
- By component, equipment accounted for 81.54% of the United States data center cooling market size in 2025, but services expanded at 23.68% CAGR to 2031.
Note: Market size and forecast figures in this report are generated using Mordor Intelligence’s proprietary estimation framework, updated with the latest available data and insights as of 2026.
United States Data Center Cooling Market Trends and Insights
Drivers Impact Analysis*
| Driver | (~) % Impact on CAGR Forecast | Geographic Relevance | Impact Timeline |
|---|---|---|---|
| Growing hyperscale build-outs driven by AI and HPC workloads | 8.5% | National, concentrated in Virginia, Texas, California | Long term (≥ 4 years) |
| Corporate-level net-zero commitments accelerating retrofit cycles | 4.2% | National, with early adoption in California, Washington | Medium term (2-4 years) |
| Federal tax incentives for energy-efficient HVAC equipment | 3.1% | National | Short term (≤ 2 years) |
| Edge-data-center roll-outs in Tier-2 metros | 2.8% | Emerging markets: Ohio, Iowa, Arizona, Mississippi | Medium term (2-4 years) |
| Growing availability of secondary heat-reuse of datacenter waste heat | 1.9% | Northern states with district heating infrastructure | Long term (≥ 4 years) |
| Pressure from insurance carriers to lower fire-risk drives switch to dielectric fluids | 1.5% | National, concentrated in high-value facilities | Short term (≤ 2 years) |
| Source: Mordor Intelligence | |||
Growing Hyperscale Build-outs Driven by AI and HPC Workloads
Exploding AI demand is propelling 50–100 kW rack densities, and hyperscalers are deploying production-scale liquid systems that can cost over USD 50,000 per rack. Microsoft rolled out immersion solutions across Azure regions as NVIDIA’s Blackwell chips breach 1,000 W power envelopes.[1]Microsoft, “Azure Data Center Innovation: Liquid Cooling at Scale,” microsoft.com Immersion platforms yield up to 70% energy savings against CRAC units, freeing electrical capacity for compute growth. Northern Virginia, Texas, and California have become thermal-management clusters where contractor expertise commands premium pricing, reshaping regional cost curves.
Corporate-level Net-zero Commitments Accelerating Retrofit Cycles
Sustainability pledges from Meta, Google, and others shorten cooling refresh horizons to seven-ten years. DeepMind’s AI-controlled chillers cut cooling energy up to 40% without hardware swaps.[2]Google LLC, “DeepMind AI Reduces Data Center Cooling Energy,” google.comYet retrofits risk multi-week outages; direct-to-chip upgrades on a 10 MW site can halt operations for two months, challenging 99.9% uptime targets. Prefabricated modules slash retrofit timelines by half, easing adoption hurdles.
Federal Tax Incentives for Energy-efficient HVAC Equipment
Section 179D allows immediate deductions up to USD 5.00 / sq ft, covering as much as 30% of advanced-cooling project costs. Inflation Reduction Act provisions widen eligibility for systems beating ASHRAE baselines by 25%. Colocation players pool multiple tenant projects to maximize credits, and suppliers such as Carrier are scaling capacity to meet demand.
Edge-data-center Roll-outs in Tier-2 Metros
Compass Datacenters’ USD 10 billion Mississippi build illustrates how secondary metros now attract large-scale edge infrastructure. Sites run 20–30 kW racks yet must operate semi-unmanned, so AI-driven thermal controls and waterless designs dominate Modular, factory-tested plant rooms minimize on-site labor and enable rapid commissioning in talent-scarce regions.
Restraints Impact Analysis*
| Restraint | (~)% Impact on CAGR Forecast | Geographic Relevance | Impact Timeline |
|---|---|---|---|
| Rising capex for liquid infrastructure (plumbing, manifolds) | -3.8% | National, acute in retrofit markets | Short term (≤ 2 years) |
| Skills shortage in fluid-handling and facilities engineering | -2.9% | National, severe in emerging markets | Medium term (2-4 years) |
| Environmental opposition to evaporative water use in drought-prone states | -1.7% | California, Arizona, Texas, Colorado, Utah | Medium term (2-4 years) |
| Supply-chain volatility of specialty coolants (PFAS-free fluids) | -1.1% | National, concentrated in liquid cooling deployments | Short term (≤ 2 years) |
| Source: Mordor Intelligence | |||
Rising Capex for Liquid Infrastructure (Plumbing, Manifolds)
Direct-to-chip retrofits can cost USD 3,000–5,000 per kW, triple air systems, with manifolds alone at USD 15,000–25,000 per rack.[3]Submer Technologies, “Total Cost of Ownership for Liquid Cooling,” submer.com Copper content is 3–4 × higher, exposing projects to commodity swings as global demand outpaces supply. Limited suppliers of PFAS-free fluids extend lead times, and labor rates vary up to 60% between primary and secondary metros.
Skills Shortage in Fluid-handling and Facilities Engineering
Fifty-eight percent of operators report difficulty hiring liquid-cooling specialists. Conventional HVAC technicians lack dielectric-fluid familiarity, pushing wages 30–50% above standard roles and inflating opex. Carrier’s plan to train 100,000 technicians will not meaningfully relieve the gap until 2027–2028. Edge deployments without local talent rely on costly fly-in crews, heightening downtime risk.
*Our forecasts treat driver/restraint impacts as directional, not additive. The impact forecasts reflect baseline growth, mix effects, and variable interactions.
Segment Analysis
By Data Center Type: Hyperscalers Drive AI Infrastructure Transformation
Hyperscalers secured 47.02% of the United States data center cooling market share in 2025 and are expanding at 24.98% CAGR as they adopt unproven liquid technologies ahead of enterprises. The United States data center cooling market size attributed to hyperscale environments is therefore positioned to rise sharply through 2031. Microsoft’s zero-water prototypes and Google’s immersion pilots underscore this early-adopter dynamic.
Enterprise and edge sites represent smaller footprints but significant aggregate demand as AI inference workloads decentralize. Colocation facilities now market turnkey liquid services, spreading capex across tenants and using modular equipment to swap between 15 kW enterprise racks and 80 kW AI clusters on demand. Cooling capability has thus become a core differentiator in colocation RFPs.


By Tier Type: Mission-critical Applications Demand Advanced Cooling
Tier 3 held 67.12% revenue during 2025, yet Tier 4 is the fastest-growing slice at 24.61% CAGR through 2031 as banks and hospitals secure 2N redundancy for AI diagnostics. The United States data center cooling market size for Tier 4 facilities will therefore outpace all other tiers despite its smaller base. N+2 or 2N liquid plants double capex but ensure uptime against pump or manifold failure.
Tier 1-2 sites dominate edge deployments where manageability tops efficiency. As operators chase unmanned designs, predictive leak detection and self-healing controls are becoming standard. Regulators in some states are weighing mandatory liquid systems for racks beyond 30 kW regardless of tier, which could accelerate adoption.
By Cooling Technology: Liquid Systems Gain Despite Infrastructure Barriers
Air solutions still hold 64.28% share but chip power density reaching 50 kW per rack forces a pivot toward liquid, which grows 23.12% CAGR. Direct-to-chip offers a phased pathway by reusing existing CRACs. Immersion delivers peak efficiency yet triggers complete mechanical redesigns.
Hybrid plants are emerging: elevated return temperatures integrate with cooling towers to reclaim waste heat while limiting water draw. PFAS-free fluids reduce regulatory risk ,though supply constraints persist. The United States data center cooling market continues to see vendors bundle AI optimization software that cuts energy 20–30% without hardware change, accelerating payback.
By Component: Services Growth Reflects Complexity Premium
Equipment generated 81.54% revenue in 2025, but services rise at 23.68% CAGR thanks to scarce technical skills. Predictive maintenance platforms use IoT sensors to anticipate leaks, transforming contracts from time-and-materials to performance-based structures, stabilizing customer budgets.
Installation backlogs widen as only a handful of companies can certify dielectric-fluid work. Projects in secondary metros can cost 40% more and run 12 weeks longer than identical scopes in Virginia. Remote monitoring allows centralized teams to oversee dispersed edge coolers, easing the talent crunch yet raising cybersecurity concerns around control systems.
Geography Analysis
Northern Virginia state legislators introduced 32 efficiency and water-transparency bills in 2024, signaling tighter oversight as power demand could double by 2040 . The concentration of engineering talent cuts installation time yet drives competition for scarce labor during construction peaks.
Texas and California comprise the second tier of demand. Texas leverages low-cost electricity but faces water scarcity; waterless closed-loop solutions therefore dominate new builds, as showcased by Edged’s 24 MW Irving site. California’s stringent environmental codes push operators toward high-efficiency liquid setups that achieve 30–40% energy savings and curb water usage, offsetting the state’s elevated power tariffs.
Competitive Landscape
Market consolidation is underway as legacy HVAC giants acquire specialist firms. Schneider Electric’s USD 850 million Motivair purchase expanded its liquid expertise overnight, signaling an integrated-platform strategy. Vertiv partners with NVIDIA on AI reference designs, shaping industry standards and locking in preferred architectures.
Disruptors such as CoolIT Systems and ZutaCore target niche AI loads with proprietary dielectric fluids or two-phase direct-to-chip modules that can halve footprint versus air chillers. IP around fluids and manifold design is now a key battleground, attracting lubricant majors like Castrol that bring chemical know-how into the sector.
United States Data Center Cooling Industry Leaders
Vertiv Group Corp.
Schneider Electric SE
Stulz GmbH
Johnson Controls International plc
Rittal GmbH & Co. KG
- *Disclaimer: Major Players sorted in no particular order

Recent Industry Developments
- May 2025: Chemours and Navin Fluorine signed a manufacturing pact for Opteon immersion fluid targeting 2026 launch, promising PUE near 1.0 for AI workloads.
- March 2025: Vertiv introduced CoolLoop Trim Cooler cutting annual cooling energy 70% and floor space 40%, ready for 40 °C water supply.
- February 2025: Carrier Global invested in ZutaCore to integrate direct-to-chip liquid cooling into its QuantumLeap suite as liquid solutions head toward USD 20 billion by 2029.
- January 2025: Edged Data Centers opened a 24 MW Irving, Texas site with zero-water cooling, using 74% less energy than legacy facilities.


United States Data Center Cooling Market Report Scope
Data center cooling is a set of techniques and technologies to maintain optimal operating temperatures in data center environments. This is important because data centers house many computer servers and network equipment that generate heat during operation. Efficient cooling systems are used to dissipate this heat and prevent equipment from overheating, ensuring continued reliable operation of the data center. Various methods, such as air conditioning, liquid cooling, and hot/cold aisle containment, are commonly used to control temperature and humidity in data centers.
The US data center cooling market is segmented by technology (air-based cooling (chiller and economizer, CRAH, cooling towers, and other technologies), liquid-based cooling (immersion cooling, direct-to-chip cooling, and rear-door heat exchanger)), type of data center (hyperscaler, enterprise, and colocation), and end-user industry (IT and telecom, retail and consumer goods, healthcare, media and entertainment, federal and institutional agencies, and other end-user industries).
| Hyperscalers (owned and Leased) |
| Enterprise and Edge |
| Colocation |
| Tier 1 and 2 |
| Tier 3 |
| Tier 4 |
| Air-based Cooling | Chiller and Economizer (DX Systems) |
| CRAH | |
| Cooling Tower (covers direct, indirect and two-stage cooling) | |
| Others | |
| Liquid-based Cooling | Immersion Cooling |
| Direct-to-Chip Cooling | |
| Rear-Door Heat Exchanger |
| By Service | Consulting and Training |
| Installation and Deployment | |
| Maintenance and Support | |
| By Equipment |
| By Data Center Type | Hyperscalers (owned and Leased) | |
| Enterprise and Edge | ||
| Colocation | ||
| By Tier Type | Tier 1 and 2 | |
| Tier 3 | ||
| Tier 4 | ||
| By Cooling Technology | Air-based Cooling | Chiller and Economizer (DX Systems) |
| CRAH | ||
| Cooling Tower (covers direct, indirect and two-stage cooling) | ||
| Others | ||
| Liquid-based Cooling | Immersion Cooling | |
| Direct-to-Chip Cooling | ||
| Rear-Door Heat Exchanger | ||
| By Component | By Service | Consulting and Training |
| Installation and Deployment | ||
| Maintenance and Support | ||
| By Equipment | ||


Key Questions Answered in the Report
What is the current value of the United States data center cooling market?
It stands at USD 7.34 billion in 2026 and is projected to reach USD 20.76 billion by 2031, growing at a 23.13% CAGR.
Why are Hyperscaler pivotal to cooling demand?
Hyperscalers hold 47.02% market share and deploy 50-100 kW racks for AI training, making liquid cooling a necessity and driving technology adoption.
How do Section 179D incentives influence cooling projects?
They allow up to USD 5.00 / sq ft in immediate deductions, covering 20–30% of advanced-cooling capex and accelerating retrofit paybacks.
What regions are seeing emerging demand beyond Northern Virginia?
Texas, California, Ohio, Iowa, Arizona, and Mississippi are attracting new builds due to land availability, power capacity, and tailored state incentives.
Page last updated on:


