Market Overview
| Study Period | 2020 - 2031 |
|---|---|
| Forecast Data Period | 2026 - 2031 |
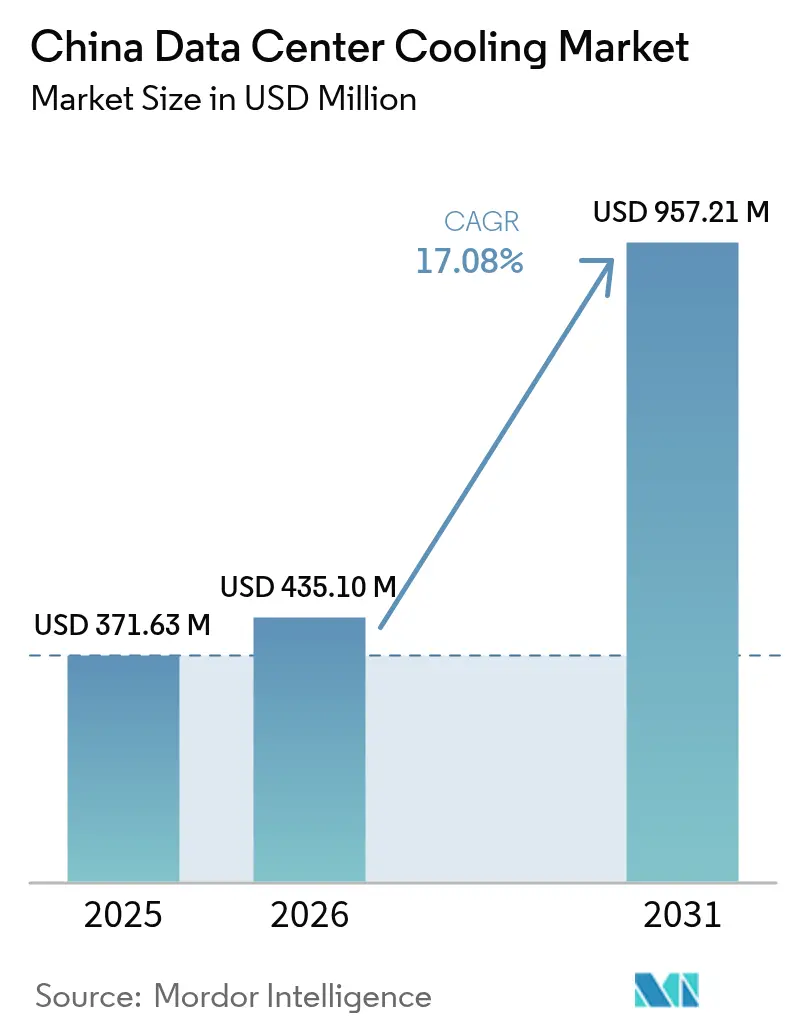
| Base Year Market Size (2025) | USD 371.63 Million |
| Market Size (2026) | USD 435.1 Million |
| Market Size (2031) | USD 957.21 Million |
| Growth Rate (2026 - 2031) | 17.08% CAGR |
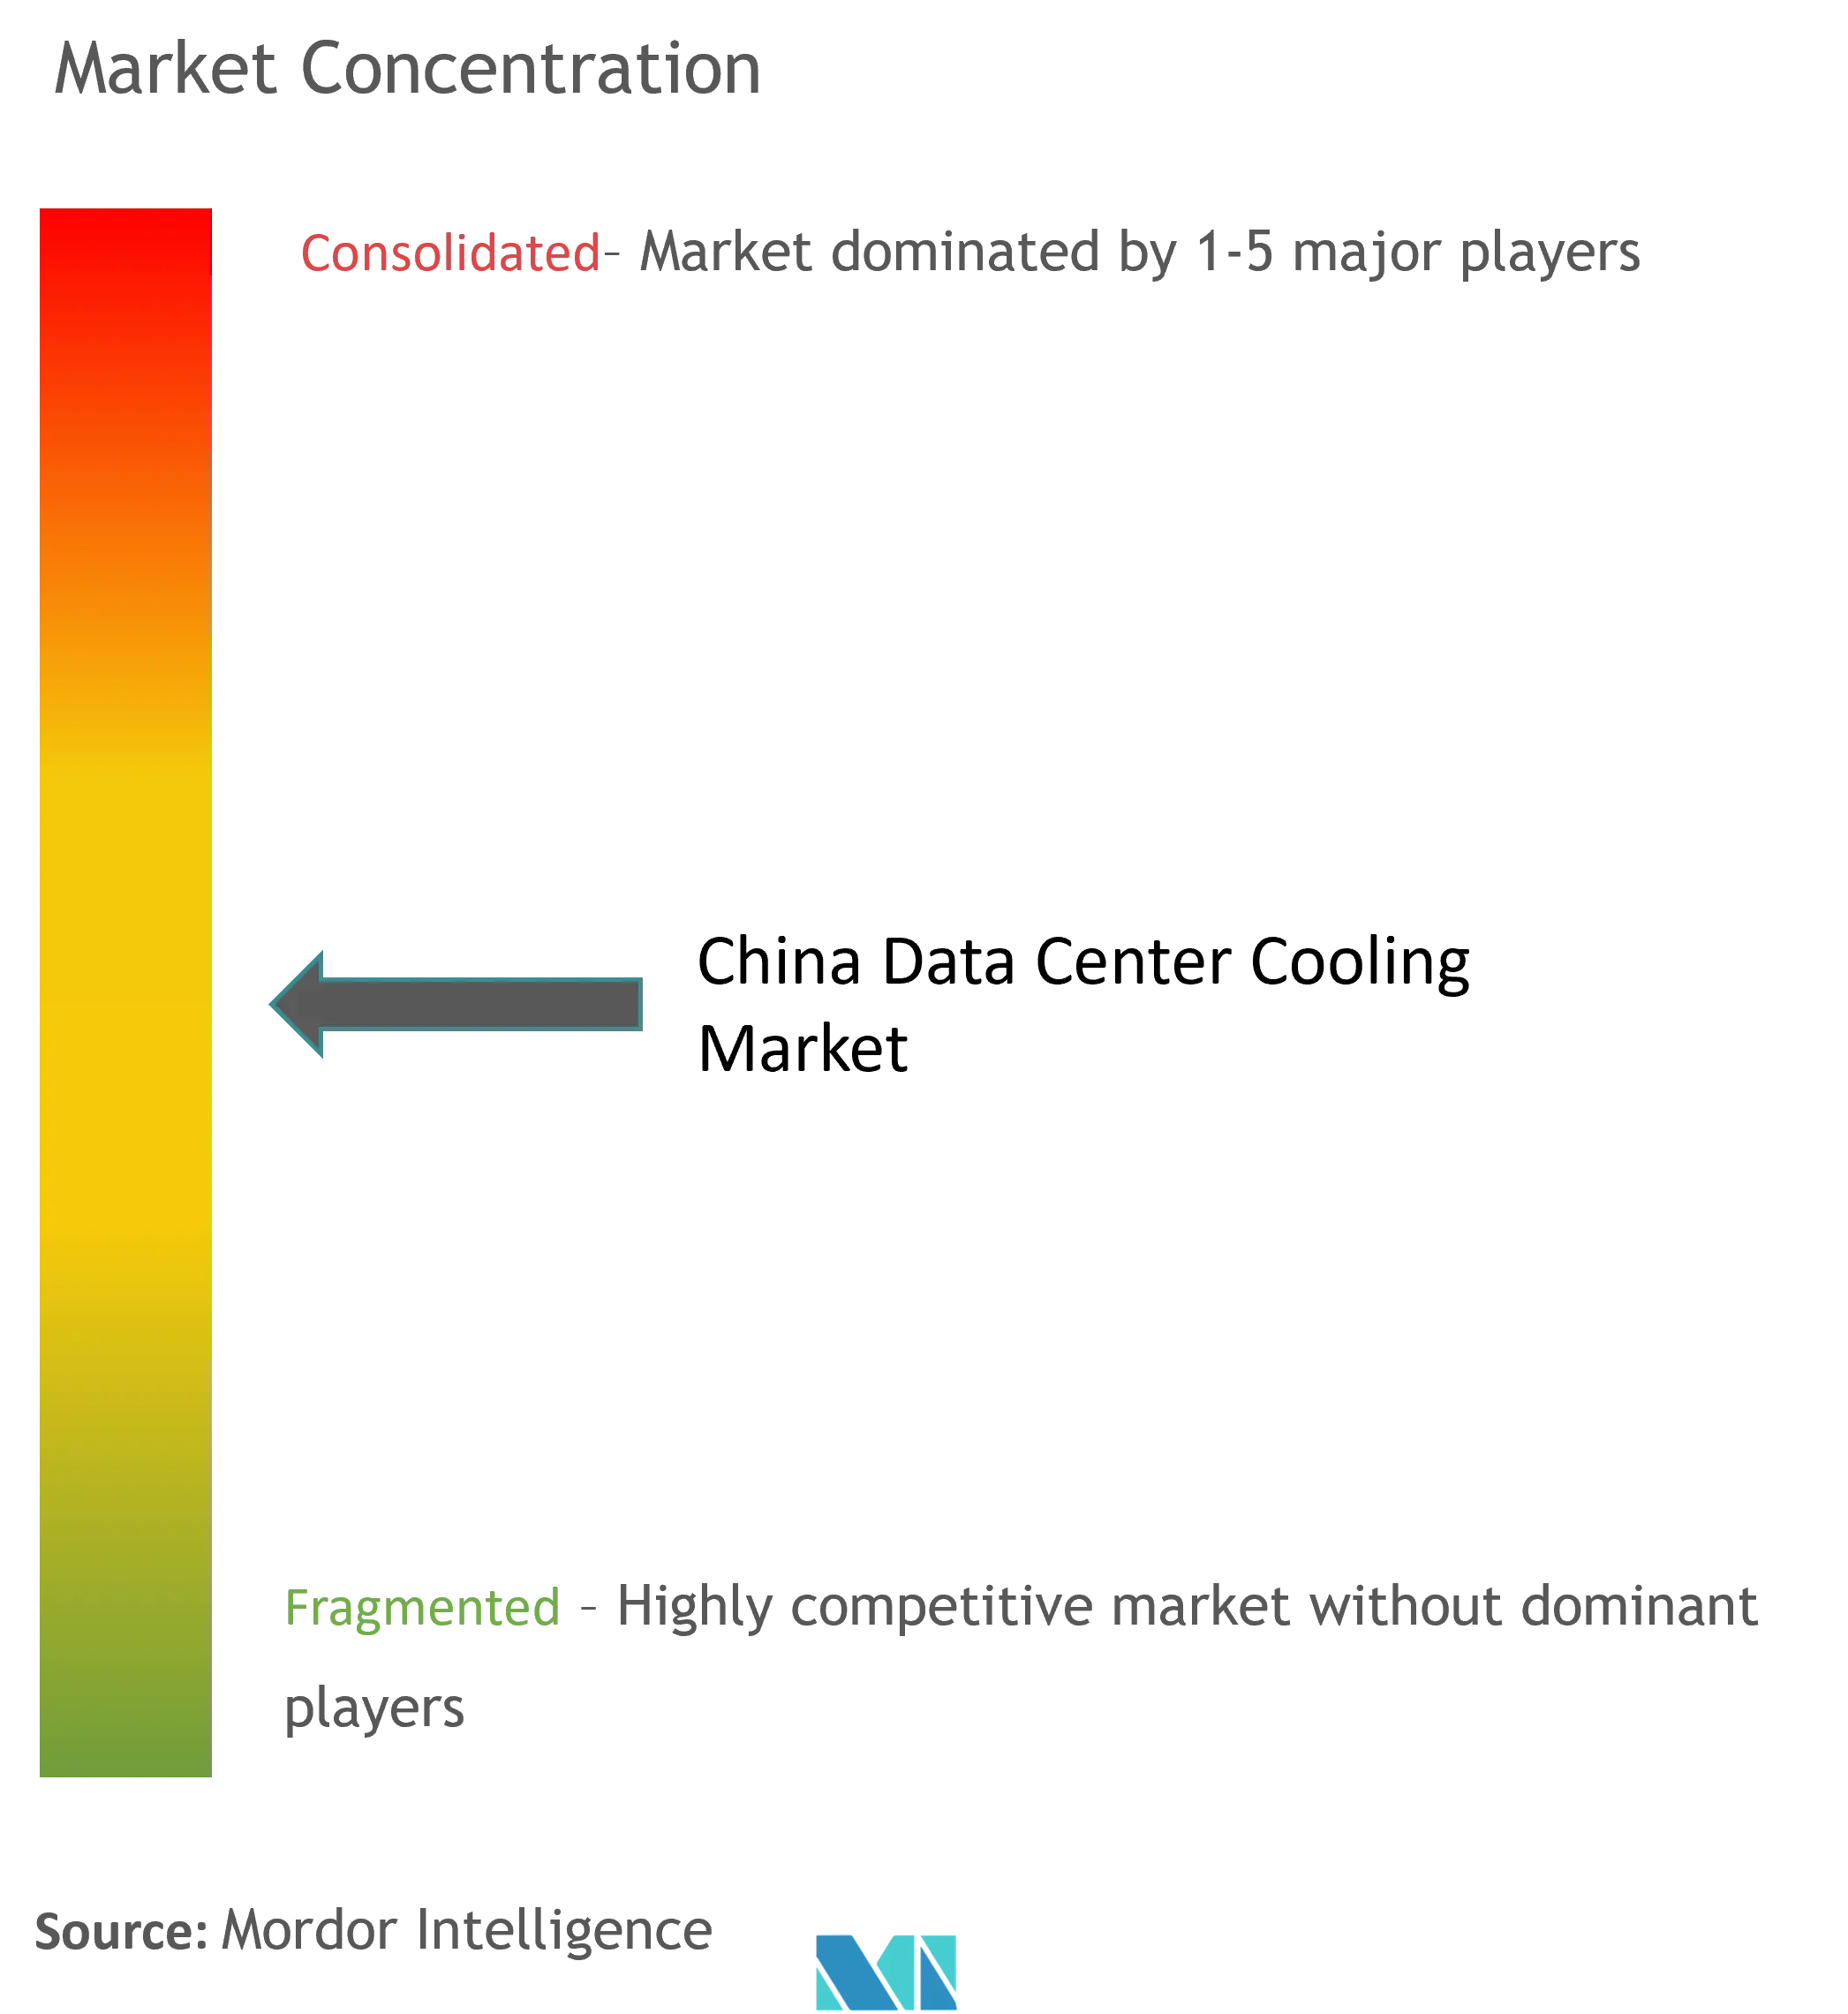
| Market Concentration | Medium |
Major Players *Disclaimer: Major Players sorted in no particular order Image © Mordor Intelligence. Reuse requires attribution under CC BY 4.0. | |
China Data Center Cooling Market Analysis by Mordor Intelligence
The China data center cooling market size is expected to grow from USD 371.63 million in 2025 to USD 435.1 million in 2026 and is forecast to reach USD 957.21 million by 2031 at 17.08% CAGR over 2026-2031. Mandatory Power Usage Effectiveness (PUE) caps, surging AI server rack densities that dissipate 6-8 times more heat than legacy workloads, and the government’s Eastern Data and Western Compute program are converging to accelerate capital outlays for liquid-based cooling. Operators are prioritizing technology that keeps PUE below 1.3 in Tier 1 cities, driving a pivot away from conventional air systems toward direct-to-chip, immersion, and rear-door liquid solutions. At the same time, water-stress regulations are pushing closed-loop designs that minimise consumption while maximising thermal efficiency. Although equipment sales still dominate spending, demand for specialised services is climbing fast as facility owners seek expertise to retrofit or green-field liquid deployments.
Key Report Takeaways
- By data center type, hyperscalers led with 46.02% of China data center cooling market share in 2025, while the segment is projected to expand at 17.62% CAGR through 2031.
- By tier type, Tier 3 facilities held 66.55% share of the China data center cooling market size in 2025; Tier 4 sites are forecast to grow the fastest at 18.83% CAGR to 2031.
- By cooling technology, air-based systems commanded 62.95% revenue share in 2025, whereas liquid-based solutions are advancing at an 17.92% CAGR through 2031.
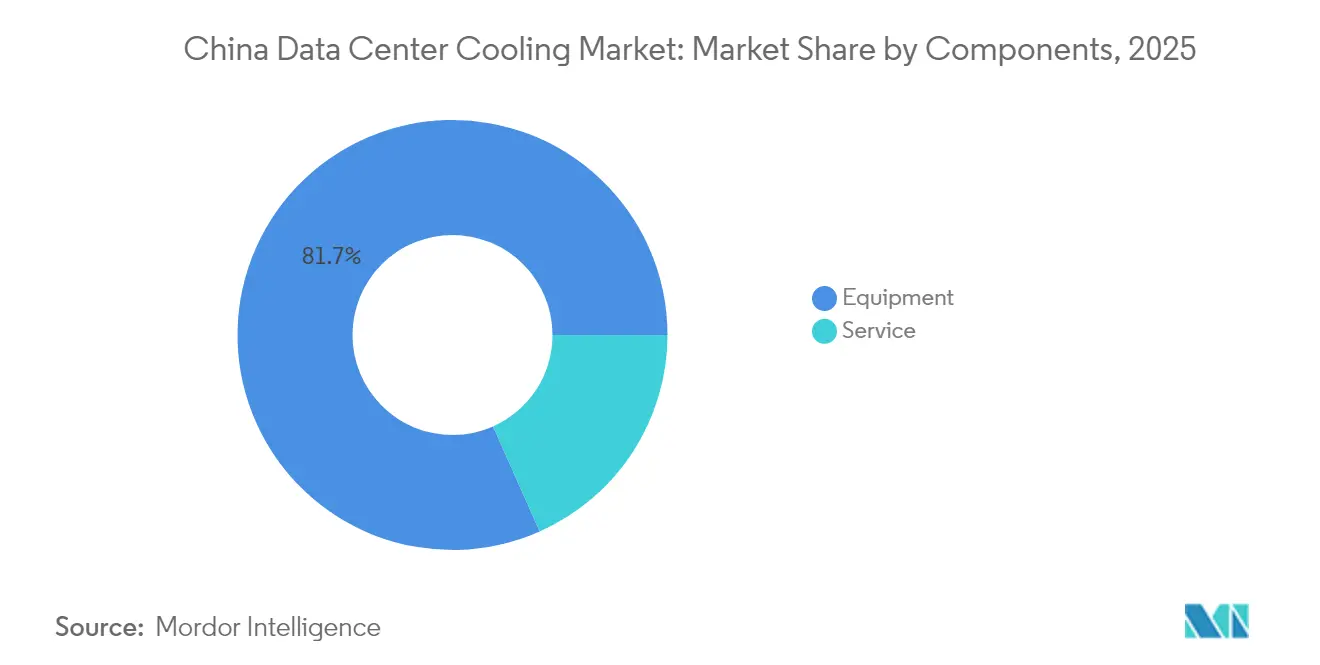
- By component, equipment accounted for 81.65% of the China data center cooling market size in 2025, while services are set to register an 18.21% CAGR between 2026-2031.
Note: Market size and forecast figures in this report are generated using Mordor Intelligence’s proprietary estimation framework, updated with the latest available data and insights as of 2026.
China Data Center Cooling Market Trends and Insights
Drivers Impact Analysis*
| Driver | (~) % Impact on CAGR Forecast | Geographic Relevance | Impact Timeline |
|---|---|---|---|
| Surging hyperscale and AI-driven rack densities | +4.2% | National, concentrated in Beijing, Shanghai, Guangzhou | Short term (≤ 2 years) |
| Government-mandated PUE caps for new builds | +3.1% | National, strictest in Tier 1 cities | Medium term (2-4 years) |
| Rapid colocation expansion (+51.7% rack share YoY) | +2.8% | National, with early gains in Beijing, Shanghai, Shenzhen | Medium term (2-4 years) |
| Maturing liquid-cooling supply chain and local OEM scale-up | +2.3% | National, manufacturing hubs in Guangdong, Jiangsu | Long term (≥ 4 years) |
| Eastern Data and Western Compute programme exploiting cold-climate free-cooling zones | +1.9% | Western regions: Inner Mongolia, Xinjiang, Gansu | Long term (≥ 4 years) |
| Monetisation of server waste-heat into district-heating grids | +1.2% | Northern China: Beijing, Harbin, Hohhot | Long term (≥ 4 years) |
| Source: Mordor Intelligence | |||
Surging hyperscale and AI-driven rack densities
Modern AI cabinets consume 20-130 kW versus 5-10 kW for legacy servers, rendering air cooling insufficient and propelling mass adoption of liquid technologies. Huawei’s closed liquid-cooled cabinet cuts cooling power by 96% and lowers facility PUE to 1.1, proving viability at the hyperscale level.[1]Huawei Technologies, “Next-Generation Liquid-Cooled Cabinet Solution,” huawei.com National flagship AI compute clusters in Gui’an, Ulanqab, and Wuhu now specify liquid solutions at the build-out stage, underscoring a structural shift that places thermal design on par with chip performance in data-center planning.
Government-mandated PUE caps for new builds
Beijing’s 14th Five-Year plan requires all new data centers to operate below 1.5 PUE by 2025, while Shanghai tightens the threshold to 1.3. The 2023 Green Data Center standard expands compliance to water-consumption ratios and renewable-energy sourcing, cementing liquid cooling as the only practical route to meet efficiency targets at scale.[2] Ministry of Industry and Information Technology, “Guidelines for Data-Center Energy Efficiency,” gov.cn
Rapid colocation expansion
GDS Holdings booked a 17.7% YoY revenue increase to RMB 2.97 billion (USD 416 million) in Q3 2024, citing accelerated tenant migrations and multi-tenant AI clusters. Colocation providers leverage scale to amortise high-end liquid systems while offering differentiated cooling SLAs that attract hyperscaler tenants, reinforcing a virtuous cycle of density and efficiency gains.
Maturing liquid-cooling supply chain and local OEM scale-up
Chemours’ 2025 pact with Navin Fluorine localises production of Opteon two-phase fluids, mitigating tariff risk and lowering cost barriers for domestic adopters.[3]Chemours, “Chemours and Navin Fluorine to Produce Opteon™ Immersion Fluid in China,” chemours.com Parallel investments by firms such as Envicool and Yimikang are shortening lead times for pumps, manifolds, and heat exchangers, giving Chinese operators strategic autonomy in critical cooling components.
Restraints Impact Analysis*
| Restraint | (~)% Impact on CAGR Forecast | Geographic Relevance | Impact Timeline |
|---|---|---|---|
| High electricity tariffs eroding TCO advantages | -2.1% | National, particularly acute in eastern coastal regions | Medium term (2-4 years) |
| Growing water-stress curbing evaporative-cooling permits | -1.8% | Northern and western China, Beijing-Tianjin-Hebei region | Long term (≥ 4 years) |
| Provincial power-quota caps delaying hyperscale projects | -1.5% | Eastern provinces: Jiangsu, Zhejiang, Guangdong | Short term (≤ 2 years) |
| Import dependency on fluorinated coolants facing tariff risk | -1.2% | National, supply chain concentrated in coastal ports | Medium term (2-4 years) |
| Source: Mordor Intelligence | |||
High electricity tariffs eroding TCO advantages
Data center power draw is expected to climb from 200 TWh in 2025 toward 400-600 TWh by 2030, with tariffs in Jiangsu and Zhejiang raising operating costs enough to negate savings from legacy equipment depreciation. The Eastern Data and Western Compute initiative counterbalances the burden by relocating load to renewable-rich provinces but requires operators to reconcile latency and fibre-backhaul constraints.
Growing water-stress curbing evaporative-cooling permits
Annual water demand from Chinese data centers could exceed 3 billion m³ by 2030, straining already dry river basins that host three-quarters of national rack capacity. Municipal authorities are therefore refusing new evaporative-tower permits and encouraging closed-loop or seawater solutions; China’s Hainan offshore data center demonstrates the shift, using natural seawater to cool high-density AI racks.
*Our forecasts treat driver/restraint impacts as directional, not additive. The impact forecasts reflect baseline growth, mix effects, and variable interactions.
Segment Analysis
By Data Center Type: Hyperscalers accelerate liquid upgrades
Hyperscalers accounted for 46.02% of 2025 revenue, and their contribution to the China data center cooling market size is forecast to expand at 17.62% CAGR through 2031. These firms build AI clusters that exceed 100 kW per rack, making liquid technology non-negotiable for thermal headroom and PUE compliance. Their scale also drives down per-rack cooling cost, creating a benchmark that enterprise and edge operators now emulate. Edge sites, however, favour compact rear-door heat exchangers due to space and maintenance limits. The hyperscaler wave ensures that liquid infrastructure will dominate new capacity additions, even though air systems retain a retrofit niche.
Colocation operators mirror this trajectory by bundling dedicated liquid zones as premium services, converting density into both margin and differentiated customer experience. Enterprise facilities lag on full immersion adoption but are piloting direct-to-chip loops to stretch existing chiller plants. Combined, these moves keep the China data center cooling market on a high-growth path as every operator segment advances toward AI-ready thermal architectures.


By Tier Type: Tier 4 construction gains share despite Tier 3 dominance
Tier 3 sites captured 66.55% of spending in 2025 thanks to their mature design frameworks and competitive balance of uptime vs. capex. Yet Tier 4 builds are growing at 18.83% CAGR because AI training workloads cannot afford even minutes of unplanned downtime. The China data center cooling market size for Tier 4 facilities will therefore rise swiftly as investors prioritise fault-tolerant, concurrently maintainable liquid systems that keep racks within 30 °C even during maintenance.
Tier 1 and Tier 2 footprints are steadily cannibalised as their power and cooling envelopes top out below 15 kW per rack. Meanwhile, Tier 3 specifications are being retrofitted with dual-loop liquid infrastructure so operators can satisfy new customer density requirements without a green-field Tier 4 budget. This tier evolution reinforces liquid technology as the baseline for any AI-centric build in China’s data center cooling market.
By Cooling Technology: Liquid systems close the gap on air incumbents
Air technologies still held 62.95% revenue share in 2025, but liquid methods are slated to capture the lion’s share of new capacity given their 17.92% CAGR forecast. Direct-to-chip loops remove up to 80% of server heat at the source, while immersion baths are driving PUE to near-1.0 levels in purpose-built AI pods. Rear-door heat exchangers, which require minimal floor reconfiguration, bridge legacy rooms into the liquid era and thus soften migration hurdles.
Within the remaining air segment, indirect evaporative and two-stage economisers maximise free-cooling hours in north-western provinces where annual mean temperatures stay below 10 °C. However, looming water-use limits underpin an inexorable shift toward sealed liquid circuits nationwide. Consequently, liquid adoption has become the central storyline shaping competitive dynamics and vendor R&D in the China data center cooling market.

By Component: Services boom alongside equipment leadership
Equipment purchases represented 81.65% of spend in 2025, reflecting the capital-intensive nature of chillers, CDUs, manifolds, and heat exchangers. As operators mature, however, services are climbing at an 18.21% CAGR, transforming the revenue mix. Consulting teams now blueprint fluid chemistry, fail-over logic, and future density headroom, while field engineers manage the precise commissioning that liquid networks demand.
Predictive maintenance contracts that utilise continuous coolant-quality monitoring and leak detection are becoming standard service upsells. Training programmes covering dielectric-fluid handling and emergency response have become mandatory for operating permits in Tier 1 cities. Together, these service layers lock in recurring revenue streams for vendors and reinforce customer reliance on specialised expertise, anchoring long-term growth within the China data center cooling market.
Geography Analysis
China’s cooling demand is undergoing a major east-to-west realignment. Ningxia, Gansu, and Inner Mongolia clusters leverage desert solar and sub-zero winters to achieve year-round free cooling, helping regional facilities post PUE readings near 1.2 without resorting to water-intensive towers. Inner Mongolia alone plans to triple rack counts to 720,000 by 2025, carving out a sizeable share of future China data center cooling market additions.
Nonetheless, Beijing, Shanghai, and Guangzhou still host the bulk of hyperscale footprint because of low-latency requirements. These cities suffer summer wet-bulb temperatures above 28 °C, forcing operators to adopt closed-loop liquid systems and invest in recycled water plants to respect municipal withdrawal caps. Shanghai’s sub-1.3 PUE mandate led multiple providers to retrofit direct-to-chip loops in 2024, pre-figuring a broader coastal transition that will amplify demand for advanced fluid technologies Tencent Cloud.
Coastal innovation continues with underwater data centers off Hainan, where seawater-based conduction cools AI racks processing 7,000 queries per second. Simultaneously, Tibet’s 3,600-metre-altitude facility in Lhasa exploits low ambient air to host disaster-recovery workloads for national banks. These geographic experiments underline the diversity of operating environments that vendors must address to win in the China data center cooling market.
Competitive Landscape
Competition is intensifying as global incumbents clash with agile domestic challengers. Vertiv and Schneider Electric leverage long-standing channel networks, yet Chinese firms such as Huawei, Envicool, and Yimikang are closing technology gaps and winning on localisation, shorter lead times, and cost advantages. Schneider’s 2025 reference designs with NVIDIA that scale to 132 kW per rack illustrate how established brands are sharpening their AI value proposition.
Huawei’s liquid-cooled cabinet platforms show domestic R&D parity—achieving 1.1 PUE while slashing cooling power 96%—thereby redefining performance benchmarks. Envicool’s modular CDU lines, produced entirely in Guangdong, reduce delivery cycles to under four weeks for local customers, a speed advantage few foreign rivals can match. Meanwhile, Chemours’ immersion-fluid localisation deal signals multinationals’ willingness to partner rather than only export into the China data center cooling market.
China Data Center Cooling Industry Leaders
Schneider Electric SE
Johnson Controls International plc
GIGA-BYTE Technology Co. Ltd.
Vertiv Group Corp.
Carrier Global Corporation
- *Disclaimer: Major Players sorted in no particular order

Recent Industry Developments
- June 2025: China signed an agreement for the world’s first offshore wind-powered underwater data center, combining renewable electricity with seawater cooling.
- May 2025: Chemours partnered with Navin Fluorine to localise Opteon™ two-phase immersion fluid for 2026 roll-out.
- April 2025: Vertiv reported 25% revenue growth to USD 2.04 billion, with Asia-Pacific organic growth of 36%.
- March 2025: Schneider Electric unveiled NVIDIA-joint reference designs for 132 kW liquid-cooled AI racks.


Research Methodology Framework and Report Scope
Market Definitions and Key Coverage
Our study defines the China data center cooling market as all hardware, fluids, and supporting services that remove or transfer heat from operational IT equipment housed in purpose-built or retrofit data centers, measured in revenue earned inside mainland China. Cooling formats covered include computer-room air handlers, chillers, containment layouts, pumped refrigerant systems, direct-to-chip loops, and full-immersion solutions.
Scope Exclusion: Portable spot coolers, building-wide HVAC that is not dedicated to IT rooms, and aftermarket spare-parts sales are outside our numbers.
Segmentation Overview
- By Data Center Type
- Hyperscalers (owned and Leased)
- Enterprise and Edge
- Colocation
- By Tier Type
- Tier 1 and 2
- Tier 3
- Tier 4
- By Cooling Technology
- Air-based Cooling
- Chiller and Economizer (DX Systems)
- CRAH
- Cooling Tower (covers direct, indirect and two-stage cooling)
- Others
- Liquid-based Cooling
- Immersion Cooling
- Direct-to-Chip Cooling
- Rear-Door Heat Exchanger
- Air-based Cooling
- By Component
- By Service
- Consulting and Training
- Installation and Deployment
- Maintenance and Support
- By Equipment
- By Service
Detailed Research Methodology and Data Validation
Primary Research
Mordor analysts held structured interviews with cooling-system OEM engineers, colocation facility managers in Beijing-Tianjin, and hyperscale design consultants in Jiangsu. The conversations validated airflow design changes, liquid-cooling pilot uptake, and average service margins, letting us close gaps left by public data.
Desk Research
We began by mapping the installed base of Chinese data centers through sources such as MIIT data-center filings, provincial construction permits, the China Internet Network Information Center, and green data-center lists issued by the Ministry of Industry and Information Technology. Trade association briefs from ODCC and the China Refrigeration and Air-Conditioning Industry Association provided typical rack densities and PUE benchmarks. Company 10-Ks, IPO prospectuses, and customs shipment data from Volza filled cost curves and import ratios, while Dow Jones Factiva tracked new site announcements. These sources illustrate trends, yet are not exhaustive; many additional public and subscription datasets informed our view.
Market-Sizing & Forecasting
We used a top-down build based on total IT floor space (m²) and average cooling spend per square meter, reconstructed from construction completions and equipment import data, which are then cross-checked with selective bottom-up samples of supplier shipments and channel ASP×volume. Key variables like average rack power (kW), mandated PUE caps, hyperscale capacity additions, liquid-cooling penetration, and yuan-denominated equipment ASP trends drive the model. A multivariate regression on these variables, tempered by scenario analysis for policy or power-price shocks, underpins the 2025-2030 outlook. Where bottom-up rolls diverged beyond ±7%, assumptions were revisited with interviewees before locking the baseline.
Data Validation & Update Cycle
Every draft dataset passes a two-step analyst review: automated variance flags versus historical series and peer benchmarks, followed by senior analyst sign-off. Reports refresh annually, and we trigger interim updates if policy changes, major fab fires, or >200 MW of new hyperscale builds alter demand fundamentals.
Why Mordor's China Data Center Cooling Baseline Is Trusted Nationwide
Published estimates vary because firms pick different product baskets, forecast cadences, and ASP ladders.
Our disciplined variable set, tight geographic filter, and annual refresh ensure a figure executives can track with confidence.
Benchmark comparison
| Market Size | Anonymized source | Primary gap driver |
|---|---|---|
| USD 371.63 M (2025) | Mordor Intelligence | - |
| USD 1.87 B (2024) | Global Consultancy A | Includes building HVAC and retrofit spare parts; five-year refresh cycle |
| USD 4.20 B (2024) | Industry Outlook B | Applies global ASP to China volumes and omits yuan-to-USD currency timing adjustments |
The comparison shows how broader scopes and older pricing inflate rival totals, whereas our China-only, current-year, interview-validated approach delivers a balanced baseline that policymakers and vendors alike deem dependable.


Key Questions Answered in the Report
What is the current size of the China data center cooling market and how fast is it growing?
The market stands at USD 435.1 million in 2026 and is projected to climb to USD 957.21 million by 2031, reflecting a 17.08% CAGR over the forecast period.
Why are operators in China shifting from air-based to liquid-based cooling?
AI server cabinets now dissipate 6-8 times more heat than traditional workloads, pushing PUE targets below 1.3 in Tier 1 cities; liquid cooling handles these thermal loads far more efficiently than legacy air systems.
Which data-center segment is expanding the fastest?
Tier 4 facilities are growing at a 18.83% CAGR because fault-tolerant designs and liquid systems are essential for uninterrupted AI training workloads that can exceed 100 kW per rack.
What regional trend is reshaping demand for cooling solutions?
The Eastern Data and Western Compute program is relocating capacity to cooler, renewable-rich western provinces such as Ningxia and Inner Mongolia, where free-cooling hours are abundant and liquid systems can operate at even higher efficiency.
Page last updated on:


