Artificial Intelligence (AI) Data Center Market Size and Share
Market Overview
| Study Period | 2020 - 2031 |
|---|---|
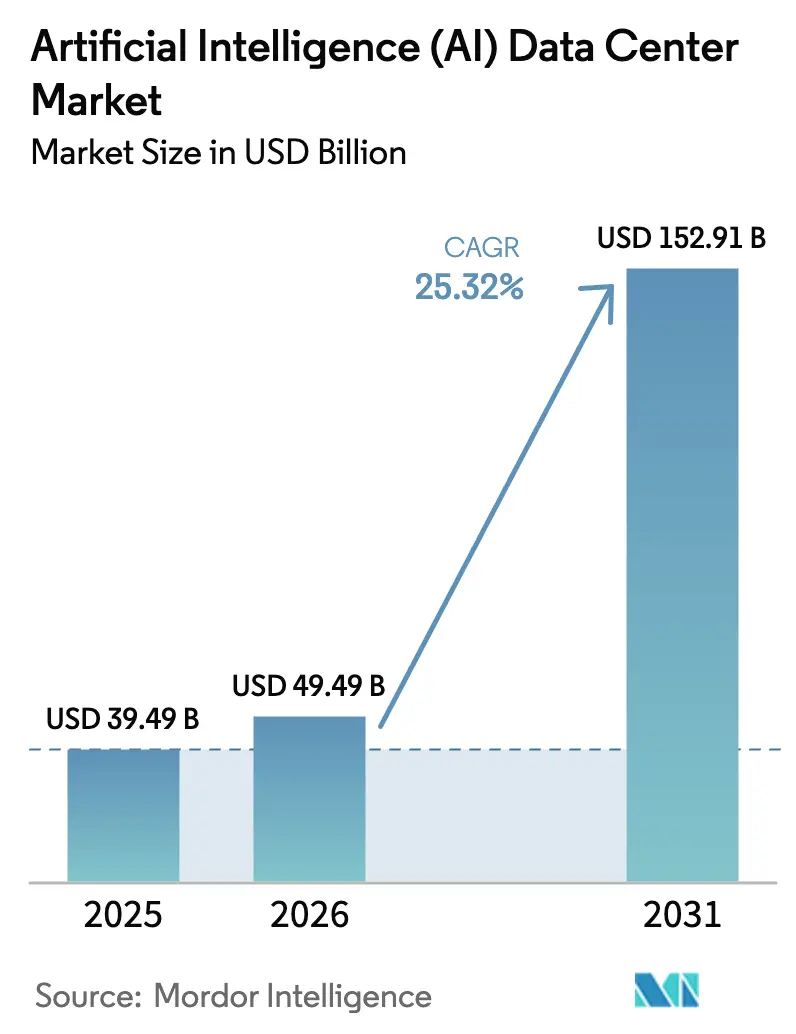
| Market Size (2026) | USD 49.49 Billion |
| Market Size (2031) | USD 152.91 Billion |
| Growth Rate (2026 - 2031) | 25.32% CAGR |
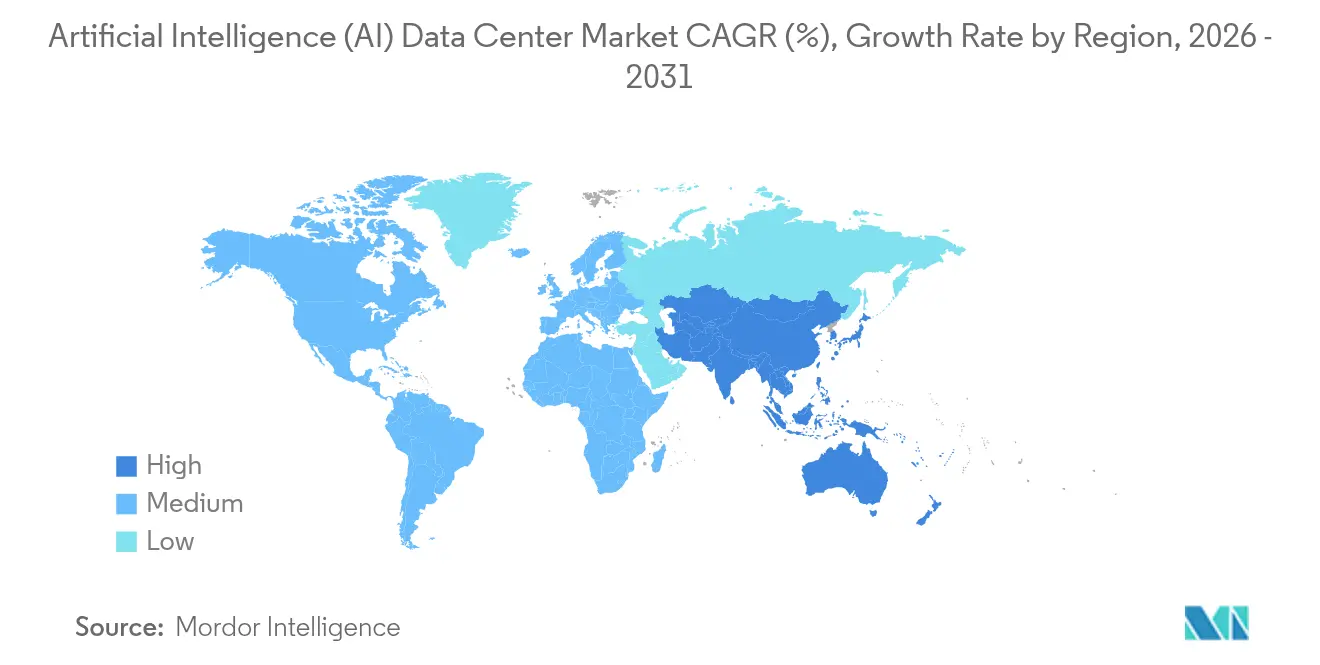
| Fastest Growing Market | Asia Pacific |
| Largest Market | North America |
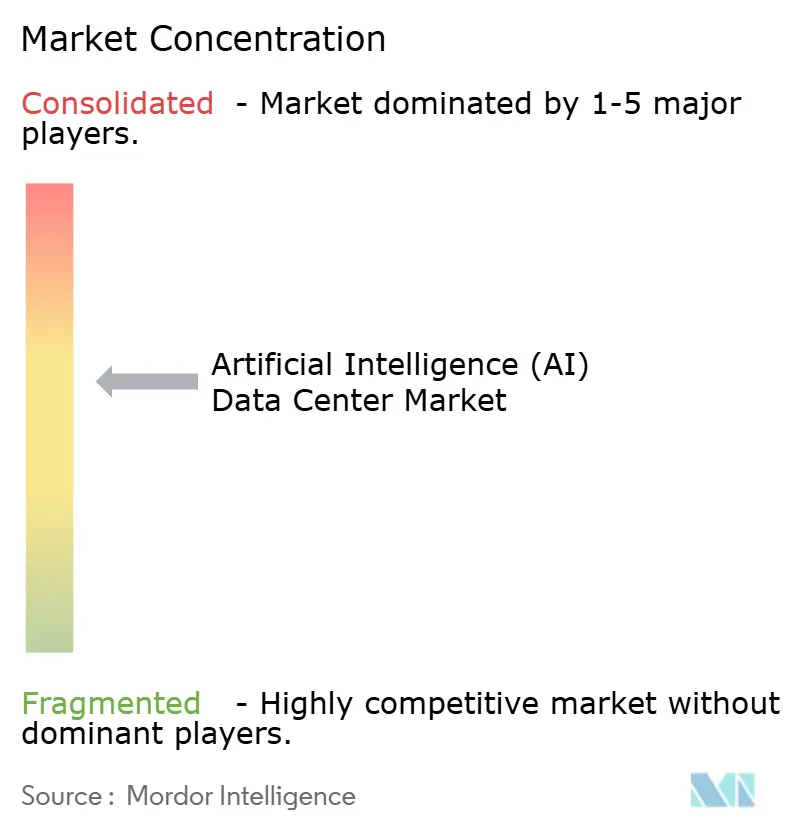
| Market Concentration | Medium |
Major Players *Disclaimer: Major Players sorted in no particular order Image © Mordor Intelligence. Reuse requires attribution under CC BY 4.0. | |
Artificial Intelligence (AI) Data Center Market Analysis by Mordor Intelligence
The Artificial Intelligence Data Center market size is expected to grow from USD 39.49 billion in 2025 to USD 49.49 billion in 2026 and is forecast to reach USD 152.91 billion by 2031 at 25.32% CAGR over 2026-2031. The steep rise is based on the pivot from general-purpose compute to AI-optimized infrastructure, which supports high-density accelerator clusters, liquid cooling, and a resilient power architecture.[1]NVIDIA Corporation, “NVIDIA Announces Financial Results for Third Quarter Fiscal 2025,” nvidianews.nvidia.com Cloud hyperscalers continue accelerating capacity additions, while edge-focused colocation operators capture workloads that demand sub-10 millisecond latency. Government incentives tied to energy efficiency and domestic AI sovereignty amplify regional build-outs, particularly in the Asia-Pacific. Supply constraints for GPUs and power electronics keep hardware pricing elevated, yet sustained enterprise demand for model training and inference offsets these headwinds. Competitive intensity now centers on which operator can deliver the optimal blend of rack power density, cooling efficiency, and geographic reach.
Key Report Takeaways
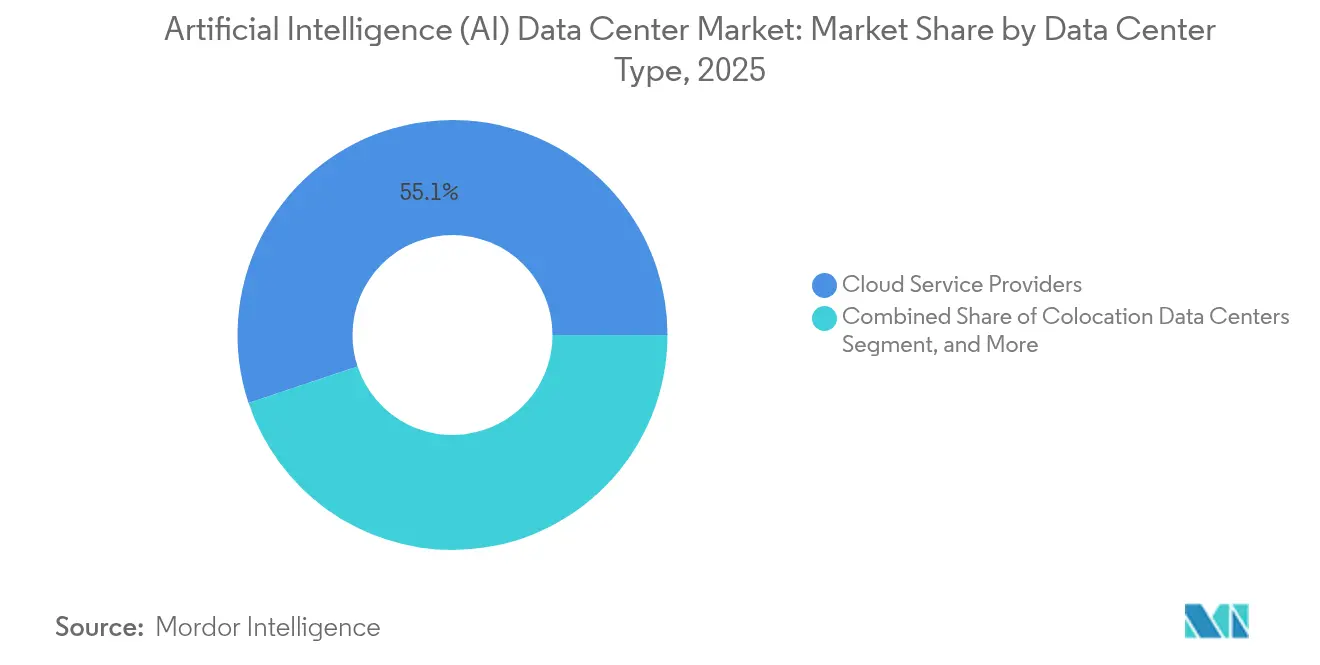
- By data center type, Cloud Service Providers held 55.12% of the Artificial Intelligence Data Center market share in 2025, while Colocation Data Centers are projected to grow at 27.29% CAGR to 2031.
- By component, software captured 45.12% share of the Artificial Intelligence Data Center market size in 2025, and hardware is set to expand at a 26.95% CAGR through 2031.
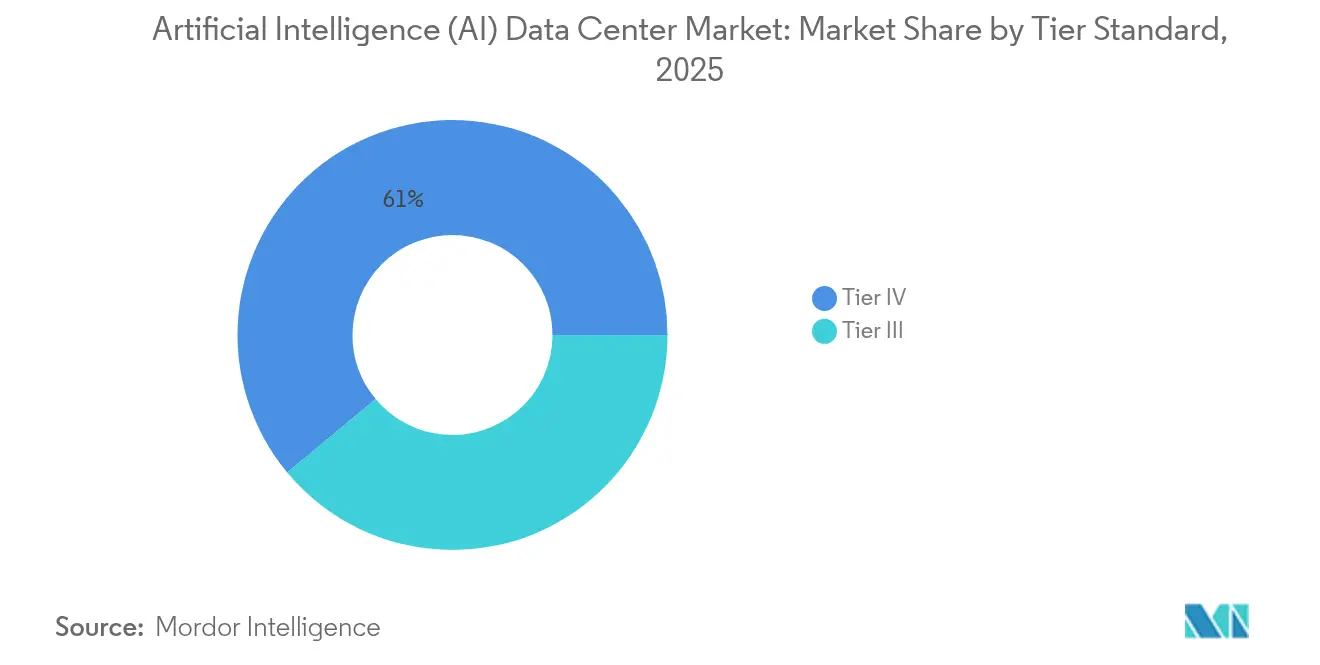
- By tier standard, Tier IV facilities commanded a 61.05% share of the Artificial Intelligence Data Center market size in 2025, whereas Tier III facilities exhibited the fastest pace at a 27.16% CAGR to 2031.
- By end-user, IT and ITES led the Artificial Intelligence Data Center market with a 33.15% revenue share in 2025, while Internet and Digital Media is forecast to post a 26.34% CAGR up to 2031.
- By geography, North America held a 37.35% share of the Artificial Intelligence Data Center market in 2025, and the Asia-Pacific region is projected to advance at a 26.12% CAGR through 2031.
Note: Market size and forecast figures in this report are generated using Mordor Intelligence’s proprietary estimation framework, updated with the latest available data and insights as of 2026.
Global Artificial Intelligence (AI) Data Center Market Trends and Insights
Drivers Impact Analysis*
| Driver | (~) % Impact on CAGR Forecast | Geographic Relevance | Impact Timeline |
|---|---|---|---|
| Explosive growth in AI model-training compute | +8.2% | North America, Asia-Pacific | Long term (≥ 4 years) |
| Hyperscale cloud adoption of AI accelerators | +6.7% | Global, led by North America | Medium term (2-4 years) |
| Government incentives for green facilities | +4.1% | Europe, North America, emerging Asia-Pacific | Long term (≥ 4 years) |
| AI-specific liquid cooling adoption | +3.8% | Global, early hyperscale deployments | Medium term (2-4 years) |
| Grid-edge AI forecasting for power density | +2.1% | North America, Europe | Long term (≥ 4 years) |
| Waste-heat monetization in district energy | +1.1% | Northern Europe, select North America | Long term (≥ 4 years) |
| Source: Mordor Intelligence | |||
Explosive Growth in AI Model-Training Compute Requirements
Training frontier models such as GPT-4 class networks can involve more than 25,000 NVIDIA H100 GPUs operating continuously, pushing per-rack power above 100 kW and outstripping legacy facility limits. Operators must deploy purpose-built interconnect fabrics, such as NVLink or InfiniBand, which dictate dedicated white-space layouts. Meta is constructing clusters with over 100,000 H100 GPUs, underscoring how parameter scale directly converts to physical capacity needs.[2]Meta Platforms, “Building Meta's GenAI Infrastructure,” engineering.fb.com Mixture-of-experts architectures increase total token throughput, paradoxically enlarging the infrastructure footprint. As model training becomes a primary differentiation lever among cloud providers, AI-ready capacity experiences multi-year reservation cycles. Those reservations lock in demand that cannot revert to traditional CPU workloads, cementing long-run utilization.
Rising Adoption of Hyperscale Cloud Services Integrating AI Accelerators
Amazon EC2 P5 instances integrate eight H100 GPUs per node, while Microsoft Azure combines custom Maia chips with NVIDIA devices, shifting facility design toward heterogeneous accelerator bays. Google’s TPU v5 pods call for unique cooling loops and high-amperage busways that diverge from x86 rack profiles. AI-as-a-Service models result in continuous GPU occupancy, which justifies capital-intensive builds. Microsoft’s USD 13 billion outlay with OpenAI illustrates the stakes in securing multi-year AI workloads. The result is a capacity arms race where differentiation hinges on accelerator availability, low-latency interconnects, and regional coverage rather than core count.
Government Incentives for Green and Energy-Efficient Data Centers
The EU Energy Efficiency Directive mandates power-usage reporting by 2025 for facilities above 500 kW, rewarding operators that achieve sub-1.3 PUE through advanced cooling. The U.S. Infrastructure Investment and Jobs Act earmarks USD 65 billion for grid modernization, unlocking funding that favors high-density AI facilities integrating renewables. Japan’s Green Transformation scheme offers preferential loans for waste-heat recovery, thereby accelerating the adoption of liquid cooling. Singapore permits new data centers only if they prove carbon neutrality, effectively steering future capacity toward AI-optimized, low-carbon designs. These policies convert sustainability from a compliance line item into a competitive moat.
Emergence of AI-Specific Liquid Cooling Shaping Facility Design
NVIDIA H100 and forthcoming H200 GPUs dissipate more than 700W each, forcing operators to replace air cooling with direct-to-chip or immersion cooling approaches. Microsoft reports that two-phase immersion enables 40% higher compute density while trimming cooling energy by up to 90%. Higher fluid exit temperatures allow integration with district heating networks, generating incremental revenue streams. Open Compute Project standards for liquid interfaces foster multi-vendor adoption, reducing lock-in risk. As liquid loops migrate from pilot to production, whitespace layouts, rack designs, and maintenance workflows are rewritten to accommodate coolant manifolds rather than hot-aisle containment.
Restraints Impact Analysis*
| Restraint | (~) % Impact on CAGR Forecast | Geographic Relevance | Impact Timeline |
|---|---|---|---|
| Soaring electricity costs and grid congestion | -4.3% | Europe, California | Short term (≤ 2 years) |
| Supply-chain constraints for high-end GPUs | -3.7% | Global, acute in Asia manufacturing hubs | Medium term (2-4 years) |
| Water-usage restrictions in drought regions | -2.1% | Western North America, Southern Europe | Medium term (2-4 years) |
| Local community resistance to edge footprints | -1.8% | Dense urban markets globally | Short term (≤ 2 years) |
| Source: Mordor Intelligence | |||
Soaring Electricity Costs and Grid Congestion
Peak power in Germany hit EUR 0.40 per kWh (USD 0.43) in 2024, eroding the economics of multi-month training runs.[3]European Network of Transmission System Operators, “Electricity Balancing Report 2024,” entsoe.eu Northern Virginia utilities have frozen interconnections exceeding 50 MW, delaying new hyperscale builds. California ISO issued flex alerts during AI training peaks, illustrating how unrelenting GPU clusters can strain regional grids. Operators respond with on-site battery storage and load-shifting algorithms; however, these add to capital expenses. Smaller firms lacking bulk-power contracts face disproportionate cost pressure, potentially concentrating AI R&D within a handful of well-capitalized players.
Supply-Chain Constraints for High-End GPUs and Power Electronics
Lead times for H100 GPUs exceeded 52 weeks in 2024 as demand outstripped NVIDIA’s advanced packaging output. TSMC prioritizes higher-margin cloud orders, limiting availability for emerging operators. Shortages extend to high-bandwidth memory and liquid-cooling plates, both of which are produced by a narrow vendor base. Power transformers rated for 100 kW racks also face months-long queues, slowing facility commissioning. These constraints force operators to pre-order hardware months in advance, heightening project risk and locking capital.
*Our forecasts treat driver/restraint impacts as directional, not additive. The impact forecasts reflect baseline growth, mix effects, and variable interactions.
Segment Analysis
By Data Center Type: Cloud Scale Remains Dominant While Colocation Outpaces Growth
Cloud Service Providers controlled 55.12% of the Artificial Intelligence Data Center market share in 2025 as hyperscalers capitalized on direct silicon supply lines and proprietary network fabrics. Colocation, however, is projected to log a 27.29% CAGR, reflecting enterprise appetite for low-latency AI inference without owning facilities. Hybrid strategies emerge where hyperscalers lease wholesale suites inside carrier-neutral campuses to place training backends near data gravity.
Colocation operators refine liquid-cooling floor layouts to host racks with power capacities of 50 kW or more and bundle cross-connects into AI-ready service catalogs. Enterprises running predictive maintenance or real-time personalization prefer these proximity advantages. Edge locations in tier-2 cities extend AI coverage to autonomous vehicle testbeds and industrial IoT gateways, prompting colocation landlords to invest in modular chillers and 400V power trunks. Contracts are increasingly stipulating latency budgets, rather than just space and power, demonstrating how performance metrics are reshaping leasing norms. The Artificial Intelligence Data Center market benefits from this distributed build-out, which complements rather than replaces hyperscale regions.


By Component: Hardware Investment Accelerates to Unlock Model Scale
Software dominated the market with a 45.12% share in 2025, as organizations experimented with frameworks and orchestration stacks. However, hardware is slated to expand at a 26.95% CAGR, driven by the procurement of accelerators and high-efficiency power infrastructure. Power distribution units are upgraded from 208 V to 415 V to reduce amperage losses, while AI-class UPS systems incorporate silicon-carbide inverters for improved part-load efficiency.
Cooling spend increases as operators replace CRAH units with rear-door heat exchangers and immersion tanks, which enable higher rack densities. These retrofits elevate the Artificial Intelligence Data Center market size for hardware wallets. Services revenue follows, as integrators design, commission, and maintain liquid loops that enterprise facilities teams lack the skill to support. Platform vendors bundle turnkey racks with integrated cooling manifolds, compressing deployment timelines and reinforcing ecosystems around specific accelerator types.
By Tier Standard: Uptime Economics Drive Diverging Investment Paths
Tier IV facilities accounted for 61.05% of the Artificial Intelligence Data Center market size in 2025 because multi-week training jobs cannot tolerate outages that trigger restart penalties. Redundant feeds, distributed switchgear, and 96-hour fuel reserves become table stakes for hyperscale training clusters.
Tier III facilities nevertheless post a 27.16% CAGR as edge inference can accept brief interruptions if failover nodes exist in proximity. Operators adopt software-defined resiliency, which reroutes inference workloads within milliseconds, thereby reducing the need for fully fault-tolerant mechanical systems. This split allows investors to match capex profiles with workload sensitivity, broadening participation in the Artificial Intelligence Data Center market and promoting diverse geographic footprints.
By End-user Industry: Software Firms Lead, Digital Media Surges
IT and ITES retained 33.15% of the revenue in 2025 by embedding generative AI into cloud-native products. Internet and Digital Media now shows the steepest growth at 26.34% CAGR as real-time recommendation engines and content generation rely on sub-second inference. BFSI pilots AI risk scoring inside sovereign clouds that meet data localization rules, stimulating demand for Tier IV racks with hardware security modules.
Healthcare organizations adopt diagnostic imaging pipelines that leverage GPU clusters, backed by HIPAA-compliant environments, driving niche colocation demand. Manufacturing companies deploy edge AI for predictive quality control, meeting the Artificial Intelligence Data Center industry's demand for micro-data centers within factories. Government agencies procure air-gapped clusters for defense analytics, reinforcing the importance of physical and logical segregation within shared campuses.
Geography Analysis
North America controlled a 37.35% share in 2025 owing to mature hyperscale campuses, strong venture funding, and a supportive policy backdrop that includes USD 65 billion for grid upgrades. Constraints surface in Northern Virginia and Silicon Valley, where transmission capacity lags compute demand, steering new builds toward Texas and the Pacific Northwest. Canada’s hydro-rich provinces attract training clusters seeking low-carbon power, while Mexico benefits from near-shoring strategies that reduce supply-chain risk.
Asia-Pacific is on course for a 26.12% CAGR through 2031 as China, Japan, and India embed AI capacity targets in national digital agendas. Beijing funnels more than USD 50 billion annually into domestic GPU development and purpose-built campuses that secure data sovereignty. Tokyo incentivizes liquid-cooled facilities connected to district heating loops, thereby lowering total energy costs and greenhouse gas intensity. India’s Digital India 2.0 program funds regional AI zones in tier-2 cities, widening addressable demand beyond legacy IT hubs.
Europe experiences slower but steady expansion. High electricity prices and water constraints pose challenges for operators, yet GDPR compliance requires AI workloads to process sensitive personal data. Germany and the United Kingdom spearhead investments in carbon-neutral campuses powered by wind and district heat reuse, while France leverages sovereign cloud mandates to localize public-sector AI. The Nordic region distinguishes itself through low ambient temperatures and abundant hydropower, keeping PUE below 1.2, even for 70 kW racks.
Mordor Intelligence provides coverage of the artificial intelligence (ai) data center market across other key regional markets, including Asia, Middle East and Africa, North America, South America, and Europe, each with their regulatory frameworks and demand patterns. Detailed country-level analysis extends to China, South Africa, United States, Chile, and United Kingdom incorporating local coverage and market participation, as required.

Competitive Landscape
Market concentration is moderate, as the top five providers collectively command roughly 62% of the combined revenue. Amazon, Microsoft, and Google leverage privileged silicon supply and custom accelerators to sustain capacity advantages. Digital Realty and Equinix extend their reach through AI-ready colocation suites, offering liquid-cooling manifolds and 400G interconnect fabrics.[4]Equinix, “Equinix Reports Third Quarter 2024 Results,” equinix.com
Strategic moves center on silicon co-design and renewable energy procurement. Google’s latest TPU v5e rollout pairs water-side economization with carbon-aware scheduling, which shifts training to low-emission hours. Microsoft announced a USD 3.2 billion expansion across Virginia and Texas, incorporating 100% renewable power purchase agreements and direct-to-chip cooling. Equinix launched an AI-ready platform spanning 15 metros that bundles high-bandwidth fabrics with immersion-enabled cabinets, positioning for distributed inference growth.
Emerging challengers secure niches by building modular, 5 MW blocks that are deployable in six months, shortening the time-to-revenue for enterprises that cannot wait for hyperscale timelines. Start-ups partner with local utilities to site facilities at substation boundaries, bypassing transmission bottlenecks. GPU supply remains a bottleneck, so contractual priority access often decides facility utilization. Operators capable of guaranteeing hardware, along with space and power, win multi-year commitments that stabilize cash flows.
Artificial Intelligence (AI) Data Center Industry Leaders
Amazon Web Services Inc.
Microsoft Corporation
Alphabet Inc. (Google Cloud)
NVIDIA Corporation
Meta Platforms Inc.
- *Disclaimer: Major Players sorted in no particular order

Recent Industry Developments
- May 2025: NVIDIA unveiled its next-generation Blackwell architecture GPUs specifically designed for AI data centers, featuring 208 billion transistors and delivering up to 4x better performance per watt compared to the previous generation, significantly reducing the energy footprint of AI training and inference workloads
- April 2025: Microsoft announced a USD 10 billion investment in new AI data center infrastructure across three regions, incorporating advanced liquid cooling technology and on-site renewable energy generation to support its expanding AI services while advancing its sustainability goals.
- January 2025: Equinix completed phase two of its Frankfurt FR11 site, adding 20 MW of AI-ready capacity with liquid-cooling distribution.
- October 2024: Microsoft Corporation announced a USD 3.2 billion expansion to boost AI capacity in Virginia and Texas.


Global Artificial Intelligence (AI) Data Center Market Report Scope
The research encompasses the full spectrum of AI applications in data centers, covering hyperscale, colocation, enterprise, and edge facilities. The analysis is segmented by component, distinguishing between hardware and software. Hardware considerations include power, cooling, networking, IT equipment, and more. Software technologies under scrutiny encompass machine learning, deep learning, natural language processing, and computer vision. The study also evaluates the geographical distribution of these applications.
Additionally, it assesses AI's influence on sustainability and carbon neutrality objectives. A comprehensive competitive landscape is presented, detailing market players engaged in AI-supportive infrastructure, encompassing both hardware and software utilized across various AI data center types. Market size is calculated in terms of revenue generated by products and solutions providers in the market, and forecasts are presented in USD Billion for each segment.
| Cloud Service Providers |
| Colocation Data Centers |
| Enterprise / On-Premises / Edge |
| Hardware | Power Infrastructure |
| Cooling Infrastructure | |
| IT Equipment | |
| Racks and Other Hardware | |
| Software | Technology |
| Machine Learning | |
| Deep Learning | |
| Natural Language Processing | |
| Computer Vision | |
| Services | Managed Services |
| Professional Services |
| Tier III |
| Tier IV |
| IT and ITES |
| Internet and Digital Media |
| Telecom Operators |
| Banking, Financial Services and Insurance (BFSI) |
| Healthcare and Life Sciences |
| Manufacturing and Industrial IoT |
| Government and Defense |
| North America | United States | |
| Canada | ||
| Mexico | ||
| South America | Brazil | |
| Argentina | ||
| Chile | ||
| Rest of South America | ||
| Europe | Germany | |
| United Kingdom | ||
| France | ||
| Italy | ||
| Spain | ||
| Rest of Europe | ||
| Asia-Pacific | China | |
| Japan | ||
| South Korea | ||
| India | ||
| Australia | ||
| Singapore | ||
| Malaysia | ||
| Rest of Asia-Pacific | ||
| Middle East and Africa | Middle East | Saudi Arabia |
| United Arab Emirates | ||
| Turkey | ||
| Rest of Middle East | ||
| Africa | South Africa | |
| Nigeria | ||
| Rest of Africa | ||
| By Data Center Type | Cloud Service Providers | ||
| Colocation Data Centers | |||
| Enterprise / On-Premises / Edge | |||
| By Component | Hardware | Power Infrastructure | |
| Cooling Infrastructure | |||
| IT Equipment | |||
| Racks and Other Hardware | |||
| Software | Technology | ||
| Machine Learning | |||
| Deep Learning | |||
| Natural Language Processing | |||
| Computer Vision | |||
| Services | Managed Services | ||
| Professional Services | |||
| By Tier Standard | Tier III | ||
| Tier IV | |||
| By End-user Industry | IT and ITES | ||
| Internet and Digital Media | |||
| Telecom Operators | |||
| Banking, Financial Services and Insurance (BFSI) | |||
| Healthcare and Life Sciences | |||
| Manufacturing and Industrial IoT | |||
| Government and Defense | |||
| By Geography | North America | United States | |
| Canada | |||
| Mexico | |||
| South America | Brazil | ||
| Argentina | |||
| Chile | |||
| Rest of South America | |||
| Europe | Germany | ||
| United Kingdom | |||
| France | |||
| Italy | |||
| Spain | |||
| Rest of Europe | |||
| Asia-Pacific | China | ||
| Japan | |||
| South Korea | |||
| India | |||
| Australia | |||
| Singapore | |||
| Malaysia | |||
| Rest of Asia-Pacific | |||
| Middle East and Africa | Middle East | Saudi Arabia | |
| United Arab Emirates | |||
| Turkey | |||
| Rest of Middle East | |||
| Africa | South Africa | ||
| Nigeria | |||
| Rest of Africa | |||


Key Questions Answered in the Report
How large is the Artificial Intelligence Data Center market in 2026?
It is valued at USD 49.49 billion and is expected to grow at a 25.32% CAGR over 2026-2031.
Which segment grows fastest within AI data centers?
Colocation Data Centers show the highest pace at 27.29% CAGR through 2031.
What hardware trend influences facility design most?
Adoption of liquid cooling for GPUs exceeding 700 W drives new rack and power architectures.
Why does Asia-Pacific outpace other regions?
Sovereign AI mandates and government incentives fuel a 26.12% CAGR across China, Japan, and India.
What uptime tier dominates capacity?
Tier IV facilities hold 61.05% share owing to stringent training workload resiliency demands.
How are energy regulations shaping new builds?
Policies like the EU Energy Efficiency Directive reward data centers achieving sub-1.3 PUE, pushing operators toward green cooling and renewable integration.
Page last updated on:


