Market Overview
| Study Period | 2020 - 2031 |
|---|---|
| Market Size (2026) | USD 155.63 Billion |
| Market Size (2031) | USD 865.69 Billion |
| Growth Rate (2026 - 2031) | 40.90 % |
| Fastest Growing Market | Asia-Pacific |
| Largest Market | North America |
| Market Concentration | Medium |
Major Players *Disclaimer: Major Players sorted in no particular order Image © Mordor Intelligence. Reuse requires attribution under CC BY 4.0. | |
Data Center Market Analysis by Mordor Intelligence
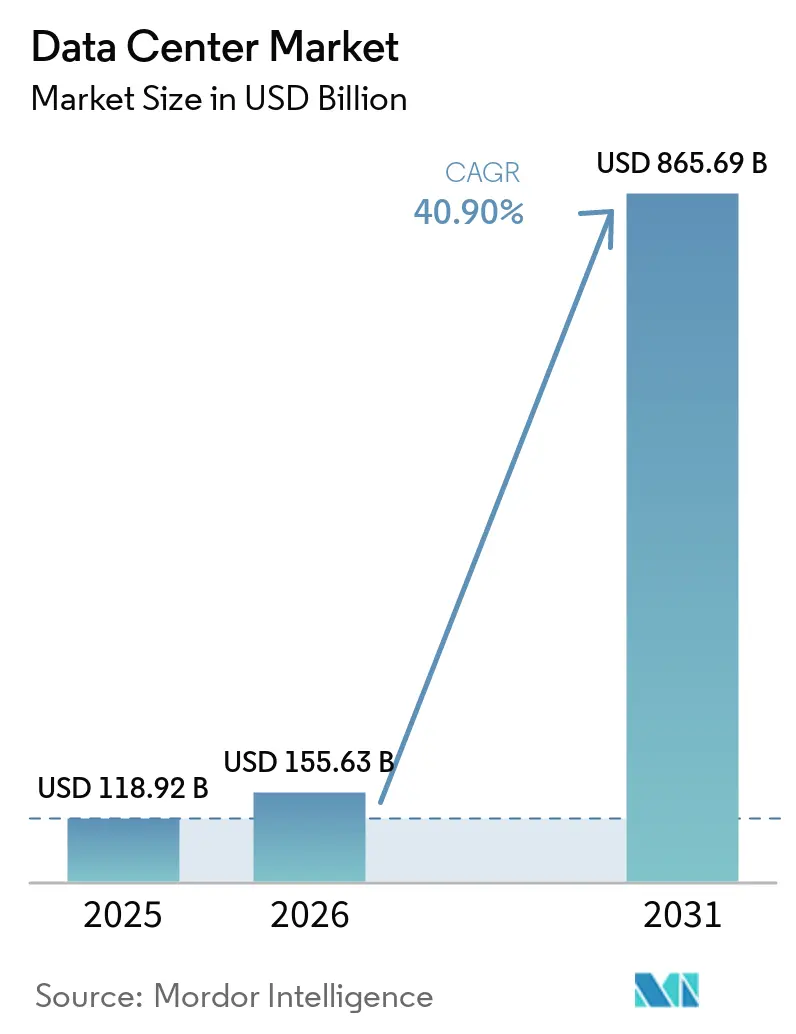
The Data Center Market size is expected to increase from USD 118.92 billion in 2025 to USD 155.63 billion in 2026 and reach USD 865.69 billion by 2031, growing at a CAGR of 40.90% over 2026-2031. In terms of installed base, the market was valued at 131.40 thousand megawatt in 2025 and is expected to grow from 167.51 thousand megawatt in 2026 to 844.01 thousand megawatt by 2031, at a CAGR of 38.19% during the forecast period (2026-2031).
The market segment shares and estimates are calculated and reported in terms of MW. This trajectory reflects surging artificial-intelligence workloads, the rapid build-out of edge nodes, and capital-intensive hyperscale campuses that are transforming digital infrastructure economics. Enterprise computing is migrating toward high-density racks that require liquid cooling, while power procurement is emerging as the decisive site-selection variable. Operators able to secure low-carbon electricity at scale are capturing outsized demand, especially from financial-services and generative-AI tenants. Heightened regulatory focus on data residency and carbon reporting is steering new capacity toward secondary metros and renewable-rich regions, widening geographic dispersion across the data center market.
Key Report Takeaways
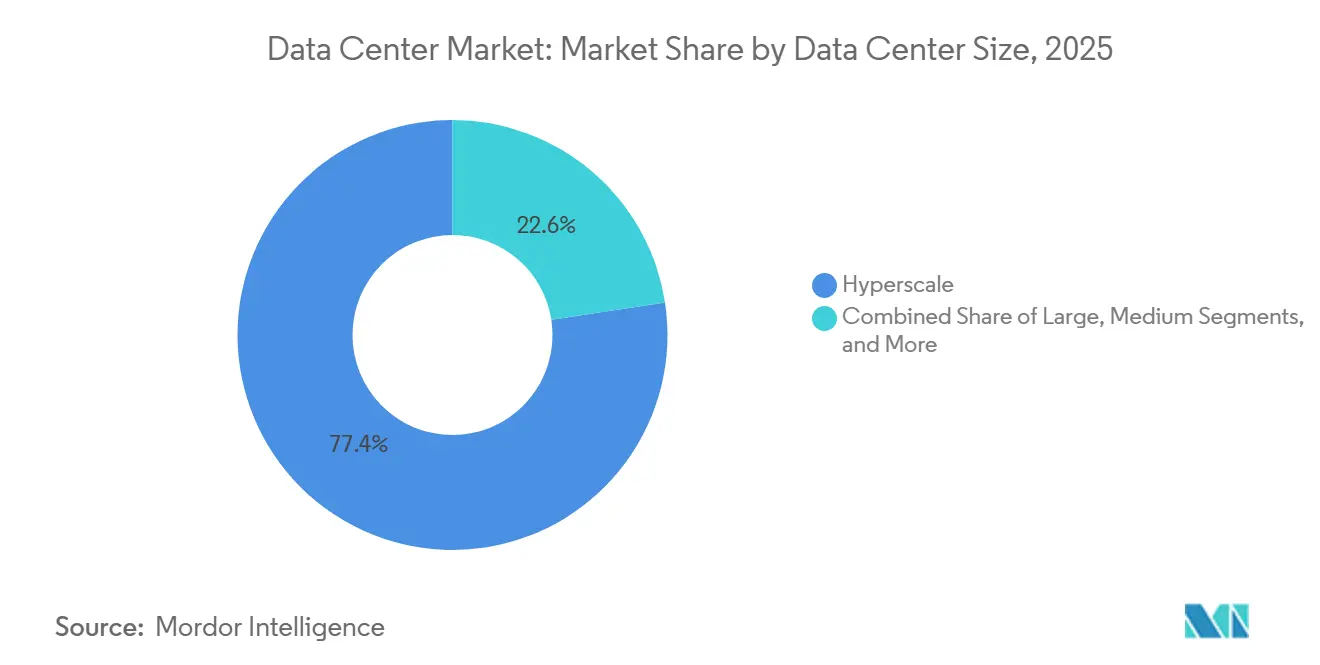
- By data center size, hyperscale facilities held 77.42% of data center market share in 2025, and is projected to expand at a 43.08% CAGR through 2031.
- By tier type, Tier 3 accounted for 59.10% of the data center market size in 2025; Tier 4 is forecast to accelerate at 44.31% CAGR to 2031.
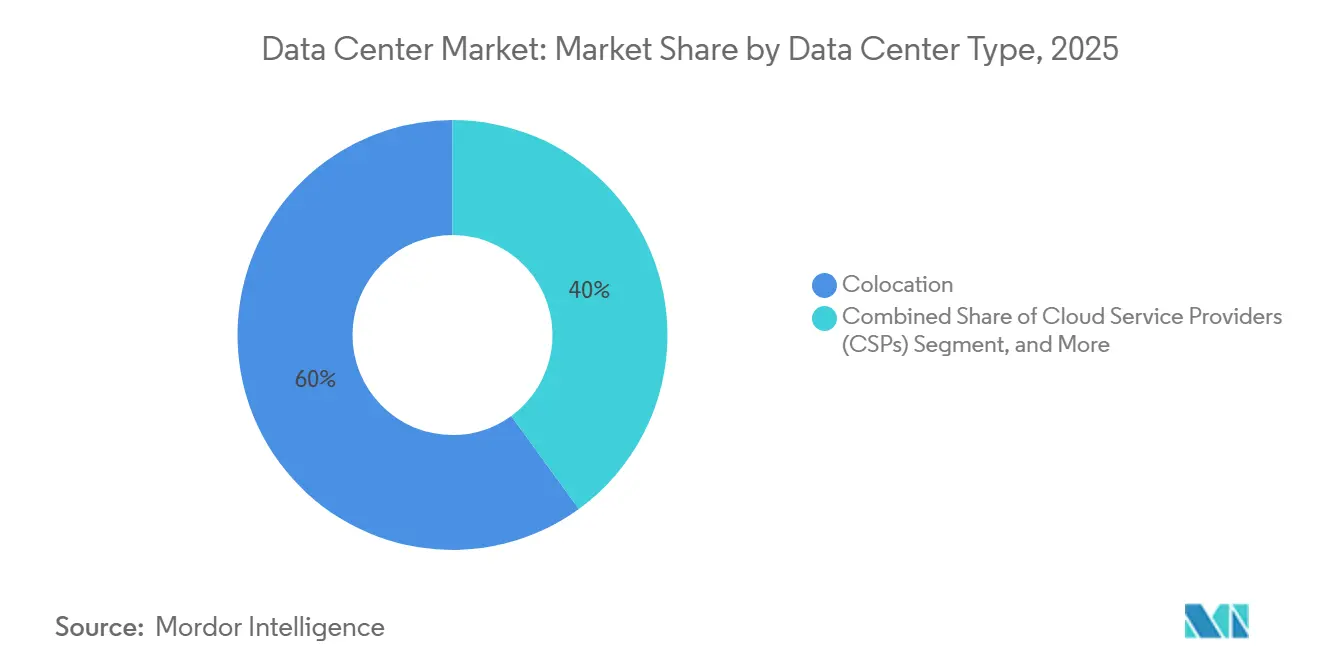
- By data center type, colocation captured 60.00% revenue share in 2025, and is projected to grow at at a CAGR of 42.38% during the forecast period.
- By end user, IT and telecom commanded 39.85% share in 2025; banking, financial services, and insurance is advancing at a 41.12% CAGR through 2031.
- By geography, North America led with 35.10% revenue share in 2025, whereas Asia-Pacific is projected to post the fastest 42.34% CAGR to 2031.
Note: Market size and forecast figures in this report are generated using Mordor Intelligence’s proprietary estimation framework, updated with the latest available data and insights as of 2026.
600+
data center reports by Mordor Intelligence
covering construction, AI facilities, servers and more - global, regional or country-level, right down to individual data center components
Market Trends and Insights
Drivers Impact Analysis of Data Center Market*
| Driver | (~) % Impact on CAGR Forecast | Geographic Relevance | Impact Timeline |
|---|---|---|---|
| AI and GPU-Intensive Workloads Explosion | +8.8% | Global with emphasis on North America and Asia-Pacific | Short term (≤ 2 years) |
| Rapid Cloud and Digital-Transformation Adoption | +7.1% | Global with strongest pull from emerging economies | Medium term (2-4 years) |
| Edge and 5G Low-Latency Demand Wave | +6.7% | Asia-Pacific core, spill-over to North America and Europe | Medium term (2-4 years) |
| Submarine-Cable Build-Out Unlocks Secondary Coasts | +6.2% | Coastal regions worldwide | Long term (≥ 4 years) |
| On-Site SMR Power PPA Models | +5.9% | North America and Europe | Long term (≥ 4 years) |
| Carbon-Credit Retrofits in Emerging Markets | +5.6% | Asia-Pacific, Middle East and Africa | Medium term (2-4 years) |
| Source: Mordor Intelligence | |||
AI and GPU-Intensive Workloads Explosion
Rack densities are escalating from 8-12 kW toward 120 kW as training clusters for large-language models proliferate. Operators are standardizing liquid and immersion cooling, installing dedicated substations, and designing campus-scale sites capable of multi-gigawatt expansion. Capital-spending commitments such as Amazon’s USD 150 billion, targeted at AI-optimized capacity, illustrate the scale of electricity and real estate now required.[1] Competitive advantage accrues to providers that can deliver low-latency, high-density power coupled with fault-tolerant cooling architectures, reinforcing consolidation trends across the data center market.
Rapid Cloud and Digital-Transformation Adoption
Enterprises have shifted from lift-and-shift migrations to cloud-native microservices that rely on distributed processing. Financial institutions are modernizing payment and fraud-detection platforms, generating sustained demand for carrier-neutral colocation connected to multiple cloud on-ramps. Data-privacy mandates in emerging economies are stimulating local build-outs, while hybrid-cloud strategies are lengthening colocation contract terms to preserve interconnection optionality across the data center market.
Edge and 5G Low-Latency Demand Wave
Fifth-generation networks require compute within 10 milliseconds round-trip latency, catalyzing sub-1 MW edge sites inside metro areas. Telecom carriers are partnering with neutral-host operators to convert central offices into micro-data centers that process autonomous-vehicle telemetry, AR/VR workloads, and industrial IoT data.[2] Modular form factors that can be deployed in weeks allow operators to replicate designs across hundreds of urban nodes, creating a dense edge layer that feeds hyperscale regions deeper inside the data center market.
Submarine-Cable Build-Out Unlocks Secondary Coasts
New transoceanic cables are landing in previously underserved coastal districts, lowering latency to global internet exchanges and unlocking development sites with abundant renewable energy.[3] Hyperscale firms are capitalizing on cheaper land and power while avoiding congestion in legacy hubs. Enhanced fiber capacity supports cross-border cloud adoption and ensures regulatory compliance with data-sovereignty statutes, thereby broadening addressable demand for regional providers inside the data center market.
Restraints Impact Analysis of Data Center Market*
| Restraint | (~) % Impact on CAGR Forecast | Geographic Relevance | Impact Timeline |
|---|---|---|---|
| Grid Power Shortages and Rising Electricity Costs | -7.8% | Global, acute in high-demand metros | Short term (≤ 2 years) |
| Land and Permitting Bottlenecks in Tier-1 Hubs | -6.4% | North America and Europe primary markets | Medium term (2-4 years) |
| Export Controls on Advanced Accelerators | -4.9% | Global, Asia-Pacific most affected | Short term (≤ 2 years) |
| Transformer and Switchgear Lead-Time Inflation | -2.7% | Global supply chain | Medium term (2-4 years) |
| Source: Mordor Intelligence | |||
Grid Power Shortages and Rising Electricity Costs
Transmission constraints are delaying interconnection approvals beyond three years in capacity-congested regions. Utilities struggle to upgrade substations fast enough to serve megawatt-hungry campuses, and peak-hour tariffs are compressing operator margins. Developers are responding with on-site generation, battery storage, and power-purchase agreements for renewable and small-modular-reactor capacity, yet lead times and regulatory certification remain formidable obstacles across the data center market.
Land and Permitting Bottlenecks in Tier-1 Hubs
Scarcity of industrially zoned parcels in established metros has driven land prices above USD 500 per m², eroding project returns. Lengthy permitting cycles that include environmental reviews can extend to 18 months, locking capital in non-revenue-generating assets. Community pushback over water use and diesel-backup emissions is compelling operators to redevelop brownfield sites or shift investment to secondary regions where permitting and community relations are less contentious within the data center market.
*Our forecasts treat driver/restraint impacts as directional, not additive. The impact forecasts reflect baseline growth, mix effects, and variable interactions.
Data Center Market Segment Analysis
By Data Center Size:
Hyperscale Facilities Drive Density InnovationThe hyperscale data center market accounted for 77.42% of overall data center market revenue in 2025 and is projected to grow at a CAGR of 43.08% during 2026-2031. Growth is driven by rising demand for cloud computing, artificial intelligence, machine learning, and other data-intensive workloads. Hyperscale operators are developing large campuses with multi-megawatt capacity and scalable infrastructure to meet increasing compute demand. Growth also reflects the concentration of workloads among major cloud and technology providers and the expansion of hyperscale infrastructure into emerging data center markets.
Purpose-built hyperscale campuses with high-density GPU clusters, liquid cooling, advanced power systems, battery energy storage, and renewable energy solutions support this growth. These capabilities enable higher rack densities, improve energy efficiency, and support sustainability targets. As providers expand geographically to address grid constraints, power availability, land requirements, and AI compute demand, hyperscale campuses are becoming a key part of global digital infrastructure, supporting market growth through 2031.

By Tier Type:
Fault Tolerance Commands Premium GrowthTier 4 revenues are projected to outpace Tier 3 with a 44.31% CAGR to 2031 even though Tier 3 captured 59.10% of 2025 spending. Zero-downtime requirements for algorithmic trading, digital banking, and AI model training justify the 25% capital-expenditure premium associated with 2N+1 redundancy. These specifications lift barriers to entry and concentrate demand among providers capable of financing high-availability builds, thereby shifting share toward Tier 4 within the data center market size hierarchy.
Growth is especially strong in emerging economies where newly issued regulations demand fault-tolerant infrastructure for national payment systems and sovereign-AI workloads. Operators gaining early Tier 4 accreditation enjoy outsized pricing power and establish durable competitive moats as enterprises migrate mission-critical applications to certified facilities inside the data center market.
By Data Center Type:
Colocation Momentum AcceleratesColocation is projected to hold a leading 60.00% share of the global data center market in 2025 and grow at a CAGR of 42.38% during 2026–2031. Demand from enterprises, cloud service providers, hyperscalers, and digital-native businesses is driving growth, as these customers seek scalable infrastructure without the high capital costs and operational complexity of self-built facilities. Providers are expanding multi-megawatt campuses and offering flexible power densities and scalable capacity for cloud, AI, and data-intensive workloads.
Colocation facilities are investing in modular capacity, high-density halls, liquid-cooling readiness, renewable power procurement, battery energy storage, and carrier-neutral connectivity. These investments support AI and high-performance computing workloads while helping customers achieve sustainability and energy-efficiency objectives. As organizations seek faster infrastructure deployment with lower upfront capital expenditure, colocation is strengthening its role in global data center capacity expansion.
By End User:
BFSI Sector Leads Digital Infrastructure InvestmentFinancial-services tenants are projected to post the highest 41.12% CAGR through 2031, propelled by regulatory reporting, real-time settlement mandates, and AI-enhanced fraud analytics. Low-latency colocation inside financial hubs and high-availability Tier 4 sites for core banking workloads are both in high demand, lifting BFSI’s wallet share inside the broader data center market share mix.
IT and telecom firms still anchor 39.85% of 2025 capacity, yet rising GPU leasing costs and privacy legislation are compelling telcos to co-locate edge compute for 5G services, while software-as-a-service platforms opt for leased racks in carrier-dense hubs. These trends reinforce a structurally diverse but BFSI-weighted customer landscape across the data center market.
Geography Analysis
North America Data Center Market
North America accounted for 35.10% of the global data center market in 2025, supported by established hyperscale ecosystems and strong data center activity across key markets such as Northern Virginia, Dallas, and Phoenix. Transmission upgrades, such as a USD 2.82 billion commitment by regional utilities, aim to unlock new megawatt blocks, yet interconnection queues still exceed three years in some submarkets. Operators are extending footprints into Ohio, Missouri, and Canadian provinces rich in renewables, thereby spreading future additions across a wider geography within the data center market.
APAC Data Center Market
Asia-Pacific exhibits the fastest 42.34% CAGR outlook, fueled by sovereign-AI ambitions, e-commerce adoption, and data-localization statutes. India’s colocation footprint doubled to roughly 1 GW over the past 18 months, while Jakarta, Kuala Lumpur, and Osaka each surpassed 300 MW installed. National policies prioritizing domestic storage of personal data and incentives for renewable power procurement continue to draw foreign direct investment, reinforcing the region’s position as the epicenter of incremental demand in the data center market.
EMEA Data Center Market
Europe, Middle East, and Africa display mixed dynamics. Core European hubs confront land and power constraints, redirecting development toward Madrid, Milan, and Warsaw. Simultaneously, renewable-rich regions such as Aragón are attracting giga-scale campuses, including a 300 MW commitment financed by international operators. Gulf states leverage low-carbon power and pro-digital agendas to win hyperscale builds, while African metros secure capacity alongside new submarine cable landings, gradually knitting the continent into global cloud fabrics shaping the data center market.
Competitive Landscape
Competition is intensifying as electricity procurement, rather than fiber density, becomes the decisive differentiator. Hyperscale incumbents negotiate multi-decade power-purchase agreements and, in some cases, invest directly in nuclear-reactor development to bypass grid congestion. Colocation specialists counter by layering value-added services such as accelerator leasing, sustainability dashboards, and industry-specific compliance modules to retain enterprise tenants.
Liquid-cooling adoption is now a baseline specification in new builds, forcing legacy sites to retrofit or risk obsolescence, while supply-chain delays for transformers and switchgear favor operators with deep inventory pipelines. Alternative-construction methods, including prefabricated modules and on-site 3D-printed components, are shortening delivery schedules and lowering embodied carbon, further segmenting providers by engineering sophistication.
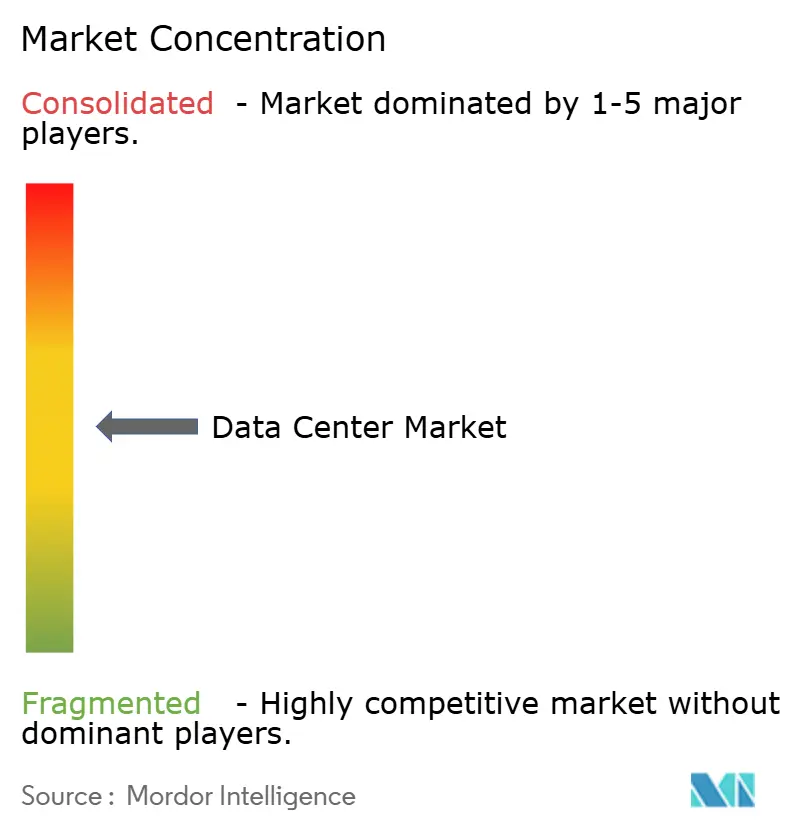
Midsize players are consolidating to achieve the scale needed for bulk-power negotiations and regional network fabrics. Simultaneously, edge-focused entrants carve niches through local-loop partnerships with telecom carriers. These cross-currents support a moderate-concentration structure in which the top five operators command significant, but not dominant, revenue share across the data center market.
Data Center Industry Leaders
-
Amazon Web Services, Inc.
-
Google Inc.
-
Microsoft Corporation
-
Digital Realty Trust, Inc.
-
IBM Corporation
- *Disclaimer: Major Players sorted in no particular order
Data Center Market Companies Covered in this Report
- Amazon Web Services, Inc.
- Google LLC
- Microsoft Corporation
- Meta Platforms, Inc.
- Digital Realty Trust, Inc.
- Equinix, Inc.
- QTS Realty Trust, LLC
- STACK Infrastructure
- Vantage Data Centers Management Company, LLC
- NTT DATA Group Corporation
- CyrusOne LLC
- DigitalBridge Group, Inc.
- International Business Machines Corporation
- Aligned Data Centers, LLC
- Alibaba Cloud Computing Ltd.
Recent Industry Developments in Data Center Market
- May 2025: BSO unveiled DataOne, an AI-focused campus slated to grow from 80 MW to 400 MW in France by 2028, powered entirely by renewable energy and waste-heat recovery systems.
- March 2024: Amazon announced a USD 150 billion, 15-year investment program aimed at delivering power-dense AI capacity across multiple U.S. regions.
- March 2024: Amazon Web Services closed a USD 650 million acquisition of the Cumulus campus adjacent to Pennsylvania’s Susquehanna nuclear plant, securing nuclear baseload for a 15-building megacampus.
- October 2024: Amazon committed USD 500 million to X-energy to explore deployment of small modular reactors capable of supplying 320 MW to Pacific Northwest facilities in the early 2030s.
Global Data Center Market Report Scope
The Data Center Market Report is Segmented by Data Center Size (Hyperscale, Large, Medium, and Small), Tier Type (Tier 1 and 2, Tier 3, and Tier 4), Data Center Type (Cloud Service Providers (CSPs), Enterprise/Edge, and Colocation), End User (BFSI, IT and ITES, E-Commerce, Government, Manufacturing, Media and Entertainment, Telecom, and More), and Geography (APAC, Africa, Europe, Middle East, North America, South America) are covered as segments by Region.
Segmentation Overview
By Data Center Size
| Hyperscale |
| Large |
| Medium |
| Small |
By Tier Type
| Tier 1 and 2 |
| Tier 3 |
| Tier 4 |
By Data Center Type
| Cloud Service Providers (CSPs) | ||
| Enterprise / Edge | ||
| Colocation | Non-Utilized | |
| Utilized | Retail Colocation | |
| Wholesale Colocation | ||
By End User
| BFSI |
| IT and ITES |
| E-Commerce |
| Government |
| Manufacturing |
| Media and Entertainment |
| Telecom |
| Other End Users |
By Geography
| North America |
| South America |
| Europe |
| Asia-Pacific |
| Middle East and Africa |
| By Data Center Size | Hyperscale | ||
| Large | |||
| Medium | |||
| Small | |||
| By Tier Type | Tier 1 and 2 | ||
| Tier 3 | |||
| Tier 4 | |||
| By Data Center Type | Cloud Service Providers (CSPs) | ||
| Enterprise / Edge | |||
| Colocation | Non-Utilized | ||
| Utilized | Retail Colocation | ||
| Wholesale Colocation | |||
| By End User | BFSI | ||
| IT and ITES | |||
| E-Commerce | |||
| Government | |||
| Manufacturing | |||
| Media and Entertainment | |||
| Telecom | |||
| Other End Users | |||
| By Geography | North America | ||
| South America | |||
| Europe | |||
| Asia-Pacific | |||
| Middle East and Africa | |||
Market Definition
- IT LOAD CAPACITY - The IT load capacity or installed capacity, refers to the amount of energy consumed by servers and network equipments placed in a rack installed. It is measured in megawatt (MW).
- ABSORPTION RATE - It denotes the extend to which the data center capacity has been leased out. For instance, a 100 MW DC has leased out 75 MW, then absorption rate would be 75%. It is also referred as utilization rate and leased-out capacity.
- RAISED FLOOR SPACE - It is an elevated space build over the floor. This gap between the original floor and the elevated floor is used to accommodate wiring, cooling, and other data center equipment. This arrangement assist in having proper wiring and cooling infrastructure. It is measured in square feet (ft^2).
- DATA CENTER SIZE - Data Center Size is segmented based on the raised floor space allocated to the data center facilities. Mega DC - # of Racks must be more than 9000 or RFS (raised floor space) must be more than 225001 Sq. ft; Massive DC - # of Racks must be in between 9000 and 3001 or RFS must be in between 225000 Sq. ft and 75001 Sq. ft; Large DC - # of Racks must be in between 3000 and 801 or RFS must be in between 75000 Sq. ft and 20001 Sq. ft; Medium DC # of Racks must be in between 800 and 201 or RFS must be in between 20000 Sq. ft and 5001 Sq. ft; Small DC - # of Racks must be less than 200 or RFS must be less than 5000 Sq. ft.
- TIER TYPE - According to Uptime Institute the data centers are classified into four tiers based on the proficiencies of redundant equipment of the data center infrastructure. In this segment the data center are segmented as Tier 1,Tier 2, Tier 3 and Tier 4.
- COLOCATION TYPE - The segment is segregated into 3 categories namely Retail, Wholesale and Hyperscale Colocation service. The categorization is done based on the amount of IT load leased out to potential customers. Retail colocation service has leased capacity less than 250 kW; Wholesale colocation services has leased capacity between 251 kW and 4 MW and Hyperscale colocation services has leased capacity more than 4 MW.
- END CONSUMERS - The Data Center Market operates on a B2B basis. BFSI, Government, Cloud Operators, Media and Entertainment, E-Commerce, Telecom and Manufacturing are the major end-consumers in the market studied. The scope only includes colocation service operators catering to the increasing digitalization of the end-user industries.
| Keyword | Definition |
|---|---|
| Rack Unit | Generally referred as U or RU, it is the unit of measurement for the server unit housed in the racks in the data center. 1U is equal to 1.75 inches. |
| Rack Density | It defines the amount of power consumed by the equipment and server housed in a rack. It is measured in kilowatt (kW). This factor plays a critical role in data center design and, cooling and power planning. |
| IT Load Capacity | The IT load capacity or installed capacity, refers to the amount of energy consumed by servers and network equipment placed in a rack installed. It is measured in megawatt (MW). |
| Absorption Rate | It denotes how much of the data center capacity has been leased out. For instance, if a 100 MW DC has leased out 75 MW, then the absorption rate would be 75%. It is also referred to as utilization rate and leased-out capacity. |
| Raised Floor Space | It is an elevated space built over the floor. This gap between the original floor and the elevated floor is used to accommodate wiring, cooling, and other data center equipment. This arrangement assists in having proper wiring and cooling infrastructure. It is measured in square feet/meter. |
| Computer Room Air Conditioner (CRAC) | It is a device used to monitor and maintain the temperature, air circulation, and humidity inside the server room in the data center. |
| Aisle | It is the open space between the rows of racks. This open space is critical for maintaining the optimal temperature (20-25 °C) in the server room. There are primarily two aisles inside the server room, a hot aisle and a cold aisle. |
| Cold Aisle | It is the aisle wherein the front of the rack faces the aisle. Here, chilled air is directed into the aisle so that it can enter the front of the racks and maintain the temperature. |
| Hot Aisle | It is the aisle where the back of the racks faces the aisle. Here, the heat dissipated from the equipment’s in the rack is directed to the outlet vent of the CRAC. |
| Critical Load | It includes the servers and other computer equipment whose uptime is critical for data center operation. |
| Power Usage Effectiveness (PUE) | It is a metric which defines the efficiency of a data center. It is calculated by: (𝑇𝑜𝑡𝑎𝑙 𝐷𝑎𝑡𝑎 𝐶𝑒𝑛𝑡𝑒𝑟 𝐸𝑛𝑒𝑟𝑔𝑦 𝐶𝑜𝑛𝑠𝑢𝑚𝑝𝑡𝑖𝑜𝑛)/(𝑇𝑜𝑡𝑎𝑙 𝐼𝑇 𝐸𝑞𝑢𝑖𝑝𝑚𝑒𝑛𝑡 𝐸𝑛𝑒𝑟𝑔𝑦 𝐶𝑜𝑛𝑠𝑢𝑚𝑝𝑡𝑖𝑜𝑛). Further, a data center with a PUE of 1.2-1.5 is considered highly efficient, whereas, a data center with a PUE >2 is considered highly inefficient. |
| Redundancy | It is defined as a system design wherein additional component (UPS, generators, CRAC) is added so that in case of power outage, equipment failure, the IT equipment should not be affected. |
| Uninterruptible Power Supply (UPS) | It is a device that is connected in series with the utility power supply, storing energy in batteries such that the supply from UPS is continuous to IT equipment even during utility power is snapped. The UPS primarily supports the IT equipment only. |
| Generators | Just like UPS, generators are placed in the data center to ensure an uninterrupted power supply, avoiding downtime. Data center facilities have diesel generators and commonly, 48-hour diesel is stored in the facility to prevent disruption. |
| N | It denotes the tools and equipment required for a data center to function at full load. Only "N" indicates that there is no backup to the equipment in the event of any failure. |
| N+1 | Referred to as 'Need plus one', it denotes the additional equipment setup available to avoid downtime in case of failure. A data center is considered N+1 when there is one additional unit for every 4 components. For instance, if a data center has 4 UPS systems, then for to achieve N+1, an additional UPS system would be required. |
| 2N | It refers to fully redundant design wherein two independent power distribution system is deployed. Therefore, in the event of a complete failure of one distribution system, the other system will still supply power to the data center. |
| In-Row Cooling | It is the cooling design system installed between racks in a row where it draws warm air from the hot aisle and supplies cool air to the cold aisle, thereby maintaining the temperature. |
| Tier 1 | Tier classification determines the preparedness of a data center facility to sustain data center operation. A data center is classified as Tier 1 data center when it has a non-redundant (N) power component (UPS, generators), cooling components, and power distribution system (from utility power grids). The Tier 1 data center has an uptime of 99.67% and an annual downtime of <28.8 hours. |
| Tier 2 | A data center is classified as Tier 2 data center when it has a redundant power and cooling components (N+1) and a single non-redundant distribution system. Redundant components include extra generators, UPS, chillers, heat rejection equipment, and fuel tanks. The Tier 2 data center has an uptime of 99.74% and an annual downtime of <22 hours. |
| Tier 3 | A data center having redundant power and cooling components and multiple power distribution systems is referred to as a Tier 3 data center. The facility is resistant to planned (facility maintenance) and unplanned (power outage, cooling failure) disruption. The Tier 3 data center has an uptime of 99.98% and an annual downtime of <1.6 hours. |
| Tier 4 | It is the most tolerant type of data center. A Tier 4 data center has multiple, independent redundant power and cooling components and multiple power distribution paths. All IT equipment are dual powered, making them fault tolerant in case of any disruption, thereby ensuring interrupted operation. The Tier 4 data center has an uptime of 99.74% and an annual downtime of <26.3 minutes. |
| Small Data Center | Data center that has floor space area of ≤ 5,000 Sq. ft or the number of racks that can be installed is ≤ 200 is classified as a small data center. |
| Medium Data Center | Data center which has floor space area between 5,001-20,000 Sq. ft, or the number of racks that can be installed is between 201-800, is classified as a medium data center. |
| Large Data Center | Data center which has floor space area between 20,001-75,000 Sq. ft, or the number of racks that can be installed is between 801-3,000, is classified as a large data center. |
| Massive Data Center | Data center which has floor space area between 75,001-225,000 Sq. ft, or the number of racks that can be installed is between 3001-9,000, is classified as a massive data center. |
| Mega Data Center | Data center that has a floor space area of ≥ 225,001 Sq. ft or the number of racks that can be installed is ≥ 9001 is classified as a mega data center. |
| Retail Colocation | It refers to those customers who have a capacity requirement of 250 kW or less. These services are majorly opted by small and medium enterprises (SMEs). |
| Wholesale Colocation | It refers to those customers who have a capacity requirement between 250 kW to 4 MW. These services are majorly opted by medium to large enterprises. |
| Hyperscale Colocation | It refers to those customers who have a capacity requirement greater than 4 MW. The hyperscale demand primarily originates from large-scale cloud players, IT companies, BFSI, and OTT players (like Netflix, Hulu, and HBO+). |
| Mobile Data Speed | It is the mobile internet speed a user experiences via their smartphones. This speed is primarily dependent on the carrier technology being used in the smartphone. The carrier technologies available in the market are 2G, 3G, 4G, and 5G, where 2G provides the slowest speed while 5G is the fastest. |
| Fiber Connectivity Network | It is a network of optical fiber cables deployed across the country, connecting rural and urban regions with high-speed internet connection. It is measured in kilometer (km). |
| Data Traffic per Smartphone | It is a measure of average data consumption by a smartphone user in a month. It is measured in gigabyte (GB). |
| Broadband Data Speed | It is the internet speed that is supplied over the fixed cable connection. Commonly, copper cable and optic fiber cable are used in both residential and commercial use. Here, optic cable fiber provides faster internet speed than copper cable. |
| Submarine Cable | A submarine cable is a fiber optic cable laid down at two or more landing points. Through this cable, communication and internet connectivity between countries across the globe is established. These cables can transmit 100-200 terabits per second (Tbps) from one point to another. |
| Carbon Footprint | It is the measure of carbon dioxide generated during the regular operation of a data center. Since, coal, and oil & gas are the primary source of power generation, consumption of this power contributes to carbon emissions. Data center operators are incorporating renewable energy sources to curb the carbon footprint emerging in their facilities. |
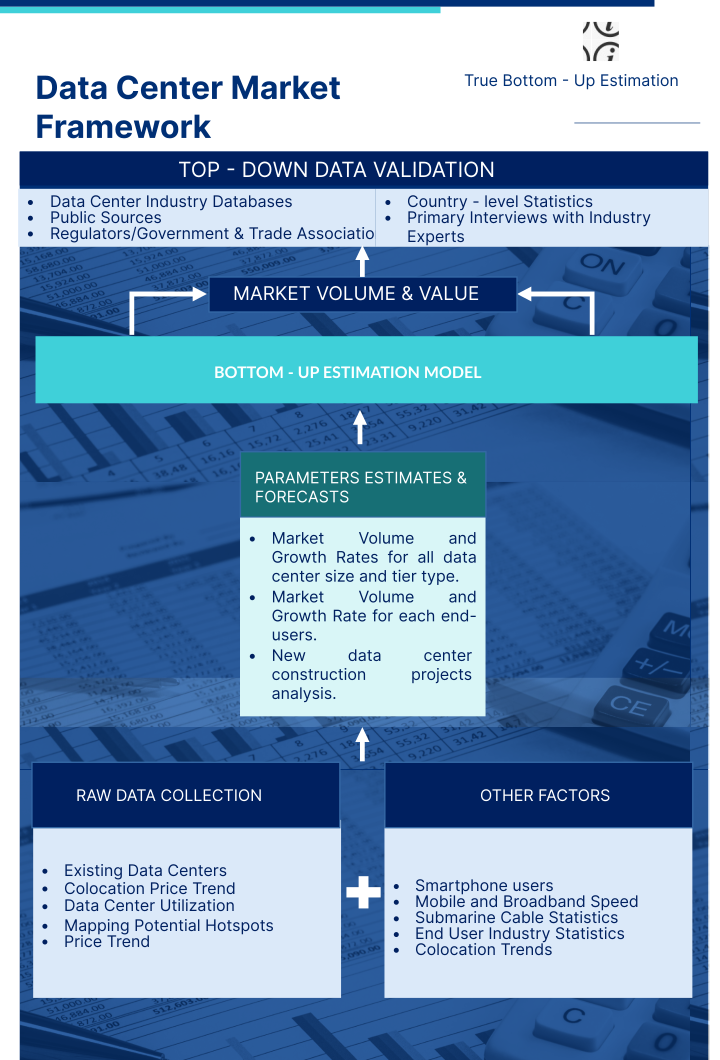
Research Methodology
Mordor Intelligence follows a four-step methodology in all our reports.
- Step-1: Identify Key Variables: In order to build a robust forecasting methodology, the variables and factors identified in Step-1 are tested against available historical market numbers. Through an iterative process, the variables required for market forecast are set and the model is built on the basis of these variables.
- Step-2: Build a Market Model: Market-size estimations for the forecast years are in nominal terms. Inflation is not a part of the pricing, and the average selling price (ASP) is kept constant throughout the forecast period for each country.
- Step-3: Validate and Finalize: In this important step, all market numbers, variables and analyst calls are validated through an extensive network of primary research experts from the market studied. The respondents are selected across levels and functions to generate a holistic picture of the market studied.
- Step-4: Research Outputs: Syndicated Reports, Custom Consulting Assignments, Databases & Subscription Platforms