Market Overview
| Study Period | 2020 - 2031 |
|---|---|
| Forecast Data Period | 2026 - 2031 |
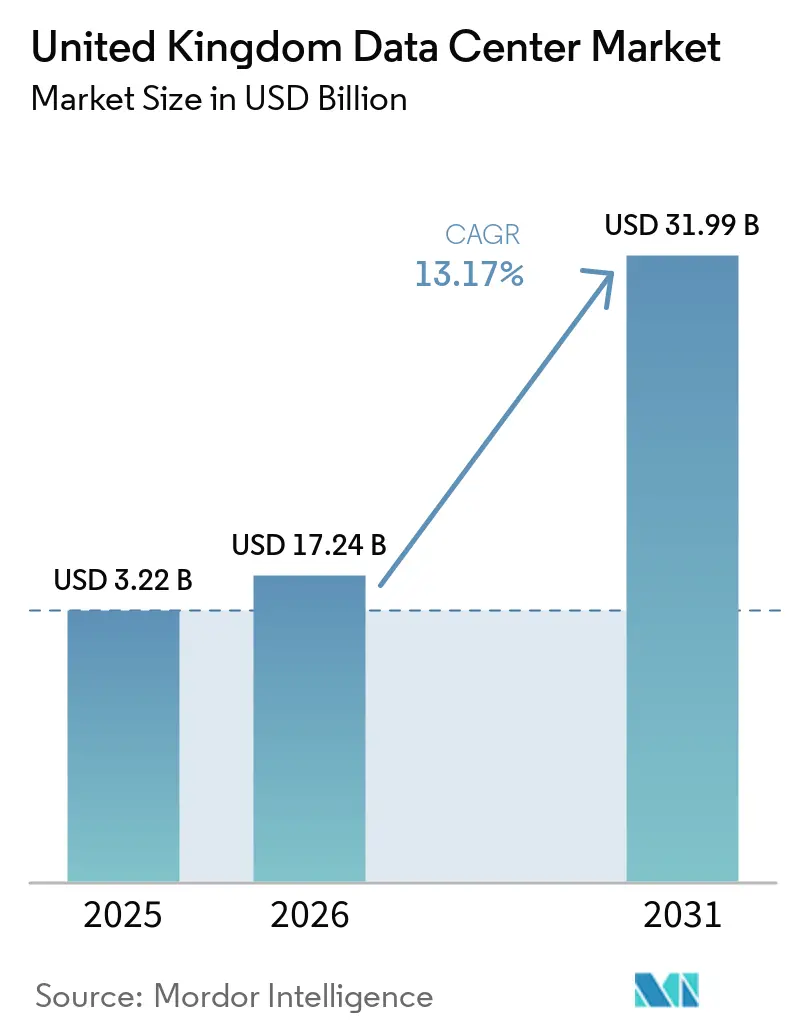
| Base Year Market Size (2025) | USD 3.22 Billion |
| Market Size (2026) | USD 17.24 Billion |
| Market Size (2031) | USD 31.99 Billion |
| Growth Rate (2026 - 2031) | 13.17% CAGR |
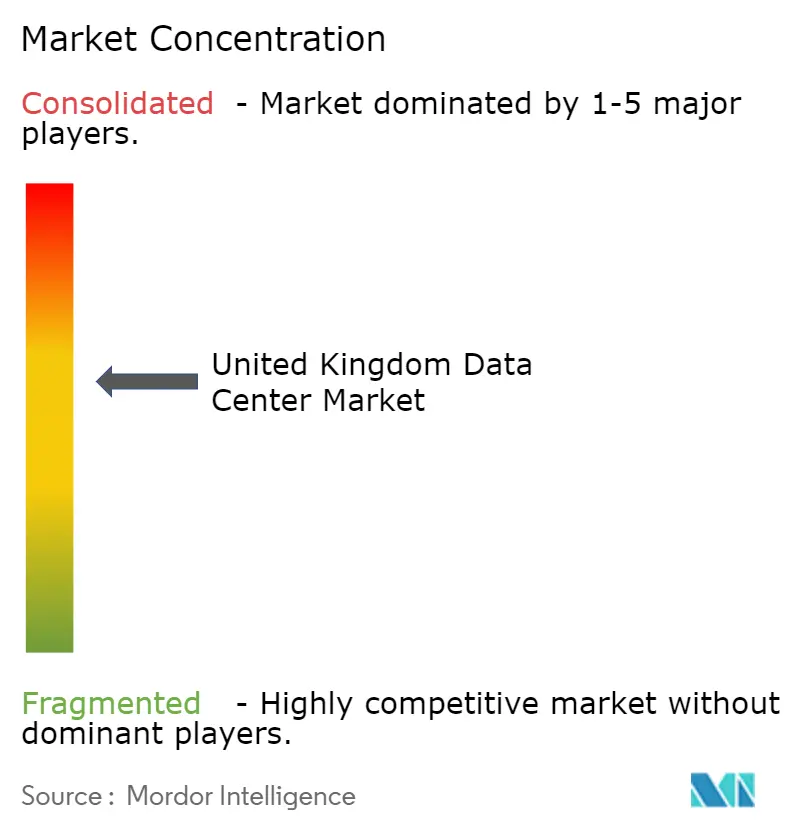
| Market Concentration | Medium |
Major Players *Disclaimer: Major Players sorted in no particular order Image © Mordor Intelligence. Reuse requires attribution under CC BY 4.0. | |
United Kingdom Data Center Market Analysis by Mordor Intelligence
The United Kingdom Data Center Market size was valued at USD 15.23 billion in 2025 and estimated to grow from USD 17.24 billion in 2026 to reach USD 31.99 billion by 2031, at a CAGR of 13.17% during the forecast period (2026-2031). In terms of IT Load Capacity, the market is expected to grow from 3.22 thousand MW in 2025 to 12.41 thousand MW by 2030, at a CAGR of 30.97% during the forecast period (2025-2030). The market segment shares and estimates are calculated and reported in terms of MW. This expansion positions the United Kingdom data center market as Europe’s largest hub for AI infrastructure, underpinned by hyperscale cloud investment, government-backed AI Growth Zones, and an accelerating shift from 5-10 kW enterprise racks to 100-150 kW AI-optimized configurations. Growing private capital commitments exceeding GBP 25 billion (USD 33 billion), coupled with the designation of data centers as Critical National Infrastructure, streamline planning approvals and strengthen investor confidence. Developers confront acute London grid constraints that delay connections by up to three years, prompting a pivot toward northern industrial estates where repurposed factories offer power availability, lower land prices, and renewable energy integration opportunities. The competitive landscape intensifies as colocation incumbents defend an 85.02% revenue base against hyperscale self-builds scaling at more than 31% CAGR, while BFSI adoption of hybrid IT and edge computing fosters demand for latency-sensitive regional capacity. Sustainable operations, liquid cooling expertise, and on-site generation strategies emerge as decisive differentiators across the United Kingdom data center market, shaping facility design choices and supplier relationships from 2025 onward.
Key Report Takeaways
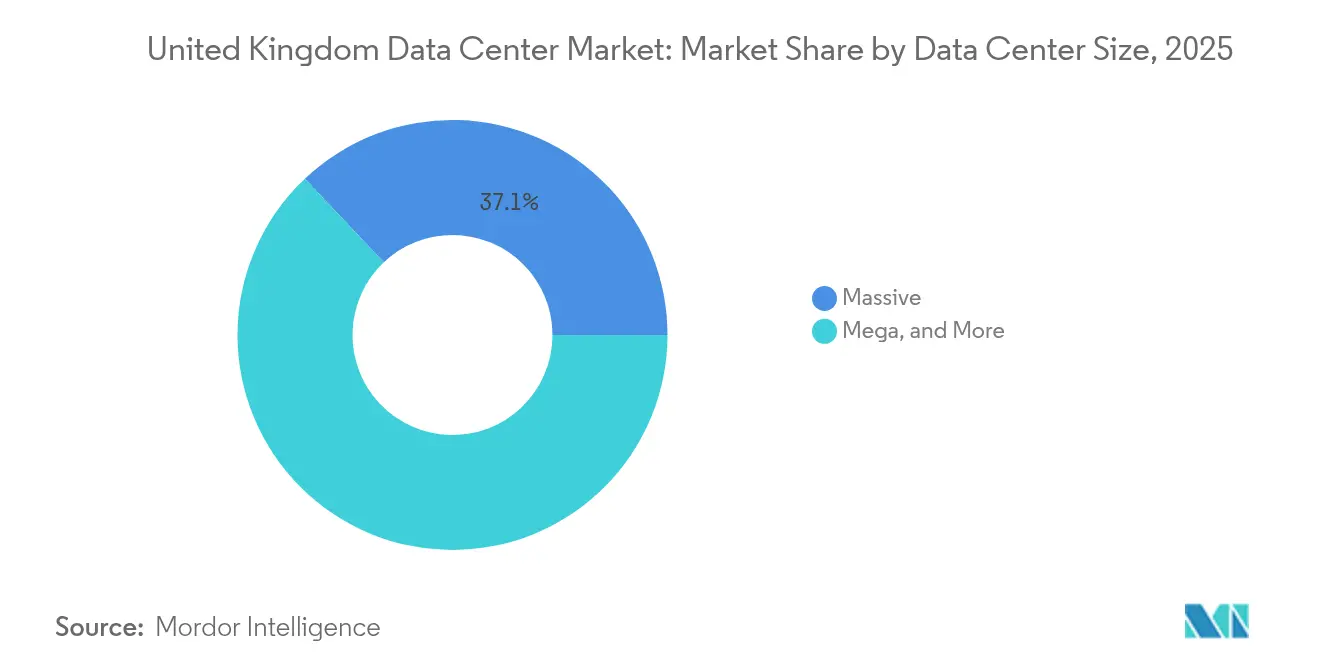
- By data center size, massive facilities led with 37.05% of United Kingdom data center market share in 2025, while mega-scale campuses post the fastest 31.45% CAGR through 2031.
- By tier type, Tier 3 secured 77.92% United Kingdom data center market share in 2025; Tier 4 is forecast to expand at a 31.25% CAGR by 2031.
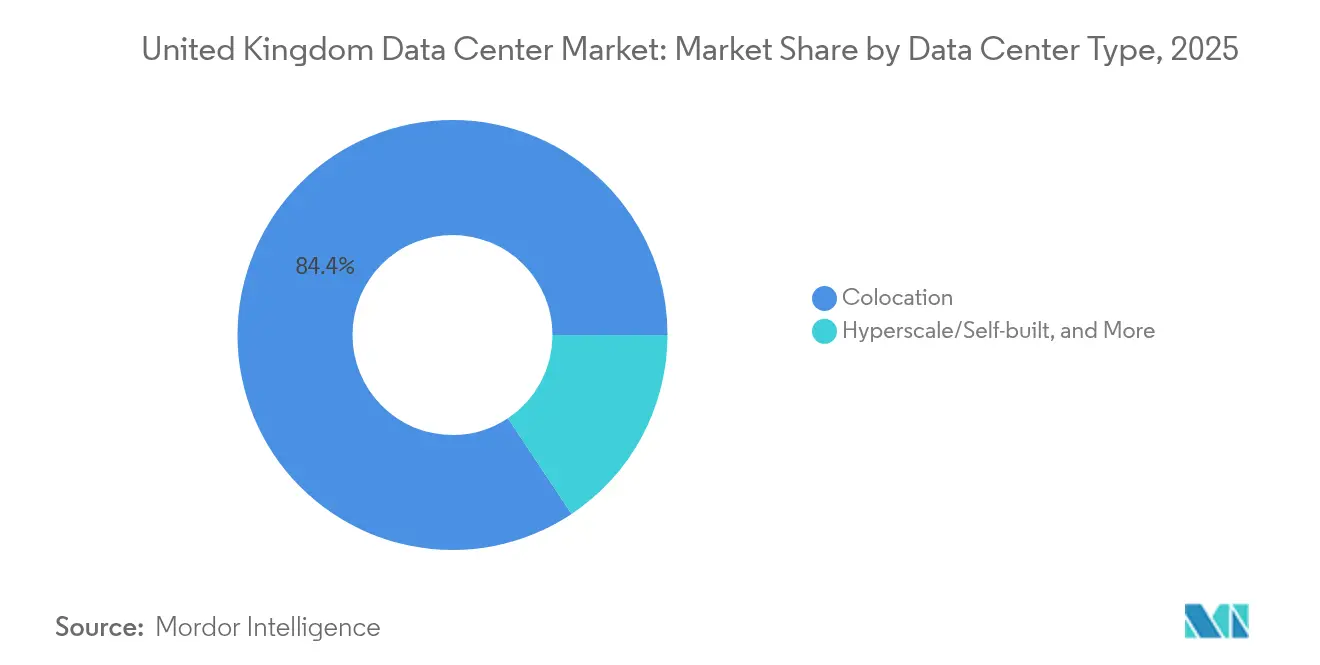
- By data center type, colocation accounted for 84.35% of the United Kingdom data center market size in 2025; hyperscale self-builds will grow at 30.90% CAGR through 2031.
- By end user, IT and telecom commanded 55.12% of the United Kingdom data center market size in 2025; BFSI is advancing at a 30.55% CAGR to 2031.
- By hotspot, Greater London commanded 64.40% of the United Kingdom data center market size in 2025; Rest of United Kingdom is advancing at a 31.90% CAGR to 2031.
Note: Market size and forecast figures in this report are generated using Mordor Intelligence’s proprietary estimation framework, updated with the latest available data and insights as of 2026.
United Kingdom Data Center Market Trends and Insights
Drivers Impact Analysis*
| Driver | (~) % Impact on CAGR Forecast | Geographic Relevance | Impact Timeline |
|---|---|---|---|
| Surge in hyperscale cloud and AI compute demand | +12.50% | National, London and northern hubs | Medium term (2-4 years) |
| Growth of 5G and edge computing across the United Kingdom | +8.20% | Manchester, Leeds, Birmingham | Long term (≥4 years) |
| Rising adoption of hybrid IT among BFSI and enterprise | +6.80% | Greater London, regional banks | Short term (≤2 years) |
| Government incentives and National Planning Framework | +4.30% | AI Growth Zones, Midlands, North | Medium term (2-4 years) |
| New submarine-cable landings on United Kingdom east coast | +3.10% | Cornwall, east-coast regions | Long term (≥4 years) |
| Repurposing legacy industrial estates | +2.80% | Northern England, Scotland, Wales | Medium term (2-4 years) |
| Source: Mordor Intelligence | |||


Surge in hyperscale cloud and AI compute demand
Hyperscale operators drive a structural uplift in rack power density as AI training workloads migrate into purpose-built campuses. Amazon’s GBP 8 billion (USD 10.73 billion) program through 2028, Microsoft’s multi-region estate expansion, and Google’s liquid-cooled cluster roll-outs collectively add more than 1 GW of near-term capacity. Facility blueprints now specify 100-150 kW racks, direct-to-chip liquid loops, and on-site gas turbines to bypass multi-year grid queues [1].Amazon Staff, “AWS Plans to Invest £8 Billion in the UK,” aboutamazon.co.ukThe United Kingdom data center market therefore absorbs deep-tech capital inflows, job creation, and supply-chain localization across switchgear, chillers, and modular power plants.
Growth of 5G and edge computing across the United Kingdom
Nationwide 5G coverage stimulates distributed processing needs that small and medium edge nodes satisfy within a 10 ms latency envelope. Vodafone’s Manchester Edge Lab and BT’s Wavelength alliance furnish reference architectures that operators replicate across urban corridors. Enterprises deploying private 5G in logistics and manufacturing now co-locate micro-data rooms inside campuses, spurring a sub-10 MW segment of the United Kingdom data center market serving IoT analytics and AR-enabled maintenance[2].Vodafone UK, “Edge Innovation Lab Announcement,” vodafone.co.uk
Rising adoption of hybrid IT among BFSI and enterprise segments
Financial regulators enforce data-residency mandates that compel banks to re-patriate workflows from single-provider public cloud toward multi-tenant colocation. Competition authorities scrutinize hyperscale pricing power, accelerating enterprise adoption of carrier-neutral meet-me rooms that integrate direct cloud on-ramps with private low-latency cages. The pattern shifts allocation toward wholesale suites where tenants blend cloud elasticity with facility-level compliance, reinforcing colocation’s relevance inside the United Kingdom data center market.
Government incentives for digital infrastructure and the National Planning Framework
AI Growth Zones in the Midlands and North offer streamlined permitting and skills funding that compress build timelines by nine months on average. Nationally Significant Infrastructure Project status exempts qualifying campuses from local committee vetoes, concentrating large-scale approvals at the Secretary of State level. The policy environment therefore tilts advantage toward developers capable of exceeding 150 MW phases while embedding renewable PPAs that align with 2030 carbon-reduction thresholds.
Restraints Impact Analysis*
| Restraint | (~)% Impact on CAGR Forecast | Geographic Relevance | Impact Timeline |
|---|---|---|---|
| Power-grid connection delays in London availability zones | -8.70% | Greater London, South-East | Short term (≤2 years) |
| Escalating construction and energy costs | -6.20% | National, acute in London | Medium term (2-4 years) |
| Stringent sustainability and carbon-reduction regulations | -4.10% | National, urban hot-spots | Long term (≥4 years) |
| Skilled-labor shortage for liquid-cooling outside London | -3.40% | Northern England, Scotland | Medium term (2-4 years) |
| Source: Mordor Intelligence | |||
Power-grid connection delays in London availability zones
National Grid warns that London data center demand could reach 6 GW by 2035, yet capacity expansions lag, adding multi-year delays to already committed builds. Developers therefore weigh behind-the-meter gas turbines and battery energy-storage systems while scoping northern sites with spare transmission headroom [3].Platform Markets Group, “Platform UK 2025 Report,” digital-infrastructure.com
Escalating construction and energy costs
Electrical switchgear, diesel generators, and lithium-ion packs face extended lead times and up to 20% price volatility. Wholesale energy prices remain above Nordic averages, eroding the United Kingdom data center industry’s competitiveness for AI-intensive footprints. Modular prefabrication and phase overlap techniques now dominate tender specifications as operators seek cost containment [4].Digitalisation World Editorial, “Navigating the Future: Top Challenges for UK Data Centres in 2025,” digitalisationworld.com
*Our forecasts treat driver/restraint impacts as directional, not additive. The impact forecasts reflect baseline growth, mix effects, and variable interactions.
Segment Analysis
By Data Center Size: Massive Facilities Anchor Scale Yet Mega Campuses Accelerate
Massive facilities dominated with 37.05% United Kingdom data center market share in 2025 on the back of multi-tenant colocation halls catering to cloud regions and large enterprises. The segment maintains scale advantages through established fiber routes, mature operations teams, and embedded cross-connect ecosystems. However, mega-campus projects exceeding 250 MW are projected to capture the highest 31.45% CAGR to 2031 as AI workloads necessitate contiguous plots and on-site substations capable of delivering 400 kV feeds. The United Kingdom data center market size for mega campuses is forecast to surpass 6,140 MW by 2031, reflecting strategic pivots by investors seeking long-duration contracts with hyperscale tenants.
Mega-campus design typologies now feature modular power rooms, liquid-cooling manifolds, and roof-mounted dry-coolers that displace water-intensive towers. These projects benefit from economies of scale in equipment procurement and power-purchase agreements, often negotiating 15-year renewable PPAs that stabilize operating costs. In contrast, small and medium data centers align with edge applications and regulatory niches that demand geographic proximity to users, capturing resilient albeit slower-growing demand pockets within the broader United Kingdom data center market.


By Tier Type: Tier 3 Prevails Yet Tier 4 Gains Momentum
Tier 3 accounted for 77.92% United Kingdom data center market share in 2025, underpinning the core colocation offer of concurrent maintainability at a cost-effective redundancy level. Nevertheless, hyperscale AI training, high-frequency trading, and regulated workloads elevate the business case for Tier 4. The United Kingdom data center market size attributable to Tier 4 is set to expand from 892 MW in 2026 to 3,474 MW by 2031, reflecting a 31.25% CAGR.
Tier 4 adoption hinges on fully independent dual power paths, fault-tolerant cooling, and 99.995% uptime SLAs that minimize downtime costs measured in millions per hour for AI model retraining or financial order-book slippage. Operators proactively retrofit Tier 3 halls with additional UPS strings and looped chilled-water rings to bridge the redundancy gap while preserving sunk capex. London’s regulatory recognition of data centers as Critical National Infrastructure accelerates this trend, as mission-critical tenants demand the highest assurance levels for cybersecurity and operational resilience.
By Data Center Type: Colocation Remains Dominant but Hyperscale Self-Build Surges
Colocation services retained 84.35% of the United Kingdom data center market size in 2025 as enterprises and tier-two cloud providers rely on shared facilities for flexibility and carrier diversity. However, hyperscale self-build programs now drive a 30.90% CAGR through 2031, potentially capturing 25% of incremental capacity additions. Direct investment affords cloud providers vertical control over supply chains, internal networking, and cooling technologies tailored for proprietary AI accelerators.
The divergent strategies shape vendor ecosystems: colocation operators differentiate through AI-ready suites, immersion-cooling pods, and curated sustainability reporting, whereas hyperscale builders secure multi-gigawatt grid contracts and innovate with on-site generation such as gas turbines and waste-to-energy modules. Enterprise edge deployments, meanwhile, exploit modular containerized formats that interconnect to regional 5G cores, reinforcing heterogeneity across the United Kingdom data center market.
By End User: IT and Telecom Hold Leadership While BFSI Outpaces Growth
IT and telecom clients accounted for 55.12% of the United Kingdom data center market size in 2025, reflecting perennial demand from network function virtualization, CDN nodes, and SaaS workloads. Banking, financial services, and insurance emerge as the fastest-growing vertical, expanding at 30.55% CAGR through 2031 as digital banking adoption, algorithmic trading, and real-time payment schemes proliferate.
BFSI tenants prioritize sovereign data residency and sub-2 ms round-trip latency to stock-exchange engines; thus, they gravitate toward London’s Docklands fiber nexus yet increasingly adopt dual-region strategies that replicate critical workloads in northern sites for redundancy. Government agencies, e-commerce platforms, and media studios contribute supplementary demand streams, collectively diversifying the United Kingdom data center market against sector-specific shocks.
Geography Analysis
Greater London sustains 64.40% United Kingdom data center market share in 2025, leveraging unrivaled submarine cable density and financial-services proximity. Yet power connection queues of up to 36 months constrain near-term expansions, compelling developers to negotiate private substations or behind-the-meter generation that inflate project costs and complexity. London’s installed base surpasses 1 GW, with an additional 1.3 GW in committed pipelines; nonetheless, further growth hinges on National Grid’s accelerated upgrade schedule and demand-side flexibility programs that free up headroom for new entrants.
Northern England, Scotland, and Wales together grow at 31.90% CAGR and collectively exceed 3.45 GW by 2031. Blackstone’s QTS Northumberland campus, Kao Data’s Manchester facility, and Stellium’s Newcastle immersion-cooling deployment illustrate the region’s momentum. Abundant land parcels, existing industrial grid feeds, and renewable energy sources, notably offshore wind and hydro power, enhance cost competitiveness. Local development agencies sweeten propositions with tax incentives and fast-track planning, elevating these regions as credible alternatives within the United Kingdom data center market.
East-coast counties like Lincolnshire and Norfolk experience a renaissance driven by new trans-Atlantic cable terminations that lower latency to North America. These landings anchor beachfront meet-me rooms and spur edge aggregation nodes throughout rural hinterlands. The resulting geographic diversification improves national resilience, distributes economic benefits, and underpins nationwide AI adoption objectives framed in the government’s AI Opportunities Action Plan.
Competitive Landscape
The vendor landscape shows moderate concentration: the top five colocation providers control roughly 65% of commissioned MW. Digital Realty, Equinix, and VIRTUS Data Centres retain pole positions through landbank acquisitions and multi-building campuses, yet hyperscale owner-operators such as Amazon, Microsoft, and Google increasingly absorb demand that might otherwise flow into wholesale colocation suites.
Competition now pivots on technical differentiation. Operators race to master liquid cooling, immersion pods, and direct-to-chip loops capable of dissipating 100 kW per rack. Stellium, for instance, demonstrates Newcastle’s first production immersion hall serving AI tenants; Cyan LON6 integrates waste-heat capture with district heating to satisfy municipal decarbonization mandates. Sustainability credentials, including 24/7 renewable matching and carbon removal pilots such as Orbital’s direct-air-capture module at Civo, elevate brand equity among ESG-focused clients.
Private equity funding accelerates consolidation and green-field builds. Transactions such as Oak Hill’s Pulsant acquisition and DigitalBridge’s pursuit of Yondr expand capital pools and management bandwidth necessary to deliver multi-gigawatt pipelines. Meanwhile, regional specialists like Green Mountain, Ark, and Global Switch carve niches in permissioned environments, offering sovereign hosting or high-security enclosures that align with public-sector and defense requirements.
United Kingdom Data Center Industry Leaders
Digital Realty Trust Inc.
Equinix Inc.
Rackspace Technology Inc.
NTT Corporation
VIRTUS Data Centres Ltd (ST Telemedia Global Data Centres)
- *Disclaimer: Major Players sorted in no particular order

Recent Industry Developments
- March 2025: Blackstone secured planning for a GBP 10 billion (USD 13.41 billion) QTS campus in Northumberland, one of the United Kingdom’s largest single data center projects.
- July 2025: SWI Group announced a 330 MW AiOnX hyperscale facility between Cambridge and Peterborough.
- June 2025: CyrusOne unveiled the 90 MW LON6 campus in Buckinghamshire with Tier 4 design and BREEAM-Excellent targets.
- April 2025: Orbital deployed direct-air-capture units at Civo’s site near London, using waste heat for carbon removal.


United Kingdom Data Center Market Report Scope
London are covered as segments by Hotspot. Large, Massive, Medium, Mega, Small are covered as segments by Data Center Size. Tier 1 and 2, Tier 3, Tier 4 are covered as segments by Tier Type. Non-Utilized, Utilized are covered as segments by Absorption.
By Data Center Size
| Small |
| Medium |
| Large |
| Mega |
| Massive |
By Tier Type
| Tier 1 and 2 |
| Tier 3 |
| Tier 4 |
By Data Center Type
| Hyperscale / Self-built | ||
| Enterprise / Edge | ||
| Colocation | Non-Utilized | |
| Utilized | Retail Colocation | |
| Wholesale Colocation | ||
By End User
| BFSI |
| IT and ITES |
| E-Commerce |
| Government |
| Manufacturing |
| Media and Entertainment |
| Telecom |
| Other End Users |
By Hotspot
| Greater London |
| Rest of United Kingdom |
| By Data Center Size | Small | ||
| Medium | |||
| Large | |||
| Mega | |||
| Massive | |||
| By Tier Type | Tier 1 and 2 | ||
| Tier 3 | |||
| Tier 4 | |||
| By Data Center Type | Hyperscale / Self-built | ||
| Enterprise / Edge | |||
| Colocation | Non-Utilized | ||
| Utilized | Retail Colocation | ||
| Wholesale Colocation | |||
| By End User | BFSI | ||
| IT and ITES | |||
| E-Commerce | |||
| Government | |||
| Manufacturing | |||
| Media and Entertainment | |||
| Telecom | |||
| Other End Users | |||
| By Hotspot | Greater London | ||
| Rest of United Kingdom | |||


Market Definition
- IT LOAD CAPACITY - The IT load capacity or installed capacity, refers to the amount of energy consumed by servers and network equipments placed in a rack installed. It is measured in megawatt (MW).
- ABSORPTION RATE - It denotes the extend to which the data center capacity has been leased out. For instance, a 100 MW DC has leased out 75 MW, then absorption rate would be 75%. It is also referred as utilization rate and leased-out capacity.
- RAISED FLOOR SPACE - It is an elevated space build over the floor. This gap between the original floor and the elevated floor is used to accommodate wiring, cooling, and other data center equipment. This arrangement assist in having proper wiring and cooling infrastructure. It is measured in square feet (ft^2).
- DATA CENTER SIZE - Data Center Size is segmented based on the raised floor space allocated to the data center facilities. Mega DC - # of Racks must be more than 9000 or RFS (raised floor space) must be more than 225001 Sq. ft; Massive DC - # of Racks must be in between 9000 and 3001 or RFS must be in between 225000 Sq. ft and 75001 Sq. ft; Large DC - # of Racks must be in between 3000 and 801 or RFS must be in between 75000 Sq. ft and 20001 Sq. ft; Medium DC # of Racks must be in between 800 and 201 or RFS must be in between 20000 Sq. ft and 5001 Sq. ft; Small DC - # of Racks must be less than 200 or RFS must be less than 5000 Sq. ft.
- TIER TYPE - According to Uptime Institute the data centers are classified into four tiers based on the proficiencies of redundant equipment of the data center infrastructure. In this segment the data center are segmented as Tier 1,Tier 2, Tier 3 and Tier 4.
- COLOCATION TYPE - The segment is segregated into 3 categories namely Retail, Wholesale and Hyperscale Colocation service. The categorization is done based on the amount of IT load leased out to potential customers. Retail colocation service has leased capacity less than 250 kW; Wholesale colocation services has leased capacity between 251 kW and 4 MW and Hyperscale colocation services has leased capacity more than 4 MW.
- END CONSUMERS - The Data Center Market operates on a B2B basis. BFSI, Government, Cloud Operators, Media and Entertainment, E-Commerce, Telecom and Manufacturing are the major end-consumers in the market studied. The scope only includes colocation service operators catering to the increasing digitalization of the end-user industries.
| Keyword | Definition |
|---|---|
| Rack Unit | Generally referred as U or RU, it is the unit of measurement for the server unit housed in the racks in the data center. 1U is equal to 1.75 inches. |
| Rack Density | It defines the amount of power consumed by the equipment and server housed in a rack. It is measured in kilowatt (kW). This factor plays a critical role in data center design and, cooling and power planning. |
| IT Load Capacity | The IT load capacity or installed capacity, refers to the amount of energy consumed by servers and network equipment placed in a rack installed. It is measured in megawatt (MW). |
| Absorption Rate | It denotes how much of the data center capacity has been leased out. For instance, if a 100 MW DC has leased out 75 MW, then the absorption rate would be 75%. It is also referred to as utilization rate and leased-out capacity. |
| Raised Floor Space | It is an elevated space built over the floor. This gap between the original floor and the elevated floor is used to accommodate wiring, cooling, and other data center equipment. This arrangement assists in having proper wiring and cooling infrastructure. It is measured in square feet/meter. |
| Computer Room Air Conditioner (CRAC) | It is a device used to monitor and maintain the temperature, air circulation, and humidity inside the server room in the data center. |
| Aisle | It is the open space between the rows of racks. This open space is critical for maintaining the optimal temperature (20-25 °C) in the server room. There are primarily two aisles inside the server room, a hot aisle and a cold aisle. |
| Cold Aisle | It is the aisle wherein the front of the rack faces the aisle. Here, chilled air is directed into the aisle so that it can enter the front of the racks and maintain the temperature. |
| Hot Aisle | It is the aisle where the back of the racks faces the aisle. Here, the heat dissipated from the equipment’s in the rack is directed to the outlet vent of the CRAC. |
| Critical Load | It includes the servers and other computer equipment whose uptime is critical for data center operation. |
| Power Usage Effectiveness (PUE) | It is a metric which defines the efficiency of a data center. It is calculated by: (𝑇𝑜𝑡𝑎𝑙 𝐷𝑎𝑡𝑎 𝐶𝑒𝑛𝑡𝑒𝑟 𝐸𝑛𝑒𝑟𝑔𝑦 𝐶𝑜𝑛𝑠𝑢𝑚𝑝𝑡𝑖𝑜𝑛)/(𝑇𝑜𝑡𝑎𝑙 𝐼𝑇 𝐸𝑞𝑢𝑖𝑝𝑚𝑒𝑛𝑡 𝐸𝑛𝑒𝑟𝑔𝑦 𝐶𝑜𝑛𝑠𝑢𝑚𝑝𝑡𝑖𝑜𝑛). Further, a data center with a PUE of 1.2-1.5 is considered highly efficient, whereas, a data center with a PUE >2 is considered highly inefficient. |
| Redundancy | It is defined as a system design wherein additional component (UPS, generators, CRAC) is added so that in case of power outage, equipment failure, the IT equipment should not be affected. |
| Uninterruptible Power Supply (UPS) | It is a device that is connected in series with the utility power supply, storing energy in batteries such that the supply from UPS is continuous to IT equipment even during utility power is snapped. The UPS primarily supports the IT equipment only. |
| Generators | Just like UPS, generators are placed in the data center to ensure an uninterrupted power supply, avoiding downtime. Data center facilities have diesel generators and commonly, 48-hour diesel is stored in the facility to prevent disruption. |
| N | It denotes the tools and equipment required for a data center to function at full load. Only "N" indicates that there is no backup to the equipment in the event of any failure. |
| N+1 | Referred to as 'Need plus one', it denotes the additional equipment setup available to avoid downtime in case of failure. A data center is considered N+1 when there is one additional unit for every 4 components. For instance, if a data center has 4 UPS systems, then for to achieve N+1, an additional UPS system would be required. |
| 2N | It refers to fully redundant design wherein two independent power distribution system is deployed. Therefore, in the event of a complete failure of one distribution system, the other system will still supply power to the data center. |
| In-Row Cooling | It is the cooling design system installed between racks in a row where it draws warm air from the hot aisle and supplies cool air to the cold aisle, thereby maintaining the temperature. |
| Tier 1 | Tier classification determines the preparedness of a data center facility to sustain data center operation. A data center is classified as Tier 1 data center when it has a non-redundant (N) power component (UPS, generators), cooling components, and power distribution system (from utility power grids). The Tier 1 data center has an uptime of 99.67% and an annual downtime of <28.8 hours. |
| Tier 2 | A data center is classified as Tier 2 data center when it has a redundant power and cooling components (N+1) and a single non-redundant distribution system. Redundant components include extra generators, UPS, chillers, heat rejection equipment, and fuel tanks. The Tier 2 data center has an uptime of 99.74% and an annual downtime of <22 hours. |
| Tier 3 | A data center having redundant power and cooling components and multiple power distribution systems is referred to as a Tier 3 data center. The facility is resistant to planned (facility maintenance) and unplanned (power outage, cooling failure) disruption. The Tier 3 data center has an uptime of 99.98% and an annual downtime of <1.6 hours. |
| Tier 4 | It is the most tolerant type of data center. A Tier 4 data center has multiple, independent redundant power and cooling components and multiple power distribution paths. All IT equipment are dual powered, making them fault tolerant in case of any disruption, thereby ensuring interrupted operation. The Tier 4 data center has an uptime of 99.74% and an annual downtime of <26.3 minutes. |
| Small Data Center | Data center that has floor space area of ≤ 5,000 Sq. ft or the number of racks that can be installed is ≤ 200 is classified as a small data center. |
| Medium Data Center | Data center which has floor space area between 5,001-20,000 Sq. ft, or the number of racks that can be installed is between 201-800, is classified as a medium data center. |
| Large Data Center | Data center which has floor space area between 20,001-75,000 Sq. ft, or the number of racks that can be installed is between 801-3,000, is classified as a large data center. |
| Massive Data Center | Data center which has floor space area between 75,001-225,000 Sq. ft, or the number of racks that can be installed is between 3001-9,000, is classified as a massive data center. |
| Mega Data Center | Data center that has a floor space area of ≥ 225,001 Sq. ft or the number of racks that can be installed is ≥ 9001 is classified as a mega data center. |
| Retail Colocation | It refers to those customers who have a capacity requirement of 250 kW or less. These services are majorly opted by small and medium enterprises (SMEs). |
| Wholesale Colocation | It refers to those customers who have a capacity requirement between 250 kW to 4 MW. These services are majorly opted by medium to large enterprises. |
| Hyperscale Colocation | It refers to those customers who have a capacity requirement greater than 4 MW. The hyperscale demand primarily originates from large-scale cloud players, IT companies, BFSI, and OTT players (like Netflix, Hulu, and HBO+). |
| Mobile Data Speed | It is the mobile internet speed a user experiences via their smartphones. This speed is primarily dependent on the carrier technology being used in the smartphone. The carrier technologies available in the market are 2G, 3G, 4G, and 5G, where 2G provides the slowest speed while 5G is the fastest. |
| Fiber Connectivity Network | It is a network of optical fiber cables deployed across the country, connecting rural and urban regions with high-speed internet connection. It is measured in kilometer (km). |
| Data Traffic per Smartphone | It is a measure of average data consumption by a smartphone user in a month. It is measured in gigabyte (GB). |
| Broadband Data Speed | It is the internet speed that is supplied over the fixed cable connection. Commonly, copper cable and optic fiber cable are used in both residential and commercial use. Here, optic cable fiber provides faster internet speed than copper cable. |
| Submarine Cable | A submarine cable is a fiber optic cable laid down at two or more landing points. Through this cable, communication and internet connectivity between countries across the globe is established. These cables can transmit 100-200 terabits per second (Tbps) from one point to another. |
| Carbon Footprint | It is the measure of carbon dioxide generated during the regular operation of a data center. Since, coal, and oil & gas are the primary source of power generation, consumption of this power contributes to carbon emissions. Data center operators are incorporating renewable energy sources to curb the carbon footprint emerging in their facilities. |


Research Methodology
Mordor Intelligence follows a four-step methodology in all our reports.
- Step-1: Identify Key Variables: In order to build a robust forecasting methodology, the variables and factors identified in Step-1 are tested against available historical market numbers. Through an iterative process, the variables required for market forecast are set and the model is built on the basis of these variables.
- Step-2: Build a Market Model: Market-size estimations for the forecast years are in nominal terms. Inflation is not a part of the pricing, and the average selling price (ASP) is kept constant throughout the forecast period for each country.
- Step-3: Validate and Finalize: In this important step, all market numbers, variables and analyst calls are validated through an extensive network of primary research experts from the market studied. The respondents are selected across levels and functions to generate a holistic picture of the market studied.
- Step-4: Research Outputs: Syndicated Reports, Custom Consulting Assignments, Databases & Subscription Platforms


