Market Overview
| Study Period | 2020 - 2031 |
|---|---|
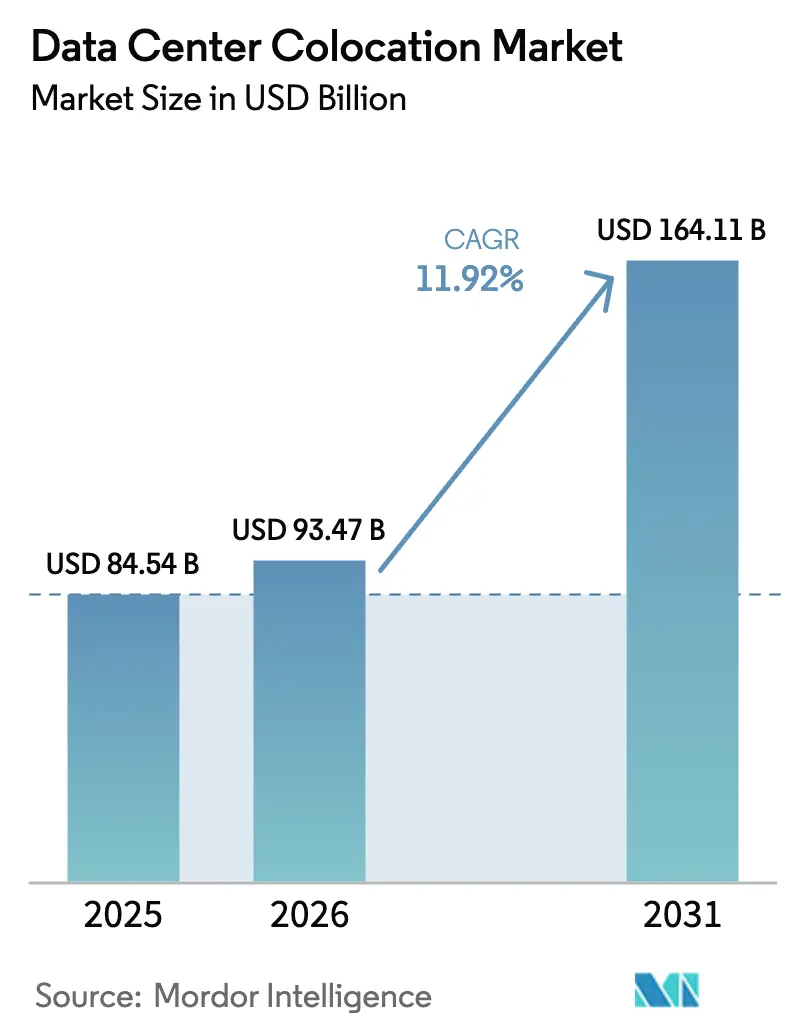
| Market Size (2026) | USD 93.47 Billion |
| Market Size (2031) | USD 164.11 Billion |
| Growth Rate (2026 - 2031) | 11.92% CAGR |
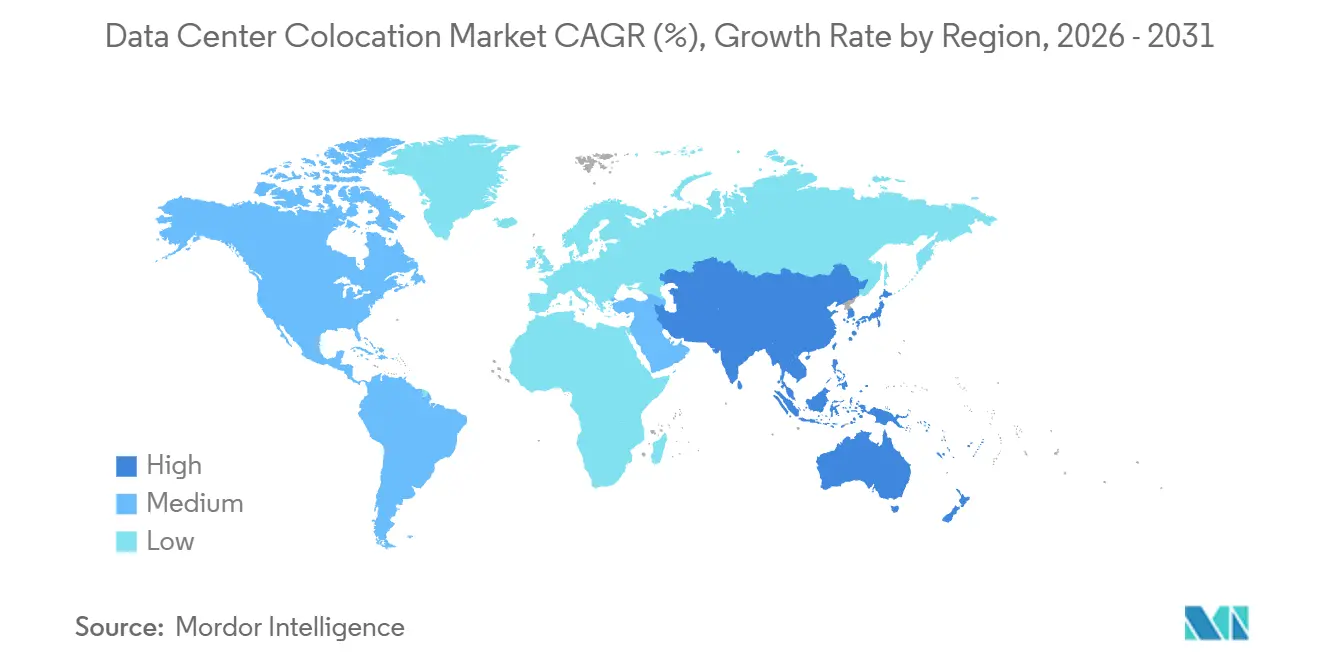
| Fastest Growing Market | Asia Pacific |
| Largest Market | North America |
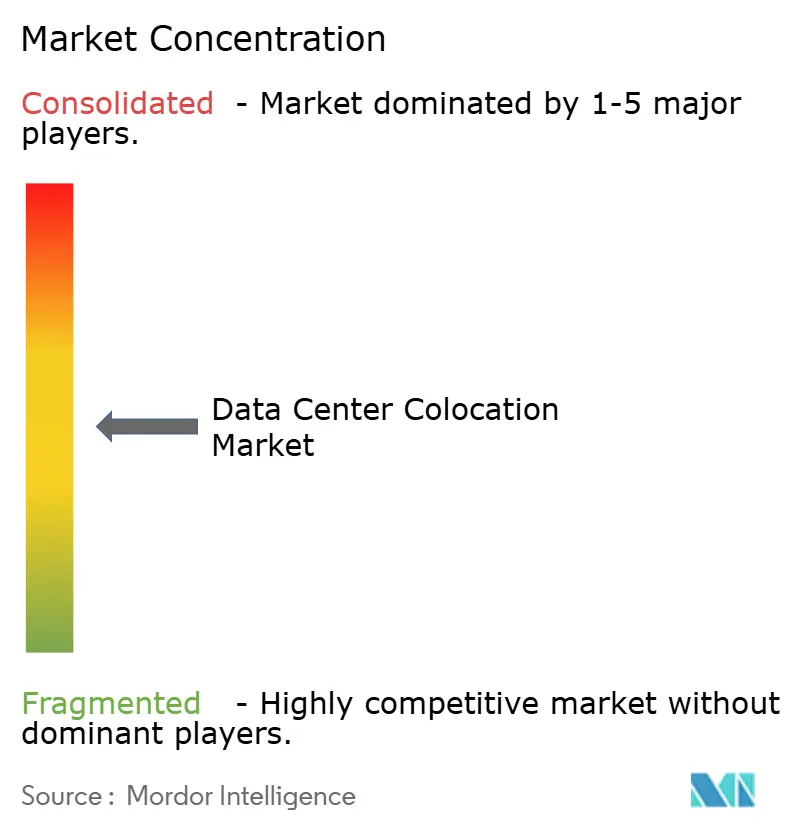
| Market Concentration | Medium |
Major Players *Disclaimer: Major Players sorted in no particular order Image © Mordor Intelligence. Reuse requires attribution under CC BY 4.0. | |
Data Center Colocation Market Analysis by Mordor Intelligence
The data center colocation market size is expected to increase from USD 84.54 billion in 2025 to USD 93.47 billion in 2026 and reach USD 164.11 billion by 2031, growing at a CAGR of 11.92% over 2026-2031. Enterprises are exiting captive server rooms because third-party halls now shoulder the large capital outlays and intricate engineering required for AI-scale computing. Operators that pre-install liquid-cooling loops, reserve medium-voltage utility feeds, and guarantee certified staff monetize this shift through long-term, take-or-pay leases struck well before groundbreaking. Utility-imposed caps in Northern Virginia, Singapore, and Dublin are stretching approval timelines to three or four years, which tightens near-term supply and sustains double-digit pricing in the most mature metros. At the same time, data-sovereignty mandates in the European Union, India, and the Middle East force public-sector and regulated workloads to remain inside national borders, reinforcing durable structural demand for the data center colocation market. These intertwined supply constraints and policy tailwinds collectively underpin a decade of robust expansion for providers that can secure land, power, and renewable guarantees in strategic locations.
Key Report Takeaways
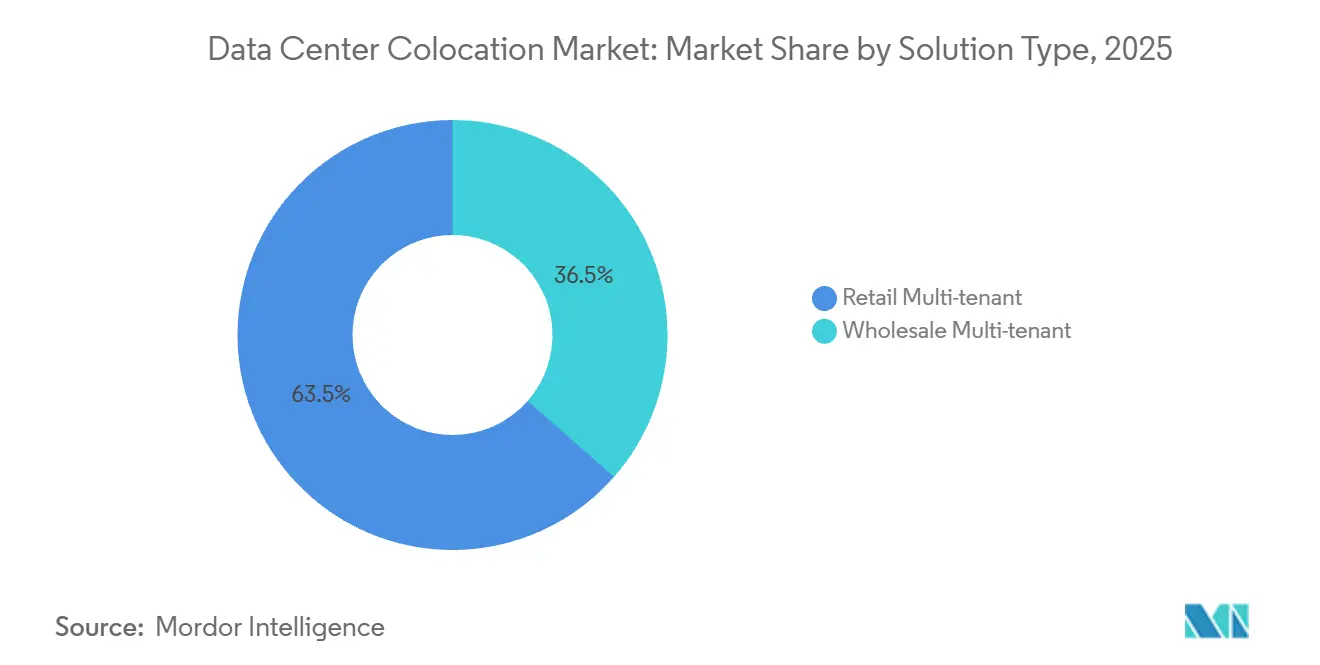
- By solution type, retail multi-tenant halls captured 63.53% of share in 2025, whereas wholesale suites are set to expand at a 12.32% CAGR through 2031.
- By tier classification, tier 3 facilities held 46.43% of the data center colocation market share in 2025, while tier 4 halls are projected to grow at a 12.56% CAGR during 2026-2031.
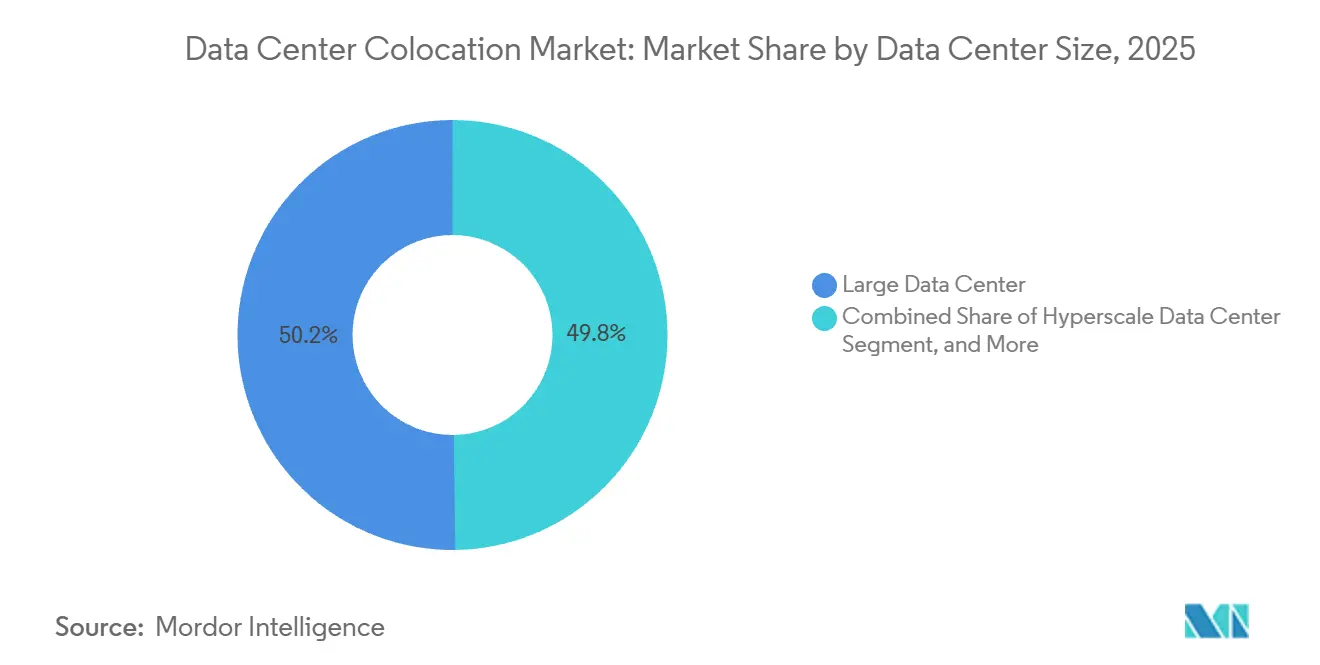
- By facility size, large data centers commanded 50.21% of share in 2025, and hyperscale campuses are forecast to post a 12.45% CAGR across the same horizon.
- By geography, North America accounted for 40.54% of share in 2025, and Asia-Pacific is expected to record the fastest 12.68% CAGR to 2031.
Note: Market size and forecast figures in this report are generated using Mordor Intelligence’s proprietary estimation framework, updated with the latest available data and insights as of 2026.
Global Data Center Colocation Market Trends and Insights
Drivers Impact Analysis*
| Driver | (~) % Impact on CAGR Forecast | Geographic Relevance | Impact Timeline |
|---|---|---|---|
| AI-Driven Workload Density Requiring Liquid-Cool-Ready Suites | +3.2% | Global, strong in North America and Asia-Pacific | Short term (≤ 2 years) |
| Proliferation of Data from IoT, AI And Edge Workloads | +2.8% | Global with faster uptake in Asia-Pacific and Europe | Medium term (2-4 years) |
| Stricter Data-Sovereignty Laws Boosting In-Country Demand | +2.4% | Europe, Asia-Pacific, Middle East | Medium term (2-4 years) |
| Increasing Integration of Cloud and SaaS Workloads | +2.1% | Global | Long term (≥ 4 years) |
| Sovereign-AI Initiatives Requiring Trusted Third-Party Capacity | +1.8% | Europe, Middle East, India | Medium term (2-4 years) |
| Emergence of SMR-Based On-Site Nuclear Power for Mega Campuses | +1.5% | North America, Europe | Long term (≥ 4 years) |
| Source: Mordor Intelligence | |||
AI-Driven Workload Density Requiring Liquid-Cool-Ready Suites
Liquid-cool-ready architecture has shifted from niche to mainstream because generative-AI clusters already draw 40-80 kilowatts per rack, a threshold air-cooling cannot meet economically.[1]DatacenterDynamics Staff, “Cooling Retrofits for High-Density Racks,” datacenterdynamics.com Operators are retrofitting rear-door heat exchangers, chilled-water manifolds, and leak-detection systems while provisioning one-megawatt thermal removal capacity per row in new halls. Equinix stated in its 2025 annual report that 22% of deployments demanded liquid cooling versus 9% in 2024, triggering a USD 1.2 billion global retrofit budget.[2]Equinix Investor Relations, “2025 Annual Report,” equinix.comUptime Institute’s 2025 survey found that 68% of enterprises expect average rack density to exceed 30 kilowatts by 2027, highlighting the urgency of modernization. Providers able to certify liquid-ready suites quickly stand to capture premium pricing until competing capacity enters service.
Proliferation of Data from IoT, AI and Edge Workloads
Worldwide data creation hit 120 zettabytes in 2025, and 40% of the incremental volume derived from latency-sensitive IoT sensors, autonomous vehicles, and industrial robots. Edge colocation nodes of 1-5 megawatts are mushrooming in suburban grids so traffic can be filtered within 10 milliseconds before backhaul, easing congestion on long-haul links. Vapor IO operates 320 edge sites across 180 U.S. metros, each bundled with 5G small-cell radios and sub-5-millisecond fiber paths to public-cloud on-ramps. In Asia-Pacific, NTT Communications deployed 85 micro-nodes across Japan in 2025 to support real-time video analytics and vehicle-to-infrastructure messaging.[3]NTT Communications, “Edge Node Rollout,” ntt.com This localization fragments demand into thousands of micro-leases, opening the door for regional specialists that can master municipal permitting, street-level fiber laterals, and neighborhood power feeds.
Stricter Data-Sovereignty Laws Boosting In-Country Demand
The European Union Data Act, effective September 2025, bars some cross-border transfers of public-sector and industrial data, compelling enterprises to host workloads inside member states. India’s Digital Personal Data Protection Act, enacted August 2024, requires sensitive personal data to remain on servers physically in India, pushing multinational corporations toward Mumbai, Bangalore, and Hyderabad capacity. Saudi Arabia’s Personal Data Protection Law, live since January 2025, drives hyperscalers to wholesale campuses inside the NEOM tech zone where the state underwrites fiber and power. These statutes elevate compliance and proximity over cheap power as site-selection criteria, which boosts sticky demand for domestic colocation leases. Operators fluent in local policy close contracts faster and achieve higher renewal rates than pure cost competitors.
Increasing Integration of Cloud and SaaS Workloads
Hybrid IT architectures increasingly knit together colocation racks and multiple public clouds via software-defined fabrics, creating traffic patterns that resemble a private metro internet. Equinix Fabric carried 3.2 exabytes of monthly traffic in February 2026, a 47% year-over-year increase, as customers built private virtual circuits to Amazon Web Services, Microsoft Azure, and Google Cloud without exposing data to the public internet. Digital Realty noted that PlatformDIGITAL bookings rose 38% in 2025 because enterprises prefer single-contract bundles that combine racks, cross-connects, and managed services. SaaS giants cluster in the same campuses, letting tenants peer directly and slash transit charges, which further strengthens the campus network effect. As latency and regulatory guarantees grow more critical, densely interconnected halls become indispensable anchor points in global IT supply chains.
Restraints Impact Analysis*
| Restraint | (~) % Impact on CAGR Forecast | Geographic Relevance | Impact Timeline |
|---|---|---|---|
| Chronic Grid-Power and Land Shortages in Tier-1 Metros | -2.6% | North America (Northern Virginia, Phoenix), Europe (Dublin, Frankfurt), Asia-Pacific (Singapore) | Short term (≤ 2 years) |
| High Up-Front Build Cost Amid Elevated Interest Rates | -2.1% | Global | Short term (≤ 2 years) |
| Carbon-Tax Escalation Raising Opex Unpredictability | -1.4% | Europe, emerging in North America | Medium term (2-4 years) |
| Rising Insurance Premiums Linked to Climate Risk | -1.2% | North America, Europe, Asia-Pacific coastal markets | Medium term (2-4 years) |
| Source: Mordor Intelligence | |||
Chronic Grid-Power and Land Shortages in Tier-1 Metros
Dominion Energy placed new Northern Virginia interconnection requests into a 36-month queue in July 2025, effectively pausing the world’s largest cluster until 2028 substation upgrades arrive. Singapore’s Energy Market Authority kept its moratorium through December 2026, clearing only proposals that achieve sub-1.3 power-usage effectiveness and source 80% renewable electricity. Dublin’s EirGrid capped additional data-center load at 200 megawatts, pushing developers toward Cork and Limerick where wind-farm integration is stronger. Land in Phoenix, Dallas, and Amsterdam surged 60-80% in 2025 because investors chased parcels adjacent to 230-kilovolt lines and dark-fiber routes. Until utilities accelerate build-outs, these bottlenecks will curb near-term expansion in core metros.
High Up-Front Build Cost Amid Elevated Interest Rates
The U.S. Federal Reserve kept its policy rate around 4.25-4.50% into early 2026, lifting weighted-average cost of capital for listed data-center REITs from 5.8% in 2023 to 7.4% in 2025. A single 50-megawatt hyperscale shell consumes USD 800 million-USD 1.2 billion before revenue starts, so 150-basis-point increases erode net present value materially. Smaller developers lacking investment-grade credit pay construction-loan spreads of 200-300 basis points above benchmarks, limiting their ability to win mega-deals. Many now syndicate equity with pensions and sovereign-wealth funds, as shown by the USD 15 billion Equinix-GIC-CPP venture closed in February 2026. Equity partnerships stabilize headline cost but prolong due-diligence cycles, slowing shovel-ready supply.
*Our forecasts treat driver/restraint impacts as directional, not additive. The impact forecasts reflect baseline growth, mix effects, and variable interactions.
Segment Analysis
By Solution Type: Wholesale Suites Gain Share as AI Labs Lock Long-Term Capacity
Wholesale agreements are expanding at a 12.32% CAGR because hyperscalers and AI research organizations favor multi-megawatt halls that guarantee rack power, security isolation, and purpose-built cooling from day one. CyrusOne revealed in its Q4 2025 call that wholesale deals comprised 72% of bookings with average sizes above 20 megawatts and terms around 12 years, reflecting robust appetite. The model passes construction risk to landlords yet lets tenants specify cage footprints, fiber risers, and cabinet layouts, aligning the physical envelope with proprietary training clusters. Only a handful of landlords can marshal USD 1 billion phases while navigating multi-year grid approvals, granting incumbents a scale edge in the data center colocation market. Retail colocation still held 63.53% of share in 2025 because mid-market enterprises value incremental growth, dense carrier rooms, and monthly billing without capital commitments.
Retail pricing in tier-1 metros averaged USD 150-USD 250 per kilowatt per month in 2025, a premium that bundles cross-connects, 24×7 remote-hands services, and carrier-neutral meet-me rooms. Operators such as Digital Realty mix both models inside one campus, carving wholesale wings for anchor tenants and retail halls for hundreds of smaller clients, boosting land utilization and revenue yield. Hybrid capacity strategies shorten payback cycles by filling power bays earlier in the construction timeline. Over the forecast horizon, wholesale’s faster growth will trim retail share, yet the two formats will coexist because they satisfy different cash-flow and flexibility profiles. Continuous innovation in automated provisioning and as-a-service power metering will further blur boundaries between the two approaches in the data center colocation market.


By Tier Type: Tier 4 Gains as Financial and Healthcare Workloads Demand Fault Tolerance
Tier 4 halls are forecast to climb at a 12.56% CAGR because banks, exchanges, and healthcare networks cannot afford more than 26 minutes of annual downtime and face mounting fines for service disruption. The Uptime Institute Tier Standard specifies 2N+1 redundancy for every power and cooling component plus fault-tolerant distribution paths, which adds 25-35% to capital costs but virtually eliminates single-point failures. QTS Realty Trust already operates 12 Tier 4-certified campuses and markets them to payment processors that quantify outage losses in millions per minute. Declining prices for rotary UPS systems and automated transfer switches are lowering the barrier for Tier 4 adoption among smaller enterprises. As regulators in Europe and North America tighten operational-resilience mandates, Tier 4’s premium becomes easier to justify, reinforcing its share gain trajectory in the data center colocation market.
Tier 3 retained 46.43% of share in 2025 because it balances availability and cost through N+1 redundancy and concurrently maintainable paths, serving SaaS vendors, e-commerce platforms, and streaming networks. Some operators integrate Tier 3 mechanical layouts with Tier 4 operating procedures, offering a middle ground for customers mindful of budgets but unwilling to relax resilience benchmarks. Tier 1 and Tier 2 sites linger mainly in edge or developing-country contexts where workloads tolerate occasional downtime, yet they will keep shrinking as global cloud architectures standardize on higher baselines. Multi-tier campuses allow providers to funnel clients upward as risk tolerance tightens over time. This tiered spectrum supports both premium and value-oriented demand while migrating the installed base toward higher dependability.
By Data Center Size: Hyperscale Facilities Lead Growth as AI Clusters Demand Megawatt-Scale Footprints
Hyperscale campuses are tracking a 12.45% CAGR because single AI training runs can now require 50-100 megawatts and need dual-path 400-800 Gbps fiber backhaul. EdgeCore secured USD 17 billion in December 2025 to build 2.5 gigawatts across North America and Europe in 80 megawatt phases with on-site substations and prefab chilled-water plants, demonstrating investor confidence in mega-campus demand. Such projects demand balance-sheet heft, long-lead transformer orders, and sophisticated grid-interface skills, concentrating share among a handful of global developers. Large multitenant sites between 10 and 50 megawatts still owned 50.21% of share in 2025 because they support hybrid footprints that mix wholesale anchors and high-margin retail suites. EdgeConneX’s modular blueprint begins at 5 megawatt blocks that scale toward 30 megawatts as demand materializes, allowing landlords to stage capital while minimizing stranded power.
Medium-sized 2-10 megawatt halls cater to regional enterprises and government workloads that require in-country hosting but lack hyperscale budgets. Sub-2 megawatt micro-edge nodes serve latency-critical uses such as autonomous drones, augmented-reality overlays, and factory robotics. Operators that blend multiple footprints under one corporate umbrella can funnel customers between tiers as they grow, capturing lifetime wallet share. Demand stratification also smooths revenue cycles because smaller nodes typically fill faster, while mega campuses deliver lumpy but outsized returns once online. Together these size bands create a diversified portfolio effect that stabilizes the broader data center colocation market size.

Geography Analysis
North America retained 40.54% of share in 2025 because Northern Virginia, Silicon Valley, and Dallas anchor the densest interconnection triangles worldwide. Loudoun County alone fields more than 2 gigawatts of live capacity supported by the MAREA and Dunant subsea cables. Canada is emerging as an overflow location thanks to industrial hydroelectric tariffs as low as CAD 0.039 per kWh, equivalent to USD 0.031, and generous provincial tax abatements for carbon-neutral builds. Mexico is rising in Querétaro and Monterrey, where KIO Networks and others backstop near-shore digital manufacturing workloads under the USMCA trade framework. Although property-tax formulas in U.S. data-center counties are tightening, secondary metros with 230-kilovolt spare capacity continue to absorb deferred megawatts, preserving regional momentum.
Asia-Pacific is forecast to post the fastest 12.68% CAGR because sovereign-cloud mandates in China and India, 5G rollouts across Southeast Asia, and Japan’s Digital Agency AI roadmap all spur local hosting. China Telecom and GDS are expanding Beijing, Shanghai, and Shenzhen campuses that must keep government and finance data onshore under the Data Security Law. India’s market jumped 18% in 2025 as Yotta Infrastructure, Adani Enterprises, and ST Telemedia committed more than USD 5 billion to Mumbai and Bangalore halls near submarine cable landings. Singapore reopened permitting in 2026 with a 200 megawatt cap tied to PUE and renewable-energy criteria, reigniting global landlord interest. Australia and New Zealand draw hyperscale tenants that must maintain backup capacity in separate seismic zones under APRA guidelines, sustaining demand around Sydney, Melbourne, and Auckland.
Europe owns a mature yet shifting share because grid bottlenecks in Frankfurt, London, and Dublin redirect capital to Amsterdam, Paris, Madrid, and Milan. The European Union extended its Emissions Trading System in January 2026 to include data-center electricity, nudging operators toward 15-20-year renewable power-purchase agreements and rural wind co-location . Frankfurt congestion has already pushed Digital Realty and CyrusOne to sites along the Rhine-Main high-voltage arc that taps offshore wind. The Middle East races ahead with sovereign-backed megaprojects such as NEOM and the UAE’s Khazna clusters, positioning the region as a digital bridge between Europe, Africa, and Asia. Africa, though nascent, is heating up in South Africa, Egypt, and Nigeria, where Teraco and Africa Data Centres build carrier-neutral halls to serve a mobile-internet boom and bank residency mandates. South America maintains steady expansion as Scala Data Centers and Odata scale São Paulo and Rio de Janeiro capacity to support fintech and open-banking regulation that demands local hosting.

Competitive Landscape
The maket is moderate fragmentation with companies like Equinix, Digital Realty, NTT Communications, CyrusOne, China Telecom and others. Equinix and Digital Realty differentiate through global interconnection fabrics that let enterprises spin up private circuits to hundreds of clouds, SaaS platforms, and carriers in minutes. NTT leverages deep telco fiber across Japan and Southeast Asia, bundling network services with racks under one contract, which appeals to enterprises seeking one-stop solutions. China Telecom dominates sovereign workloads behind the Great Firewall, illustrating how policy alignment can substitute for open competition in domestic markets.
Technology is a second competitive lever. Iron Mountain filed a February 2026 patent for an AI-driven cooling system that predicts thermal spikes 15 minutes in advance and trims chiller energy 18% compared with static settings. Prefabricated steel-frame modules from Aligned Data Centers and Prime Data Centers cut build cycles to 12-18 months versus the 24-36 months typical for concrete shells, an edge when hyperscalers want instant capacity. Infrastructure capital from Brookfield, Blackstone, and DigitalBridge fuels acquisitions of regional specialists, compressing procurement costs and sharpening negotiating power with utilities, which lifts barriers for under-capitalized entrants.
Regional experts still thrive by cornering scarce land near submarine cable landings or by pioneering micro-edge nodes in underserved metros. Teraco’s Johannesburg campus hosts Africa’s most connected meet-me room, drawing every tier-1 carrier on the continent. Vapor IO’s tower-adjacent sites blanket U.S. tier-2 cities and monetize low-latency gaming, sensor fusion, and private-5G slicing. Sustainability credentials weigh heavily in European procurements, so operators that secure traceable renewable certificates and publish detailed water-use reports gain scoring advantages in request-for-proposal cycles. The convergence of financial scale, network reach, and sustainability reporting sets the stage for gradual consolidation, yet regional ingenuity keeps the competitive field dynamic for now.
Data Center Colocation Industry Leaders
Equinix Inc.
Digital Realty Trust Inc.
NTT Global Data Centers
CyrusOne Inc.
ST Telemedia Global Data Centres
- *Disclaimer: Major Players sorted in no particular order

Recent Industry Developments
- February 2026: Equinix closed a USD 15 billion joint venture with GIC and CPP Investments to fund xScale hyperscale campuses in Tokyo, Sydney, and Frankfurt targeting 10- to 15-year wholesale leases.
- January 2026: Digital Realty reported 180 megawatts of new wholesale bookings in Q4 2025, including a European cloud anchor and a U.S. AI research lab.
- January 2026: Singapore’s Energy Market Authority reopened data-center permitting, authorizing 200 megawatts for halls achieving sub-1.3 PUE and 80% renewable sourcing.
- December 2025: EdgeCore Digital Infrastructure secured USD 17 billion from institutional investors to build 2.5 gigawatts of hyperscale capacity across North America and Europe.


Global Data Center Colocation Market Report Scope
Colocation is when organizations place their own servers and other essential computing hardware for data storage in space rented in a physical data center owned and/or operated by a third party. Typically, colocation services include the building in which everything is housed, as well as networking, physical security, redundant power and redundant cooling components, which then support the servers and storage provided by the customer.
The Data Center Colocation Market Report is Segmented by Solution Type (Wholesale Multi-tenant, and Retail Multi-tenant), Tier Type (Tier 1 and 2, Tier 3, and Tier 4), Data Center Size (Small, Medium, Large, and Hyperscale), and Geography (North America, South America, Europe, Asia-Pacific, and Middle East and Africa). The Market Forecasts are Provided in Terms of Value (USD).
By Solution Type
| Wholesale Multi-tenant |
| Retail Multi-tenant |
By Tier Type
| Tier 1 and 2 |
| Tier 3 |
| Tier 4 |
By Data Center Size
| Small Data Center |
| Medium Data Center |
| Large Data Center |
| Hyperscale Data Center |
By Geography
| North America | United States | |
| Canada | ||
| Mexico | ||
| South America | Brazil | |
| Argentina | ||
| Rest of South America | ||
| Europe | Germany | |
| United Kingdom | ||
| France | ||
| Spain | ||
| Rest of Europe | ||
| Asia-Pacific | China | |
| Japan | ||
| India | ||
| South Korea | ||
| Australia and New Zealand | ||
| Rest of Asia-Pacific | ||
| Middle East and Africa | Middle East | Saudi Arabia |
| United Arab Emirates | ||
| Turkey | ||
| Rest of Middle East | ||
| Africa | South Africa | |
| Egypt | ||
| Nigeria | ||
| Rest of Africa | ||
| By Solution Type | Wholesale Multi-tenant | ||
| Retail Multi-tenant | |||
| By Tier Type | Tier 1 and 2 | ||
| Tier 3 | |||
| Tier 4 | |||
| By Data Center Size | Small Data Center | ||
| Medium Data Center | |||
| Large Data Center | |||
| Hyperscale Data Center | |||
| By Geography | North America | United States | |
| Canada | |||
| Mexico | |||
| South America | Brazil | ||
| Argentina | |||
| Rest of South America | |||
| Europe | Germany | ||
| United Kingdom | |||
| France | |||
| Spain | |||
| Rest of Europe | |||
| Asia-Pacific | China | ||
| Japan | |||
| India | |||
| South Korea | |||
| Australia and New Zealand | |||
| Rest of Asia-Pacific | |||
| Middle East and Africa | Middle East | Saudi Arabia | |
| United Arab Emirates | |||
| Turkey | |||
| Rest of Middle East | |||
| Africa | South Africa | ||
| Egypt | |||
| Nigeria | |||
| Rest of Africa | |||


Key Questions Answered in the Report
What is the expected value of the global data center colocation market in 2031?
The market is forecast to reach USD 291.98 billion by 2031, expanding at an 18.41% CAGR from 2026.
Why are hyperscale cloud providers driving wholesale colocation demand?
Hyperscalers lease multi-megawatt blocks that require dedicated power and cooling, favoring wholesale halls for their scale economics and 15-year contract terms.
How are data-sovereignty regulations influencing facility location decisions?
Laws compelling localized storage push enterprises to place workloads inside in-country colocation sites, spurring new builds in Europe, APAC and emerging markets.
What cooling technologies are gaining traction for AI workloads?
Direct-to-chip and immersion liquid cooling are replacing traditional air systems to support rack densities up to 100 kW.
Page last updated on:


