Market Overview
| Study Period | 2020 - 2031 |
|---|---|
| Forecast Data Period | 2026 - 2031 |
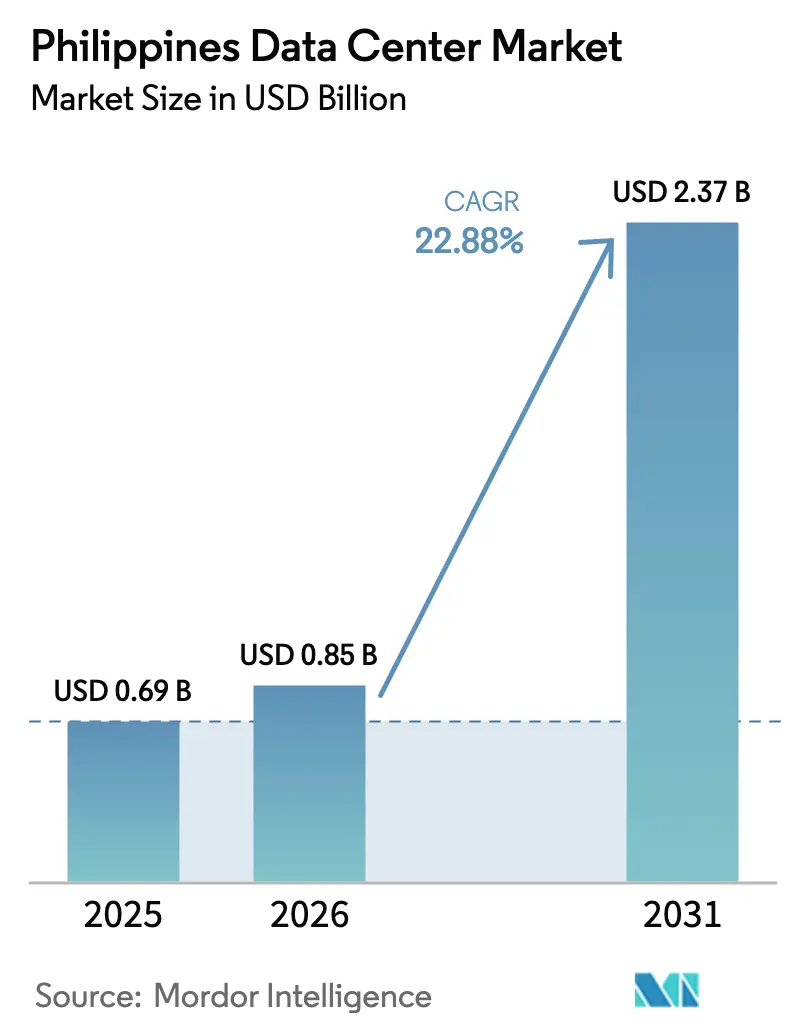
| Base Year Market Size (2025) | USD 0.69 Billion |
| Market Size (2026) | USD 0.85 Billion |
| Market Size (2031) | USD 2.37 Billion |
| Growth Rate (2026 - 2031) | 22.88% CAGR |
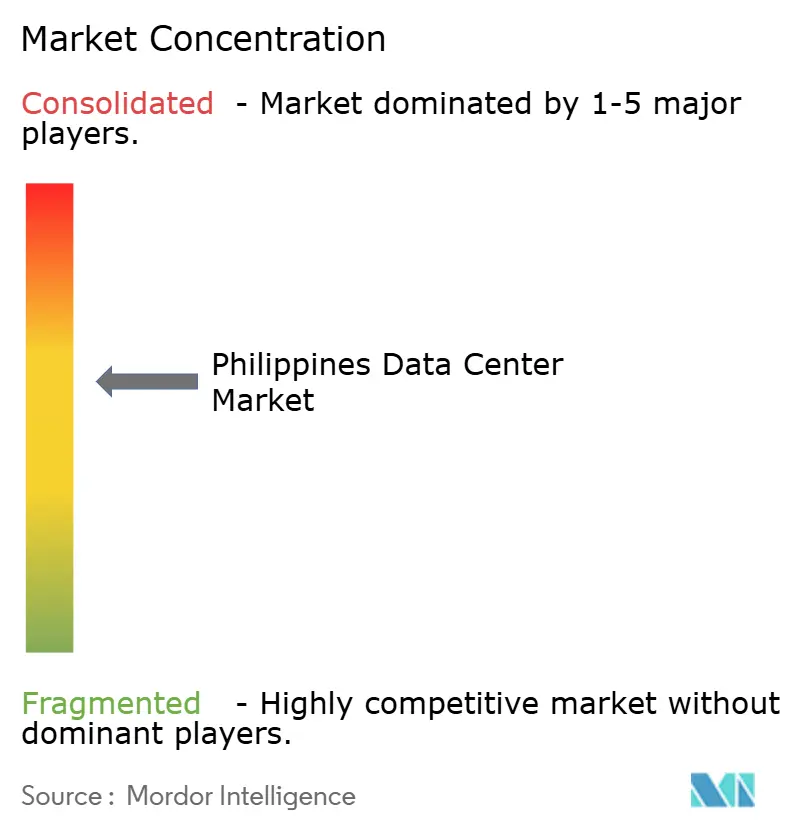
| Market Concentration | Medium |
Major Players *Disclaimer: Major Players sorted in no particular order Image © Mordor Intelligence. Reuse requires attribution under CC BY 4.0. | |
Philippines Data Center Market Analysis by Mordor Intelligence
The Philippines Data Center Market size in 2026 is estimated at USD 0.85 billion, growing from 2025 value of USD 0.69 billion with 2031 projections showing USD 2.37 billion, growing at 22.88% CAGR over 2026-2031. In terms of installed base, the market is expected to grow from 632.80 megawatt in 2025 to 852.80 megawatt by 2030, at a CAGR of 6.15% during the forecast period (2025-2030). The market segment shares and estimates are calculated and reported in terms of MW. Hyperscale deployments, government cloud-first mandates, and a widening submarine-cable footprint are compressing build timelines, while operators race to secure prime land, renewable power, and skilled talent. International bandwidth supplied by new trans-Pacific routes is reducing latency and improving redundancy, attracting global providers toward Manila, Clark, and emerging provincial hubs. Enterprise digital transformation programs in banking, telecom, and e-commerce are steadily expanding the customer base, and sustainability targets are accelerating the adoption of liquid cooling and renewable energy procurement. Competitive intensity is rising as domestic incumbents defend their share against international colocation specialists, who are positioning facilities as carrier-neutral, AI-ready, and energy-efficient.
Key Report Takeaways
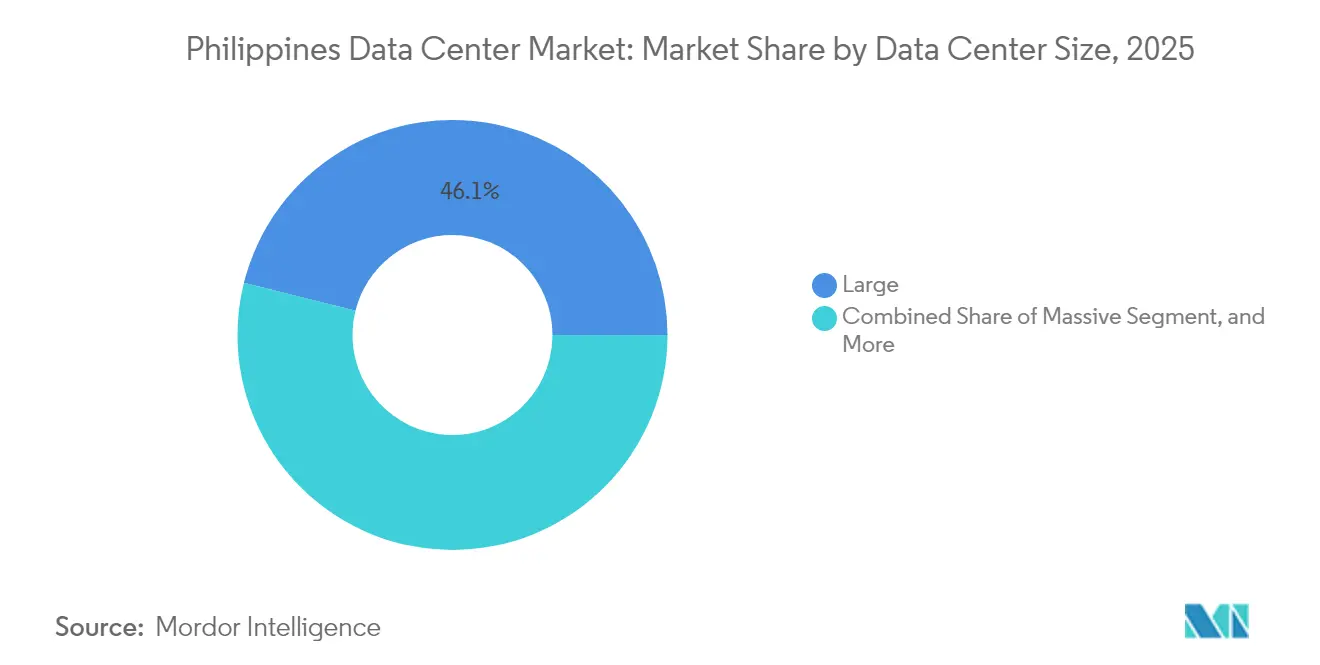
- By data center size, large facilities led the Philippines data center market with a 46.10% share in 2025, while medium facilities recorded the fastest 4.42% CAGR through 2031.
- By tier type, Tier 3 infrastructure accounted for 71.42% of the Philippines' data center market share in 2025; Tier 4 facilities are projected to post the highest 4.96% CAGR from 2026 to 2031.
- By data center type, colocation accounted for 94.85% of the Philippines' data center market size in 2025, whereas hyperscale self-builds are forecast to rise at an 8.29% CAGR between 2026 and 2031.
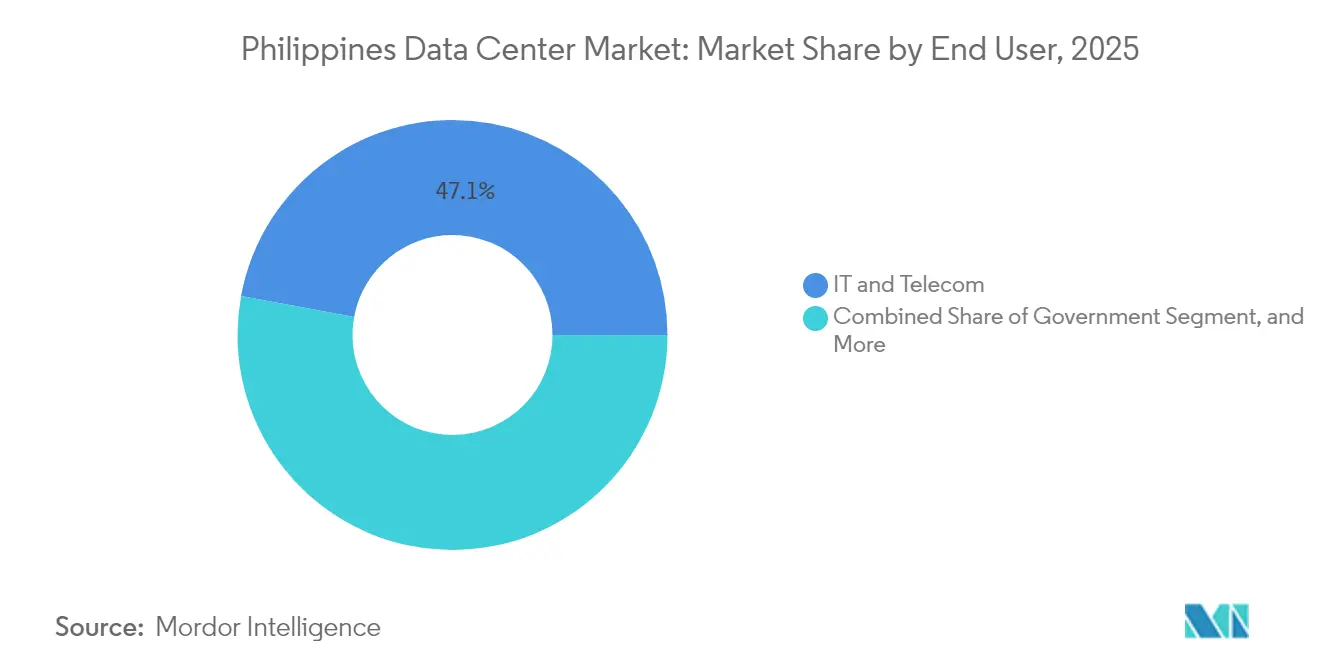
- By end user, IT and telecom captured a 47.10% revenue share in 2025, and BFSI is expected to advance at a 6.17% CAGR through 2031.
- By hotspot, Metro Manila represented 23.70% of the Philippines data center market in 2025, while Bamban in Tarlac is expanding at a 3.38% CAGR to 2031.
Note: Market size and forecast figures in this report are generated using Mordor Intelligence’s proprietary estimation framework, updated with the latest available data and insights as of 2026.
Philippines Data Center Market Trends and Insights
Drivers Impact Analysis*
| Driver | (~) % Impact on CAGR Forecast | Geographic Relevance | Impact Timeline |
|---|---|---|---|
| Accelerating cloud and OTT build-outs | +6.2% | National, early gains in Metro Manila, Laguna, Cavite | Medium term (2-4 years) |
| Surging enterprise demand for low-latency edge nodes | +4.8% | Asia-Pacific core with spill-over to regional cities | Short term (≤2 years) |
| Government incentives for hyperscale investment | +3.9% | Nationwide, concentrated in Clark, Tarlac, Bamban | Long term (≥4 years) |
| Strengthening submarine-cable landing ecosystem | +5.1% | Global connectivity focused on Batangas, Davao, Aurora | Medium term (2-4 years) |
| Rapid fiberization outside Metro Manila | +2.8% | Provincial Philippines excluding NCR | Long term (≥4 years) |
| Green-energy policy boosting PUE optimization | +1.7% | National implementation | Long term (≥4 years) |
| Source: Mordor Intelligence | |||
Accelerating cloud and OTT build-outs
Hyperscale cloud providers are localizing workloads, with Alibaba Cloud planning to build its first Philippine facility by the end of 2025, while United States-based operators are evaluating sites around Metro Manila and Central Luzon. The National Cloud First Policy obliges public agencies to migrate workloads, thereby creating a steady demand for multi-tenant capacity. [1]ComputerWeekly Staff, “Philippines Leaps Forward in E-Government with Cloud-First Strategy,” computerweekly.com E-government platforms such as the eGov PH Super App consolidate services on shared infrastructure, amplifying compute requirements. The Department of Trade and Industry projects that artificial intelligence could contribute 12% to GDP by 2030, catalyzing investment in GPU-ready data centers. Operators are therefore designing campuses with high-density racks, liquid cooling, and dedicated AI zones to future-proof assets.
Surging enterprise demand for low-latency edge nodes
Financial institutions, telecom operators, and digital platforms are shifting transaction processing closer to end users to meet rising user-experience standards. Union Bank reduced loan approval cycles from six weeks to under three minutes after modernizing its data architecture, underscoring the latency advantage of proximate compute. The Bangko Sentral ng Pilipinas reports that 50% of retail payments were digital in 2024, driving demand for instant fraud-detection engines. Globe Telecom supports 46 million GCash users by extending Prisma Cloud security controls across 18 sites and public cloud regions. Such workloads require microsecond latency, prompting operators to develop satellite facilities in secondary cities while maintaining interconnections to core hubs.
Government incentives for hyperscale investment
Republic Act 11659 opened telecom and data-center ownership to full foreign equity, eliminating the previous 40% ceiling and accelerating inbound capital. The Bases Conversion and Development Authority leased 47 hectares in New Clark City for a 300-MW, USD 2.7 billion hyperscale campus, illustrating policy-driven land allocation and tax incentives. The PHP 288 million (USD 5.1 million) Philippine Digital Infrastructure Project aims to enhance broadband reach, indirectly lifting data-center utilization. Collective measures reduce the risk premium for global investors, helping the Philippines compete with Singapore and Indonesia for hyperscale footprints.
Strengthening submarine-cable landing ecosystem
Eight trans-Pacific systems, including Jupiter, Bifrost, and CAP-1, are expected to land in the Philippines by 2025, increasing available international capacity from 60 Tbps to more than 130 Tbps. [2]PLDT Enterprise, “PLDT Builds USD 75M PH Link of Asia Direct Cable,” pldtenterprise.com Converge ICT’s landing station in Davao introduces route diversity and positions Mindanao as a potential global gateway. Lower latency to West Coast United States hubs and stronger redundancy make local facilities more attractive for multinational cloud, streaming, and gaming firms. Consequently, several operators pre-lease data hall capacity in proximity to cable stations in Batangas, Aurora, and Baler to capture early traffic swells.
Restraints Impact Analysis*
| Restraint | (~) % Impact on CAGR Forecast | Geographic Relevance | Impact Timeline |
|---|---|---|---|
| Rising electricity tariffs and grid instability | -4.2% | Nationwide, highest in provincial areas | Short term (≤2 years) |
| Complex right-of-way and permitting procedures | -2.1% | National regulatory framework | Medium term (2-4 years) |
| Skilled-labor shortages in critical facility operations | -1.8% | Metro Manila and large urban centers | Long term (≥4 years) |
| Elevated sovereign-risk premium for USD financing | -1.3% | Investor perception | Medium term (2-4 years) |
| Source: Mordor Intelligence | |||
Rising electricity tariffs and grid instability
The average commercial electricity price stands at USD 0.18 per kWh, the highest in Southeast Asia, eroding operating margins. Spot-market volatility remains acute; Visayas wholesale rates jumped 42% in early 2024, escalating power-cost forecasting challenges. Outages occur on average 28 times annually, and a five-hour interruption costs an estimated PHP 556 million (USD 9.8 million) in lost productivity. [3]Philippine Institute for Development Studies, “Electricity Supply Interruptions in the Philippines,” pids.gov.ph Operators hedge exposure by signing renewable power purchase agreements, installing on-site diesel backup, and designing for flexible power usage effectiveness. Nevertheless, elevated tariffs restrain hyperscale self-builds when compared with Malaysia or Thailand, slowing potential demand.
Complex right-of-way and permitting procedures
Submarine-cable and terrestrial-fiber deployments face permitting timelines that extend to four months, up from 10 days prior to 2022, which delays connectivity projects. Draft data-localization provisions could oblige government and regulated entities to process data domestically, increasing costs and complicating cross-border cloud operations. The Global Data Alliance estimates GDP could dip 1.7% under stringent localization. For developers, fragmented municipal clearances and overlapping agency jurisdictions extend build schedules and raise carrying costs, deterring smaller entrants and compressing project IRRs.
*Our forecasts treat driver/restraint impacts as directional, not additive. The impact forecasts reflect baseline growth, mix effects, and variable interactions.
Segment Analysis
By Data Center Size: Scale Benefits versus Distributed Reach
Large facilities accounted for 46.10% of the Philippines' data center market in 2025, driven by hyperscale customer requirements for contiguous white space and streamlined operations. The VITRO Sta. Rosa campus adds 4,500 racks and 50 MW, bringing the operator’s nationwide capacity to 100 MW, while STT Fairview targets 124 MW upon completion. Medium-sized halls, growing at a 4.42% CAGR, appeal to enterprises that balance latency and cost, especially in provincial economic zones. The Narra Technology Park’s planned three-phase 300-MW megacampus illustrates how developers stagger capital outlays to align with power and demand ramp-ups.
Edge nodes in the 0.5-2 MW band meet locality compliance for fintech, e-commerce, and media workloads, particularly in Cebu and Davao. Mega facilities above 60 MW remain limited but set the benchmark for energy-efficiency standards, often exceeding ASHRAE thermal guidelines and integrating liquid immersion cooling. This bifurcation enables operators to offer a portfolio approach: high-density zones in mega campuses for AI, complemented by smaller footprints in Tier 2 cities for content caching and disaster-recovery workloads.


By Tier Type: Reliability as Competitive Currency
Tier 3 environments dominated 71.42% share in 2025, reflecting enterprise service-level agreements that require concurrently maintainable infrastructure. PLDT’s Clark site received the first TIA-942 Rated-3 certification outside Manila, setting a template for regional developers. The Philippines' data center market size allocated to Tier 4 remains small, but it could accelerate as banks and critical SaaS providers demand fault-tolerant platforms capable of asynchronous maintenance without downtime.
Operators design new builds as Tier 3-plus, engineered to upgrade to Tier 4 through incremental investments in dual power paths and higher redundancy. Tier 1-2 space persists for archival and disaster-recovery workloads where cost efficiency outweighs uptime. Regulatory guidance from the Bangko Sentral ng Pilipinas regarding two-hour breach reporting reinforces customer expectations for redundant power and cooling, pushing Tier 3 as the entry point for new projects.
By Data Center Type: Colocation Retains Dominance amid Hyperscale Self-Builds
Colocation accounted for 94.85% of market value in 2025, underscoring the preferences of enterprises and cloud tenants for asset-light expansion models. Retail racks in carrier-neutral halls lower the barrier to entry for software, media, and fintech firms, while wholesale suites offer hyperscalers flexibility during ramp-up. The Philippines data center market size devoted to hyperscale self-builds, however, is accelerating at an 8.29% CAGR as Alibaba Cloud, Google, and other platforms mature local user bases and seek cost predictability.
Enterprise edge facilities address stringent data-localization clauses in public sector tenders and latency-sensitive gaming and streaming traffic. Beeinfotech PH’s HIVE offers 3,600 racks with multiple meet-me rooms, emphasizing cross-connect density for latency-critical workloads. Sustainability attributes have become key selection criteria; Digital Edge’s NARRA1 won the 2023 Asia-Pacific Innovation Award for achieving a design PUE of below 1.2.
By End User: IT and Telecom Lead, BFSI Scales Rapidly
IT and telecom players held a 47.10% share in 2025, primarily due to their control of fiber backbones and consumption of compute resources for internal platforms. Globe and PLDT pursue vertical integration, monetizing under-utilized racks while reserving capacity for 5G core, OSS/BSS, and value-added services. The Philippines' data center market share allocated to BFSI is expanding at the fastest rate, with a 6.17% CAGR, as digital banks, e-wallets, and regulatory sandboxes increase compute density per customer.
E-commerce, government, manufacturing, and media workloads collectively drive incremental demand. The government's adoption of the eGov PH Super App streamlines workloads into certified domestic halls. Media platforms offload high-bitrate video encoding onto colocation suites in Makati to ensure a seamless user experience during peak campaigns. Manufacturing adopts IoT analytics, requiring real-time edge processing in economic zones from Laguna to Cavite.
By Hotspot: Metro Manila Core and Rising Provincial Hubs
Metro Manila remained the epicenter, with a 23.70% market share in 2025, due to its proximity to multiple cable landing points, financial headquarters, and skilled labor pools. Facilities such as STT Makati and Beeinfotech HIVE reach over 5 MW IT load each, leveraging walk-in enterprise demand. The Philippines data center market size contribution from Bamban is growing at a 3.38% CAGR, propelled by the 47-hectare technohub in New Clark City and DITO Telecommunity’s planned USD 362 million campus.
Angeles City leverages airport adjacency and free-port tax incentives, drawing disaster-recovery deployments from Manila-based clients. Elsewhere, Cebu and Davao attract edge facilities tied to domestic submarine loops, which improve content delivery and payment-processing latency for users in the Visayas and Mindanao regions. Provincial diversification helps relieve power and land constraints in the capital while broadening geographic redundancy for multinational tenants.
Geography Analysis
Metro Manila, Cavite, and Laguna collectively commanded a dominant share of the IT load in 2025, supported by dual-landing international cables and mature fiber grids. The VITRO Sta. Rosa hyperscale campus integrates a 115 kV switching station, illustrating how developers secure dedicated feeders to mitigate grid volatility. Luzon’s domestic backbone enables operators to interlink Clark, Pampanga, and Biñan, Laguna through multiple dark-fiber routes, facilitating active-active data-replication architectures across sub-100 km distances.
Central Luzon’s 3.38% CAGR, the fastest nationally, stems from turnkey incentives inside Clark Special Economic Zone, contiguous land parcels, and the forthcoming Manila-Clark commuter rail. Narra Technology Park’s first 100 MW phase exemplifies large-scale aggregation, an uncommon phenomenon within Metro Manila. Provincial electric cooperatives in Tarlac offer cost-plus power tariffs linked to solar and hydro portfolios, appealing to sustainability-oriented hyperscalers.
Visayas and Mindanao show early-stage momentum as the Philippine Domestic Submarine Cable Network’s 2,500 km ring connects 33 landing points nationwide. Converge ICT’s Davao landing for the Bifrost system lowers latency to Singapore and California, repositioning southern hubs as viable edge nodes. Government Tech4ED centers in 2,500 barangays foster distributed cloud adoption, spawning micro-colocation pods for public-service datasets. Over the forecast horizon, operators plan to establish 20-30 MW campuses in Cebu’s Mactan Ecozone and Davao’s IT Park to capitalize on regional enterprise growth.
Overall, the archipelagic geography necessitates a hybrid architecture: core hyperscale campuses located within 100 km of Manila for density and intercontinental connectivity, supplemented by provincial edge sites that address regulatory, latency, and disaster-recovery considerations. This distributed topology aligns with the national broadband plan’s mandate for redundant domestic routes and promotes inclusive digitalization.
Competitive Landscape
Market concentration is moderate, with top five operators controlling roughly 62% of installed racks, translating to a competitive-intensity score of 6 on a 10-point scale. PLDT’s ePLDT subsidiary leads in colocation capacity, with 11 VITRO sites and 9,000 racks, including the 50 MW Sta. Rosa site positioning the group for AI and GPU workloads. Globe Telecom and Ayala-backed STT GDC Philippines target 124 MW through multistage expansion in Makati, Fairview, and Cavite, leveraging STT’s global design playbook.
International entrants intensify competition. Equinix acquired three TIM carrier-neutral facilities in 2025, importing its IBX interconnection model and enabling direct peering for multinational SaaS companies. Digital Edge’s NARRA1 emphasizes sustainability, boasting a PUE of less than 1.2 and a water usage effectiveness of nearly zero by implementing adiabatic cooling. Beeinfotech PH differentiates via high-density suites and multi-cloud access nodes, marketing rack-ready space to Chinese OTT players awaiting domestic licenses.
Strategic moves revolve around renewable power procurement, AI-ready hall retrofits, and carrier-neutral expandability. Evolution Data Centres has signed an agreement with Citicore Renewable Energy to develop a 100 MW campus powered entirely by solar and hydro energy, reflecting the growing scrutiny of sustainability. STT GDC Philippines opened the country’s first liquid-cooling showroom to capture early demand from model training workloads. PLDT partnered with Meralco’s retail electricity supply arm to secure an initial 35% renewable energy mix for new expansions, aligning with end-customer ESG mandates.
Philippines Data Center Industry Leaders
Bee Information Technology Philippines Inc
ePLDT Inc
NTT Global Data Centers Philippines Inc
ST Telemedia Global Data Centres Philippines
Digital Edge (Singapore) Holdings Pte Ltd
- *Disclaimer: Major Players sorted in no particular order

Recent Industry Developments
- August 2025: Department of Information and Communications Technology signed an MOU with technology firm Kintsugi to develop, construct, and operate a state-of-the-art data center featuring AI integration and advanced cybersecurity solutions.
- June 2025: Equinix completed the acquisition of three carrier-neutral TIM data centers in Makati and Cavite, marking the company’s entry into the Philippines.
- May 2025: First Gen Corporation began negotiations to supply at least 180 MW of clean power to data centers, expanding from the current 17.4 MW.
- April 2025: President Ferdinand Marcos Jr. officiated the launch of the country’s first AI-ready hyperscale data center.


Philippines Data Center Market Report Scope
NCR (Metro Manila) are covered as segments by Hotspot. Large, Massive, Medium, Mega, Small are covered as segments by Data Center Size. Tier 1 and 2, Tier 3, Tier 4 are covered as segments by Tier Type. Non-Utilized, Utilized are covered as segments by Absorption.By Data Center Size
| Large |
| Massive |
| Medium |
| Mega |
| Small |
By Tier Type
| Tier 1 and 2 |
| Tier 3 |
| Tier 4 |
By Data Center Type
| Hyperscale/Self-built | ||
| Enterprise/Edge | ||
| Colocation | Non-Utilized | |
| Utilized | Retail Colocation | |
| Wholesale Colocation | ||
By End User
| BFSI |
| IT and ITES |
| E-Commerce |
| Government |
| Manufacturing |
| Media and Entertainment |
| Telecom |
| Other End Users |
By Hotspot
| Angeles City |
| Metro Manila |
| Bamban |
| Rest of Philippines |
| By Data Center Size | Large | ||
| Massive | |||
| Medium | |||
| Mega | |||
| Small | |||
| By Tier Type | Tier 1 and 2 | ||
| Tier 3 | |||
| Tier 4 | |||
| By Data Center Type | Hyperscale/Self-built | ||
| Enterprise/Edge | |||
| Colocation | Non-Utilized | ||
| Utilized | Retail Colocation | ||
| Wholesale Colocation | |||
| By End User | BFSI | ||
| IT and ITES | |||
| E-Commerce | |||
| Government | |||
| Manufacturing | |||
| Media and Entertainment | |||
| Telecom | |||
| Other End Users | |||
| By Hotspot | Angeles City | ||
| Metro Manila | |||
| Bamban | |||
| Rest of Philippines | |||


Market Definition
- IT LOAD CAPACITY - The IT load capacity or installed capacity, refers to the amount of energy consumed by servers and network equipments placed in a rack installed. It is measured in megawatt (MW).
- ABSORPTION RATE - It denotes the extend to which the data center capacity has been leased out. For instance, a 100 MW DC has leased out 75 MW, then absorption rate would be 75%. It is also referred as utilization rate and leased-out capacity.
- RAISED FLOOR SPACE - It is an elevated space build over the floor. This gap between the original floor and the elevated floor is used to accommodate wiring, cooling, and other data center equipment. This arrangement assist in having proper wiring and cooling infrastructure. It is measured in square feet (ft^2).
- DATA CENTER SIZE - Data Center Size is segmented based on the raised floor space allocated to the data center facilities. Mega DC - # of Racks must be more than 9000 or RFS (raised floor space) must be more than 225001 Sq. ft; Massive DC - # of Racks must be in between 9000 and 3001 or RFS must be in between 225000 Sq. ft and 75001 Sq. ft; Large DC - # of Racks must be in between 3000 and 801 or RFS must be in between 75000 Sq. ft and 20001 Sq. ft; Medium DC # of Racks must be in between 800 and 201 or RFS must be in between 20000 Sq. ft and 5001 Sq. ft; Small DC - # of Racks must be less than 200 or RFS must be less than 5000 Sq. ft.
- TIER TYPE - According to Uptime Institute the data centers are classified into four tiers based on the proficiencies of redundant equipment of the data center infrastructure. In this segment the data center are segmented as Tier 1,Tier 2, Tier 3 and Tier 4.
- COLOCATION TYPE - The segment is segregated into 3 categories namely Retail, Wholesale and Hyperscale Colocation service. The categorization is done based on the amount of IT load leased out to potential customers. Retail colocation service has leased capacity less than 250 kW; Wholesale colocation services has leased capacity between 251 kW and 4 MW and Hyperscale colocation services has leased capacity more than 4 MW.
- END CONSUMERS - The Data Center Market operates on a B2B basis. BFSI, Government, Cloud Operators, Media and Entertainment, E-Commerce, Telecom and Manufacturing are the major end-consumers in the market studied. The scope only includes colocation service operators catering to the increasing digitalization of the end-user industries.
| Keyword | Definition |
|---|---|
| Rack Unit | Generally referred as U or RU, it is the unit of measurement for the server unit housed in the racks in the data center. 1U is equal to 1.75 inches. |
| Rack Density | It defines the amount of power consumed by the equipment and server housed in a rack. It is measured in kilowatt (kW). This factor plays a critical role in data center design and, cooling and power planning. |
| IT Load Capacity | The IT load capacity or installed capacity, refers to the amount of energy consumed by servers and network equipment placed in a rack installed. It is measured in megawatt (MW). |
| Absorption Rate | It denotes how much of the data center capacity has been leased out. For instance, if a 100 MW DC has leased out 75 MW, then the absorption rate would be 75%. It is also referred to as utilization rate and leased-out capacity. |
| Raised Floor Space | It is an elevated space built over the floor. This gap between the original floor and the elevated floor is used to accommodate wiring, cooling, and other data center equipment. This arrangement assists in having proper wiring and cooling infrastructure. It is measured in square feet/meter. |
| Computer Room Air Conditioner (CRAC) | It is a device used to monitor and maintain the temperature, air circulation, and humidity inside the server room in the data center. |
| Aisle | It is the open space between the rows of racks. This open space is critical for maintaining the optimal temperature (20-25 °C) in the server room. There are primarily two aisles inside the server room, a hot aisle and a cold aisle. |
| Cold Aisle | It is the aisle wherein the front of the rack faces the aisle. Here, chilled air is directed into the aisle so that it can enter the front of the racks and maintain the temperature. |
| Hot Aisle | It is the aisle where the back of the racks faces the aisle. Here, the heat dissipated from the equipment’s in the rack is directed to the outlet vent of the CRAC. |
| Critical Load | It includes the servers and other computer equipment whose uptime is critical for data center operation. |
| Power Usage Effectiveness (PUE) | It is a metric which defines the efficiency of a data center. It is calculated by: (𝑇𝑜𝑡𝑎𝑙 𝐷𝑎𝑡𝑎 𝐶𝑒𝑛𝑡𝑒𝑟 𝐸𝑛𝑒𝑟𝑔𝑦 𝐶𝑜𝑛𝑠𝑢𝑚𝑝𝑡𝑖𝑜𝑛)/(𝑇𝑜𝑡𝑎𝑙 𝐼𝑇 𝐸𝑞𝑢𝑖𝑝𝑚𝑒𝑛𝑡 𝐸𝑛𝑒𝑟𝑔𝑦 𝐶𝑜𝑛𝑠𝑢𝑚𝑝𝑡𝑖𝑜𝑛). Further, a data center with a PUE of 1.2-1.5 is considered highly efficient, whereas, a data center with a PUE >2 is considered highly inefficient. |
| Redundancy | It is defined as a system design wherein additional component (UPS, generators, CRAC) is added so that in case of power outage, equipment failure, the IT equipment should not be affected. |
| Uninterruptible Power Supply (UPS) | It is a device that is connected in series with the utility power supply, storing energy in batteries such that the supply from UPS is continuous to IT equipment even during utility power is snapped. The UPS primarily supports the IT equipment only. |
| Generators | Just like UPS, generators are placed in the data center to ensure an uninterrupted power supply, avoiding downtime. Data center facilities have diesel generators and commonly, 48-hour diesel is stored in the facility to prevent disruption. |
| N | It denotes the tools and equipment required for a data center to function at full load. Only "N" indicates that there is no backup to the equipment in the event of any failure. |
| N+1 | Referred to as 'Need plus one', it denotes the additional equipment setup available to avoid downtime in case of failure. A data center is considered N+1 when there is one additional unit for every 4 components. For instance, if a data center has 4 UPS systems, then for to achieve N+1, an additional UPS system would be required. |
| 2N | It refers to fully redundant design wherein two independent power distribution system is deployed. Therefore, in the event of a complete failure of one distribution system, the other system will still supply power to the data center. |
| In-Row Cooling | It is the cooling design system installed between racks in a row where it draws warm air from the hot aisle and supplies cool air to the cold aisle, thereby maintaining the temperature. |
| Tier 1 | Tier classification determines the preparedness of a data center facility to sustain data center operation. A data center is classified as Tier 1 data center when it has a non-redundant (N) power component (UPS, generators), cooling components, and power distribution system (from utility power grids). The Tier 1 data center has an uptime of 99.67% and an annual downtime of <28.8 hours. |
| Tier 2 | A data center is classified as Tier 2 data center when it has a redundant power and cooling components (N+1) and a single non-redundant distribution system. Redundant components include extra generators, UPS, chillers, heat rejection equipment, and fuel tanks. The Tier 2 data center has an uptime of 99.74% and an annual downtime of <22 hours. |
| Tier 3 | A data center having redundant power and cooling components and multiple power distribution systems is referred to as a Tier 3 data center. The facility is resistant to planned (facility maintenance) and unplanned (power outage, cooling failure) disruption. The Tier 3 data center has an uptime of 99.98% and an annual downtime of <1.6 hours. |
| Tier 4 | It is the most tolerant type of data center. A Tier 4 data center has multiple, independent redundant power and cooling components and multiple power distribution paths. All IT equipment are dual powered, making them fault tolerant in case of any disruption, thereby ensuring interrupted operation. The Tier 4 data center has an uptime of 99.74% and an annual downtime of <26.3 minutes. |
| Small Data Center | Data center that has floor space area of ≤ 5,000 Sq. ft or the number of racks that can be installed is ≤ 200 is classified as a small data center. |
| Medium Data Center | Data center which has floor space area between 5,001-20,000 Sq. ft, or the number of racks that can be installed is between 201-800, is classified as a medium data center. |
| Large Data Center | Data center which has floor space area between 20,001-75,000 Sq. ft, or the number of racks that can be installed is between 801-3,000, is classified as a large data center. |
| Massive Data Center | Data center which has floor space area between 75,001-225,000 Sq. ft, or the number of racks that can be installed is between 3001-9,000, is classified as a massive data center. |
| Mega Data Center | Data center that has a floor space area of ≥ 225,001 Sq. ft or the number of racks that can be installed is ≥ 9001 is classified as a mega data center. |
| Retail Colocation | It refers to those customers who have a capacity requirement of 250 kW or less. These services are majorly opted by small and medium enterprises (SMEs). |
| Wholesale Colocation | It refers to those customers who have a capacity requirement between 250 kW to 4 MW. These services are majorly opted by medium to large enterprises. |
| Hyperscale Colocation | It refers to those customers who have a capacity requirement greater than 4 MW. The hyperscale demand primarily originates from large-scale cloud players, IT companies, BFSI, and OTT players (like Netflix, Hulu, and HBO+). |
| Mobile Data Speed | It is the mobile internet speed a user experiences via their smartphones. This speed is primarily dependent on the carrier technology being used in the smartphone. The carrier technologies available in the market are 2G, 3G, 4G, and 5G, where 2G provides the slowest speed while 5G is the fastest. |
| Fiber Connectivity Network | It is a network of optical fiber cables deployed across the country, connecting rural and urban regions with high-speed internet connection. It is measured in kilometer (km). |
| Data Traffic per Smartphone | It is a measure of average data consumption by a smartphone user in a month. It is measured in gigabyte (GB). |
| Broadband Data Speed | It is the internet speed that is supplied over the fixed cable connection. Commonly, copper cable and optic fiber cable are used in both residential and commercial use. Here, optic cable fiber provides faster internet speed than copper cable. |
| Submarine Cable | A submarine cable is a fiber optic cable laid down at two or more landing points. Through this cable, communication and internet connectivity between countries across the globe is established. These cables can transmit 100-200 terabits per second (Tbps) from one point to another. |
| Carbon Footprint | It is the measure of carbon dioxide generated during the regular operation of a data center. Since, coal, and oil & gas are the primary source of power generation, consumption of this power contributes to carbon emissions. Data center operators are incorporating renewable energy sources to curb the carbon footprint emerging in their facilities. |


Research Methodology
Mordor Intelligence follows a four-step methodology in all our reports.
- Step-1: Identify Key Variables: In order to build a robust forecasting methodology, the variables and factors identified in Step-1 are tested against available historical market numbers. Through an iterative process, the variables required for market forecast are set and the model is built on the basis of these variables.
- Step-2: Build a Market Model: Market-size estimations for the forecast years are in nominal terms. Inflation is not a part of the pricing, and the average selling price (ASP) is kept constant throughout the forecast period for each country.
- Step-3: Validate and Finalize: In this important step, all market numbers, variables and analyst calls are validated through an extensive network of primary research experts from the market studied. The respondents are selected across levels and functions to generate a holistic picture of the market studied.
- Step-4: Research Outputs: Syndicated Reports, Custom Consulting Assignments, Databases & Subscription Platforms


