
Data Center Services Market Size and Share
Market Overview
| Study Period | 2020 - 2032 |
|---|---|
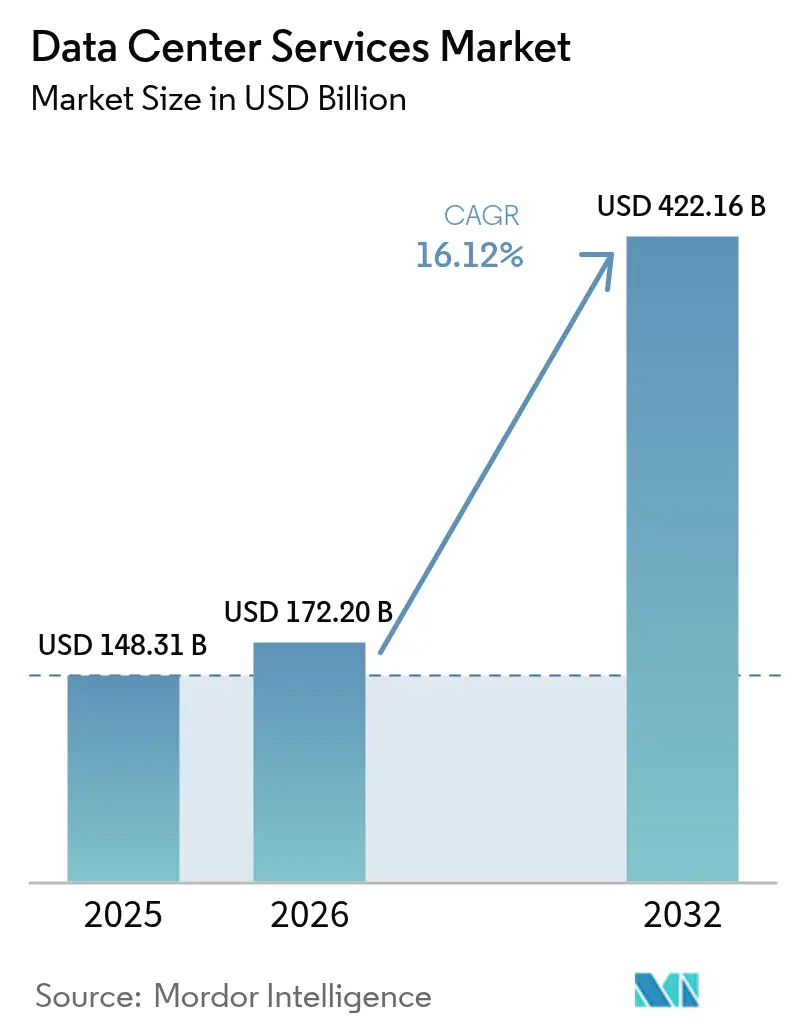
| Market Size (2026) | USD 172.2 Billion |
| Market Size (2032) | USD 422.16 Billion |
| Growth Rate (2026 - 2032) | 16.12 % |
| Fastest Growing Market | Asia Pacific |
| Largest Market | North America |
| Market Concentration | Medium |
Major Players *Disclaimer: Major Players sorted in no particular order Image © Mordor Intelligence. Reuse requires attribution under CC BY 4.0. | |
Data Center Services Market Analysis by Mordor Intelligence
The data center service market size is expected to grow from USD 148.31 billion in 2025 to USD 172.2 billion in 2026 and is forecast to reach USD 422.16 billion by 2032 at 16.12% CAGR over 2026-2032. Enterprises are shifting from capital-heavy ownership toward service consumption models that provide rapid scalability, especially as artificial intelligence workloads require specialized cooling and power densities that outstrip traditional on-premise capabilities. Colocation remains the anchor of the data center service market, yet cloud and virtual data center services are gaining momentum as organizations embrace cloud-native architectures for agility. Competitive intensity is rising as colocation specialists and hyperscale cloud providers converge on hybrid solutions, while supply-chain constraints for high-power components and skilled labor shortages create operational friction. Regulatory localization and water-usage limitations are forcing providers to re-engineer facility designs, driving the uptake of liquid-cooling technologies that enable higher rack densities and improved energy efficiency.
Key Report Takeaways
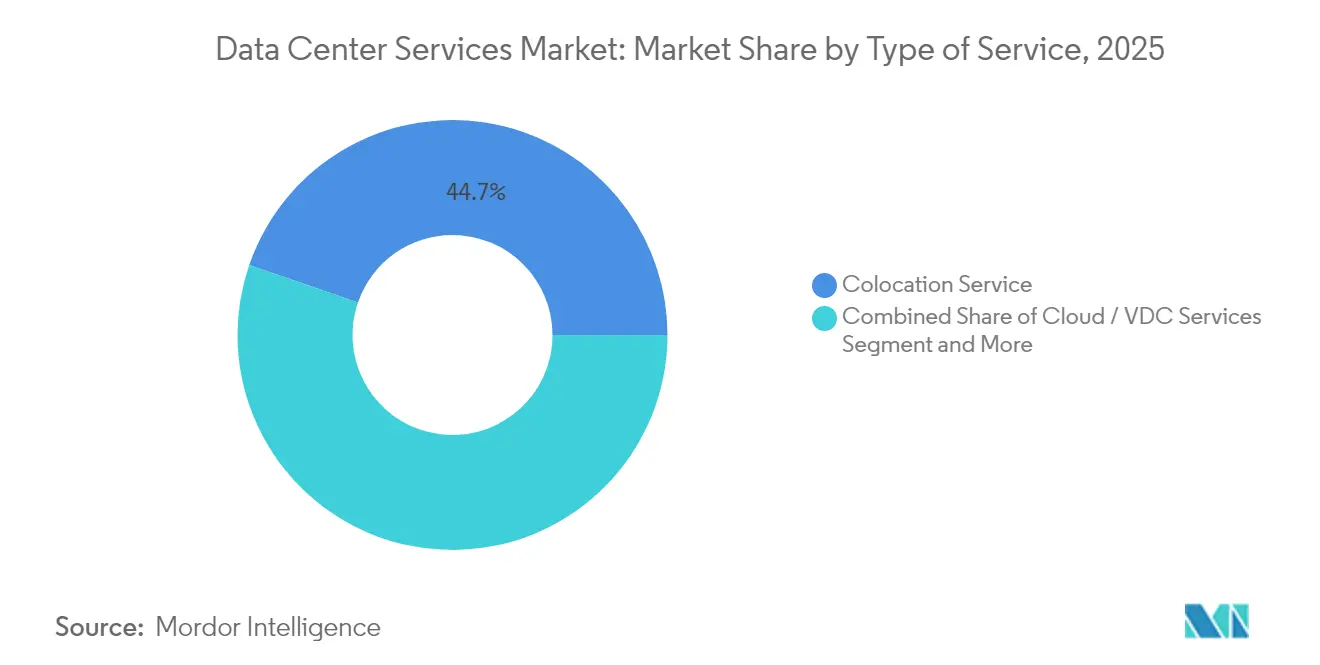
- By type of service, colocation held 44.72% of the data center service market share in 2025, whereas cloud and virtual data center services are advancing at a 16.94% CAGR through 2032.
- By tier standard, Tier III captured 54.73% of the data center service market in 2025, while Tier IV facilities are forecast to grow at a 16.02% CAGR to 2032.
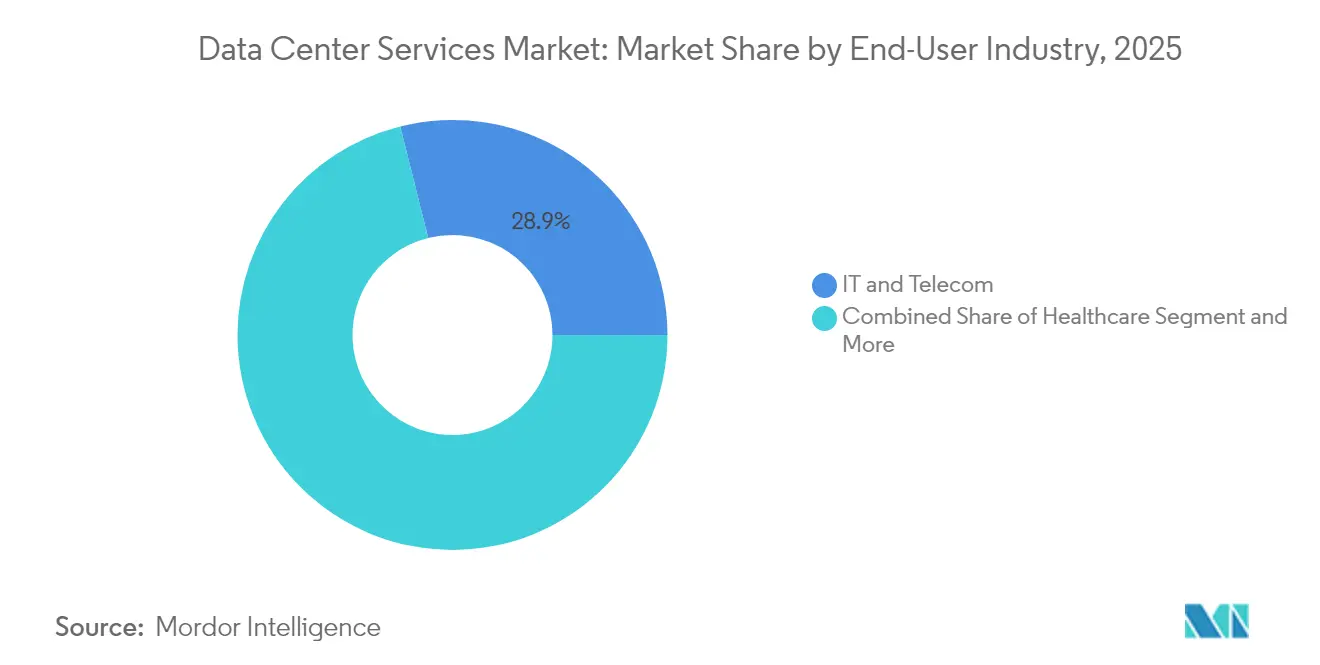
- By end-user industry, IT and Telecom led with 28.91% revenue share in 2025; healthcare is set to expand at a 16.58% CAGR through 2032.
- By deployment model, colocation facilities accounted for 46.62% of the data center service market size in 2025, and hybrid cloud configurations are progressing at a 16.45% CAGR through 2032.
Note: Market size and forecast figures in this report are generated using Mordor Intelligence’s proprietary estimation framework, updated with the latest available data and insights as of 2026.
Market Trends and Insights
Drivers Impact Analysis of Data Center Services Market*
| DRIVER | (~) % IMPACT ON CAGR FORECAST | GEOGRAPHIC RELEVANCE | IMPACT TIMELINE |
|---|---|---|---|
| Increase in expenditure on data center technology | +3.2% | Global, North America, Asia-Pacific | Medium term (2-4 years) |
| Rising data center complexities due to scalability | +2.8% | Global, hyperscale regions | Long term (≥4 years) |
| Surge in cloud and hyperscale expansion | +4.1% | North America, Asia-Pacific, Europe | Short term (≤2 years) |
| Data-sovereignty regulations driving local facilities | +2.3% | Europe, China, India, emerging markets | Medium term (2-4 years) |
| Liquid-cooling adoption enabling higher rack densities | +1.9% | Global | Long term (≥4 years) |
| AI-driven workload orchestration and optimization | +3.5% | North America, Asia-Pacific, Europe | Short term (≤2 years) |
| Source: Mordor Intelligence | |||
Increase in Expenditure on Data Center Technology
Organizations now view infrastructure spending as a competitive differentiator rather than a pure cost center, allocating larger budgets to outsourced models that unlock instant scalability. The trend gained prominence after Microsoft committed USD 30 billion to AI infrastructure in partnership with BlackRock, underscoring how hyperscalers leverage external capital to accelerate deployments.[1]Stephen Nellis, “Microsoft, BlackRock unveil USD 30 billion AI infrastructure pact,” Reuters, reuters.com Higher spending levels accelerate adoption of edge nodes and AI inference engines that would otherwise be constrained by traditional procurement cycles. Service providers benefit because clients prefer managed environments that reduce deployment time while ensuring technology currency. Consequently, the data center service market experiences sustained demand for colocation and managed hosting that integrate cutting-edge GPU clusters with advanced cooling.
Surge in Cloud and Hyperscale Expansion
Cloud providers are building regional zones to satisfy latency expectations and sovereign data rules, creating overflow demand that local service partners can monetize. Oracle’s USD 8 billion investment in Japan exemplifies the push toward sovereign cloud capacity that meets compliance while maintaining global reach.[2]Staff Reporter, “Oracle to invest USD 8 billion in Japan cloud,” Data Center Dynamics, datacenterdynamics.com The expansion diffuses capacity across multiple cities rather than concentrating it in mega-farms, allowing enterprises to architect multi-region resiliency strategies. For service vendors, partnering with hyperscalers opens cross-connect revenue streams and drives the data center service market toward integrated hybrid offerings that bundle cloud on-ramps with local interconnection.
AI-Driven Workload Orchestration and Optimization
Artificial intelligence orchestration platforms dynamically route workloads to optimize thermal, compute, and network resources, cutting power consumption by up to 30% in live deployments.[3]Equinix Inc., “Form 10-K Annual Report 2024,” equinix.com Providers can tier services based on performance requirements rather than fixed allocations, monetizing premium SLAs for latency-sensitive inference while maximizing asset utilization. As more enterprises run mixed AI and legacy workloads, demand grows for intelligent platforms that abstract underlying infrastructure complexity. This capability differentiates operators and propels the data center service market forward by linking operational efficiency with sustainability metrics that resonate with corporate ESG mandates.
Data-Sovereignty Regulations Driving Local Facilities
Stringent privacy statutes such as GDPR in Europe and sector-specific mandates in the Middle East force data to remain within national borders, reshaping site-selection strategies. The UAE’s USD 544 million Microsoft-du project highlights how regulatory triggers spawn localized builds that satisfy compliance while fostering regional digital economies. Providers able to deliver compliant in-country capacity gain first-mover advantage, prompting a wave of joint ventures with telecom operators and sovereign funds. These localized facilities become strategic hubs for multinational enterprises that need low-latency access to domestic users without breaching data-flow restrictions.
Restraints Impact Analysis of Data Center Services Market*
| RESTRAINTS | (~) % IMPACT ON CAGR FORECAST | GEOGRAPHIC RELEVANCE | IMPACT TIMELINE |
|---|---|---|---|
| Data privacy and security concerns | -1.8% | Global, Europe | Short term (≤2 years) |
| Skilled workforce shortage in advanced operations | -2.1% | Global, North America, Europe | Medium term (2-4 years) |
| Water-usage restrictions for cooling | -1.3% | Water-scarce regions | Long term (≥4 years) |
| Supply-chain bottlenecks for high-power components | -1.7% | Global, APAC manufacturing hubs | Short term (≤2 years) |
| Source: Mordor Intelligence | |||
Data Privacy and Security Concerns
High-profile breaches make enterprises cautious about outsourcing sensitive workloads, particularly in finance and healthcare where penalties are severe. Providers must invest in zero-trust architectures and transparent incident-response processes, raising operating costs that can erode margins. Smaller operators struggle to match the security depth of global peers, leading some customers to consolidate with larger brands that offer certified environments. The issue slows migrations yet also pushes the data center service market toward higher-value security services embedded within infrastructure subscriptions.
Skilled Workforce Shortage in Advanced Operations
Managing AI clusters, liquid-cooling loops, and automated orchestration requires specialized engineers who are in short supply. The gap inflates labor costs and delays facility commissioning schedules, curbing capacity rollouts during peak demand cycles. Service providers respond by launching up-skilling academies and partnering with universities, but near-term talent tightness still limits growth trajectories. Consequently, the data center service industry faces execution risks that temper its otherwise strong outlook.
*Our forecasts treat driver/restraint impacts as directional, not additive. The impact forecasts reflect baseline growth, mix effects, and variable interactions.
Data Center Services Market Segment Analysis
By Type of Service:
Colocation Dominance Faces Cloud DisruptionColocation services generated 44.72% of the data center service market size in 2025, reflecting demand for carrier-neutral sites that offer direct cloud on-ramps and rich interconnection. Cloud and virtual data center services, however, are forecast to expand at a 16.94% CAGR, supported by organizations that prefer operational expenditure and elastic scaling. Colocation retains appeal for latency-sensitive workloads and compliance-driven deployments, sustaining steady contracts even as cloud uptake accelerates. Managed hosting stabilizes as mid-market enterprises offload routine infrastructure tasks, while disaster recovery and backup enjoy niche growth amid stricter data-protection mandates.
Data center infrastructure management tools have become essential across all service types, providing real-time insight into power, cooling, and asset utilization. Professional and consulting services deepen client relationships by guiding migration roadmaps and regulatory audits. Service portfolios therefore evolve from single-rack leasing to integrated suites that blend physical footprint, virtual machines, and advisory support. This composite approach anchors customer stickiness and keeps the data center service market positioned for multi-year expansion.



By Tier Standard:
Tier III Balances Cost and ReliabilityTier III facilities accounted for 54.73% of the data center service market share in 2025, striking a pragmatic middle ground between cost efficiency and fault tolerance. They host mainstream corporate workloads that tolerate minimal downtime yet avoid Tier IV premiums. Tier IV sites, targeting financial trading and critical healthcare systems, are expected to post a 16.02% CAGR as zero-interrupt architectures gain favor. Tier I and Tier II facilities lose share except for test labs and archival storage.
Operators are segmenting campuses by tier, enabling clients to align application resilience with budget. Liquid cooling is filtering into Tier III halls to accommodate AI clusters without upgrading the entire site to Tier IV. This modular tiering maximizes utilization and broadens the appeal of mixed-tier campuses, reinforcing market diversity while offering customers granular cost-performance trade-offs.
By End-User Industry:
Healthcare Acceleration Challenges IT DominanceIT and Telecom retained 28.91% of 2025 revenue due to perpetual demand for core networking and SaaS delivery. Healthcare follows with a 16.58% forecast CAGR as telemedicine, genomic analytics, and electronic health records drive compute intensity and strict compliance requirements. BFSI remains a mainstay but is maturing as digital-banking platforms stabilize. Manufacturing leans on predictive maintenance and IoT analytics, while retail and e-commerce turn to burstable cloud capacity for seasonal peaks.
Government digitization initiatives in emerging economies stimulate public-sector requirements for sovereign data centers, whereas media and entertainment rely on high-bandwidth distribution and near-real-time transcoding. Industry-specific regulations and latency sensitivity continue to shape procurement, pushing providers to develop tailored compliance frameworks and service tiers that reinforce the data center service market’s vertical diversification.
By Deployment Model:
Hybrid Strategies Drive GrowthColocation led deployment with 46.62% share in 2025, but hybrid cloud models are surging at a 16.45% CAGR. Enterprises keep sensitive data in colocation racks while executing dev-test or variable workloads in public clouds, blending agility with governance. On-premise data centers persist in defense and highly regulated segments, yet their expansion slows.
Hyperscale self-builds remain the province of global tech giants and streaming services that can justify multi-GW campuses. Multi-model strategies are becoming normal, so providers compete on seamless cross-connects, low-latency routing, and unified billing across environments. This interoperability cements hybrid architectures as the default enterprise path, reinforcing long-term demand across the data center service market.
Geography Analysis
North America Data Center Services Market
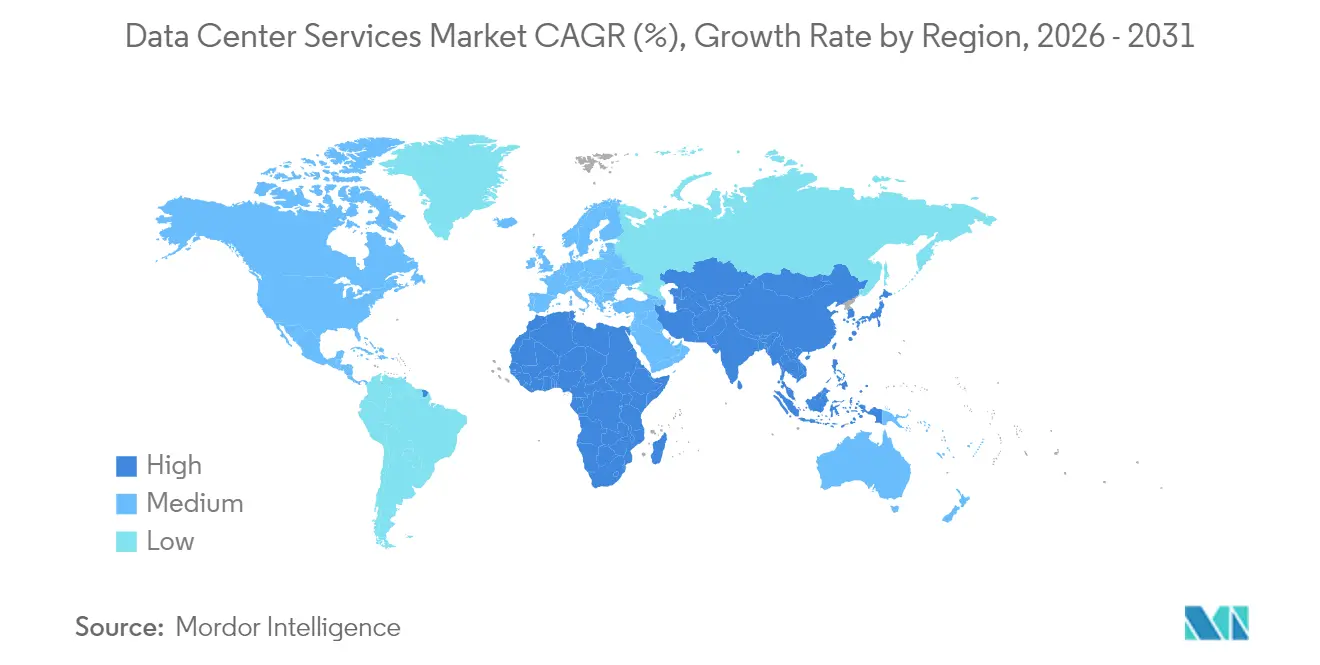
North America retained the largest portion of the data center service market in 2025, buoyed by hyperscale investments like Microsoft and BlackRock’s USD 30 billion AI-infrastructure program. Established connectivity hubs, abundant capital, and mature regulatory frameworks sustain regional leadership. Challenges arise from water-use restrictions in the southwest, spurring adoption of liquid or dry-cooling solutions. Canada offers renewably powered alternatives, attracting AI training clusters that demand continuous megawatt loads.
APAC Data Center Services Market
Asia-Pacific recorded the fastest growth, driven by widespread digitization and sovereign data policies. Oracle’s USD 8 billion sovereign cloud build in Japan and NTT’s USD 1.5 billion expansion in India underscore the region’s momentum. China emphasizes domestic processing for security reasons, favoring local providers. India benefits from government payment systems and biometric identity programs that necessitate compute at scale, while Southeast Asia positions itself as a bridge between global enterprises and local consumers.
EMEA Data Center Services Market
Europe’s trajectory is influenced by GDPR and escalating sustainability mandates. Operators must navigate fragmented national regulations while meeting renewable-energy quotas, creating scope for specialized compliance hosting. Middle East and Africa emerge as new frontiers, with the UAE, Saudi Arabia, and Kenya unveiling large-scale projects like the USD 544 million Microsoft-du facility and geothermal-powered campuses. Strategic positioning between continents enables these markets to serve as inter-regional hubs, further broadening the geographical footprint of the data center service market.

Regulatory Landscape
Regulation for data center services is tightening around data sovereignty, efficiency disclosure, and cross-border data controls, influencing where and how capacity is delivered. In the European Union, the Data Act (Regulation (EU) 2023/2854) became applicable in September 2025, reinforcing governance around data access and portability that affects cloud, virtual data center, and managed hosting contracts for enterprise customers operating across multiple jurisdictions.
Sustainability reporting and comparable performance metrics are moving toward more standardized schemes. The EU Commission Delegated Regulation (EU) 2024/1364 entered into force in June 2024, implementing a common Union rating scheme for data centers, which requires operators to document energy and resource performance in a consistent format. In the United States, June 2026 saw the introduction of H.R. 9372 (Data Infrastructure Energy Measurement and Standards Act), which would task NIST with developing measurement best practices for data center energy and water use, while broader federal and state activity increases permitting scrutiny and ties large-load approvals to verified efficiency and grid integration planning.
Value Chain Analysis
The data center services value chain starts with site and power procurement (land, utility interconnects, on-site generation where used), then moves into design and construction (EPCs, commissioning). From there, critical physical infrastructure sourcing (switchgear, transformers, UPS, generators, cooling, racks) supports the layering of IT platforms (servers, storage, networking) and the service stack (colocation, managed hosting, cloud/VDC, DR/backup, DCIM, and professional services). For operators and managed service providers, translating power availability into contracted capacity has become a core differentiator, particularly for AI workloads that require high-density cooling and resilient electrical architectures.
Most constraints sit upstream in grid access and heavy electrical equipment. Lead times for high-voltage transformers and switchgear extend to roughly 80 to 100 weeks, with some large units reported beyond 160 weeks, delaying fit-out and commissioning even when buildings are ready. Interconnection queues of 3 to 4 years in major hubs such as Northern Virginia, Frankfurt, and London push providers toward power-ready sites, retrofits, and secondary metros, while service portfolios increasingly bundle design advisory, capacity reservation, and operational optimization (including liquid cooling and DCIM) to reduce time-to-service for enterprise and hyperscale customers.
Competitive Landscape
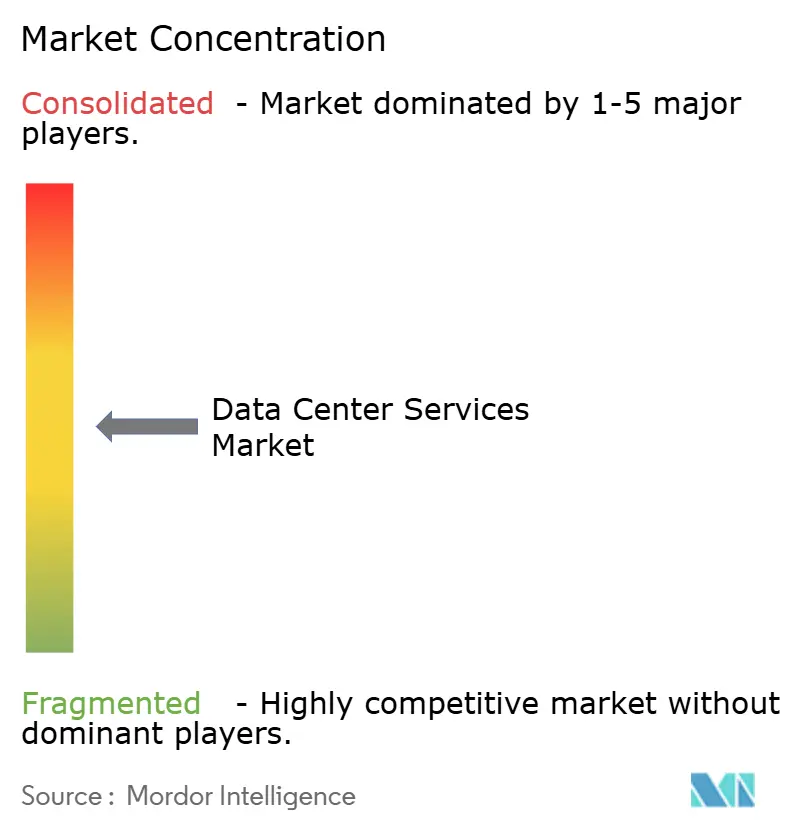
The sector shows moderate consolidation as scale advantages in power procurement, network reach, and engineering talent favor global incumbents. Equinix’s USD 15 billion multiyear expansion plan illustrates the sustained capital outlay required to defend market position. Cloud providers, seeking to localize capacity, increasingly partner or co-develop with colocation specialists, blurring competitive boundaries.
Private-equity interest accelerates roll-ups of regional players, creating larger platforms capable of funding liquid-cooling retrofits and renewable-energy PPAs. Niche disruptors carve out segments such as edge micro-data centers, high-density immersion pods, or industry-specific compliance zones. Technology adoption around AI-driven operations and advanced thermal management has become the critical differentiator, driving cost per kilowatt down and service tiers up.
Midsize operators without specialized focus face margin pressure and are potential acquisition targets. Meanwhile, clients favor providers that can offer a single contract covering multiple continents and service layers, encouraging cross-border M&A. As a result, the data center service market continues moving toward fewer but larger diversified platforms with the capacity to execute multi-GW pipelines.
Data Center Services Industry Leaders
Equinix Inc.
Digital Realty Trust Inc.
Amazon Web Services (AWS)
Microsoft Corporation (Azure)
Google LLC (Google Cloud)
- *Disclaimer: Major Players sorted in no particular order
Data Center Services Market Companies Covered in this Report
- Equinix Inc.
- Digital Realty Trust Inc.
- Amazon Web Services (AWS)
- Microsoft Corporation (Azure)
- Google LLC (Google Cloud)
- Alibaba Cloud
- Tencent Cloud
- IBM Corporation
- Fujitsu Limited
- NTT Communications
- Hewlett Packard Enterprise Company
- Dell Inc.
- Cisco Systems Inc.
- Vertiv Co.
- Singapore Telecommunications Limited (Singtel)
- Iron Mountain Inc.
- Cyxtera Technologies
- CoreSite Realty Corporation
- Capgemini SE
- Kyndryl Holdings Inc.
- Rackspace Technology
- OVHcloud
- ATandT Inc.
- Switch Inc.
- EdgeConneX

Market Opportunities and Future Outlook
Near-term whitespace is concentrated where operators can convert scarce power and high-density thermal capability into differentiated service tiers for AI training and inference, particularly within colocation and hybrid architectures. The scale shift is visible in major phased campus announcements: in July 2026, Meta disclosed a major expansion of its Hyperion data center campus in Richland Parish, Louisiana, targeting multi-gigawatt compute capacity, which supports demand for adjacent ecosystem services such as interconnection, managed operations, and specialized cooling support.
Opportunities also arise from sovereignty and locality requirements that favor in-country platforms and network-layer controls across hybrid multicloud environments. In Europe, Pure Data Centres Group announced a planned AI campus in Seinajoki, Finland (July 2026), with Phase 1 (110MW) reported as fully leased, reflecting demand for capacity that pairs large power blocks with AI-ready design. For service providers, these conditions reward investment in power procurement partnerships, modular build strategies, direct liquid cooling, and compliance-oriented offerings that simplify multi-region deployments while aligning with evolving efficiency rating schemes and data governance obligations.
Recent Industry Developments in Data Center Services Market
- July 2026: Amazon confirmed a major data center build-out in Mississippi totaling USD 25 billion, spanning multiple counties. The scale of the commitment points to sustained hyperscale demand that can draw in colocation, network, and managed services ecosystems around new campuses.
- April 2025: Microsoft and du agreed to build a USD 544 million hyperscale facility in the UAE to support regional cloud and AI services. The project reinforces the role of telecom partners in delivering in-country capacity aligned with data localization and latency requirements.
- May 2024: The European Union’s Commission Delegated Regulation (EU) 2024/1364 entered into force, implementing a common Union rating scheme for data centers. Standardized rating and disclosure frameworks increase the importance of measurable efficiency performance across colocation and managed hosting offerings.


Data Center Services Market Report Scope and Research Methodology
Market Definition and Coverage
For this study, the market covers paid services that help organizations run, host, and manage workloads inside third-party or owned data center environments. This includes colocation and managed hosting type support tied to compute, network, and storage delivery.
Scope exclusions: We exclude pure sale of data center hardware and one-time construction work that is not billed as an ongoing or project-based service.
Segments Covered in This Report
- By Type of Service
- Managed Hosting Service
- Colocation Service
- Cloud / Virtual Data Center Services
- Disaster Recovery and Backup Services
- Data Center Infrastructure Management (DCIM) Services
- Professional and Consulting Services
- By Tier Standard
- Tier I and II
- Tier III
- Tier IV
- By End-User Industry
- BFSI
- Healthcare
- Retail and E-commerce
- Manufacturing
- IT and Telecom
- Government and Public Sector
- Media and Entertainment
- Others
- By Deployment Model
- On-Premise Facilities
- Colocation Facilities
- Hyperscale/Self-built Facilities
- By Geography
- North America
- United States
- Canada
- Mexico
- South America
- Brazil
- Argentina
- Rest of South America
- Europe
- United Kingdom
- Germany
- France
- Italy
- Spain
- Russia
- Rest of Europe
- Asia-Pacific
- China
- Japan
- India
- South Korea
- Australia and New Zealand
- Rest of Asia-Pacific
- Middle East and Africa
- Middle East
- Saudi Arabia
- United Arab Emirates
- Turkey
- Rest of Middle East
- Africa
- South Africa
- Nigeria
- Kenya
- Rest of Africa
- Middle East
- North America
Data Sources, Market Sizing, and Validation
Desk Research
Desk research was used to anchor the demand backdrop and keep assumptions tied to observable indicators. We referenced public sources such as the US Energy Information Administration (electricity prices and usage patterns), the International Telecommunication Union (network traffic context), national telecom regulators where relevant, US Census and Eurostat business statistics, and trade association publications that track data center and colocation trends.
On the supply side, we reviewed company annual reports, investor presentations, and product pages to understand service bundles, contract types, and typical pricing logic. Where available, paid company financials and intelligence subscriptions helped standardize revenue disclosures and identify which lines map to data center services versus adjacent cloud or connectivity items. This desk list is illustrative only, and we checked many other sources for collection, cross-checking, and clarification.
Primary Interviews and Surveys
Primary work focused on validating how services are packaged and billed across colocation and managed hosting, and pressure-testing the input assumptions used in the model. We spoke with a mix of service providers, channel partners, and enterprise buyers across major regions, so gaps from public data could be filled. We then confirmed key levers like utilization and price movement with respondent input.
The interviews were most useful for verifying practical ranges for occupancy, contract duration, tier mix, and the split between recurring and project-led service revenues. Those ranges were then used to triangulate the desk findings.
Distribution of primary research fieldwork respondents
| Company type | Respondent position | Region |
|---|---|---|
| Top tier: 39% | CXOs: 12% | APAC: 49% |
| Mid tier: 46% | Functional/Unit leaders: 31% | EMEA: 33% |
| Smaller Players: 15% | Managers: 57% | Americas: 18% |
Market-Sizing & Forecasting
Sizing starts from a top-down demand pool build that reconstructs service spending by linking data center capacity signals to service attach rates and average contract economics, then rolling results up by region and customer group. These totals were corroborated with selective bottom-up checks, including sampled provider revenue mapping to service lines, a price-per-kW and price-per-rack cross-check for colocation, and a volume times ASP check for managed hosting bundles. Where the two views did not align, totals were adjusted.
Model inputs include installed and planned data center capacity (MW) and rack density, tier mix (Tier I-II versus Tier III and Tier IV), occupancy and utilization ranges, average contract length and renewal behavior, and price movement by service type (colocation versus managed hosting) in major metros. Where data is thin in smaller countries, we benchmark to similar markets using capacity additions, power cost bands, and enterprise digitization indicators, then apply a sanity check using interview feedback.
For forecasting, we apply scenario analysis since build-outs, energy costs, and customer migration to hybrid architectures can change the year-to-year path. Variable-level outlooks gathered in primary discussions were used to set conservative and expansion cases. A central path was selected when indicators and expert views converged.
Data Validation & Update Cycle
Validation is done through several passes so the final number is not driven by one dataset or one assumption. We compare outputs against independent signals such as capacity additions, occupancy commentary, and service revenue direction from public filings. When a large variance appears, we trace it back to the driver level, including utilization, tier mix, or pricing.
Before sign-off, the model is reviewed by another analyst. We also re-contact respondents when an assumption looks out of range for a specific region or service type. Reports are refreshed annually, with interim updates when material events occur, such as major capacity announcements or abrupt price changes in power and space. Right before delivery, we run a final review so clients receive the most current view available.
Mordor Intelligence's Service Market for Data Center Market Size Compared With Other Published Estimates
Published market sizes for data center services can differ because firms do not always count the same service lines, geographies, and billing types, and they also use different base years. Differences in how recurring colocation revenue is treated versus project-led consulting, along with assumptions about how quickly pricing rises, can shift the final total in a visible way.
The table shows a spread even for nearby years. In Mordor Intelligence's model, the market includes a wider bundle of data center service revenues beyond only colocation and managed hosting, and tier mix and utilization are used as explicit checks before totals are rolled up.
Benchmark comparison
| Source | Market Size | Gaps in Research Methodology |
|---|---|---|
| Mordor Intelligence | USD 172.2 B (2026) | |
| Industry Publisher A | USD 195.35 B (2026) | This figure appears to assume a broader service basket with faster price expansion and may roll more ancillary service categories into the same total, which can lift the 2026 value even if capacity assumptions are similar. |
| Industry Publisher B | USD 26.51 B (2025) | This estimate is likely scoped to a narrower subset of services (for example, focusing on select offerings like interconnection, colocation, and managed hosting only), which materially reduces the counted revenue pool versus wider definitions. |
Taken together, the comparison suggests that scope boundaries and the way pricing and attach rates are applied explain most of the gap, rather than a disagreement on the direction of demand. By keeping the model traceable to capacity, utilization, tier mix, and service pricing, the final total stays repeatable and easier to audit across regions and years.


Key Questions Answered in the Report
What is the current valuation of the data center service market?
The data center service market size stood at USD 172.2 billion in 2026.
How fast is the market expected to grow over the next six years?
The sector is projected to expand at a 16.12% CAGR, reaching USD 422.16 billion by 2032.
Which service type shows the highest growth potential?
Cloud and virtual data center services are set to grow at a 16.94% CAGR through 2032.
Why are Tier IV facilities gaining traction?
Mission-critical workloads in finance and healthcare demand zero-downtime architectures, driving a 16.02% CAGR for Tier IV sites.
Which region will register the fastest growth?
Asia-Pacific is forecast to record the highest regional CAGR due to sovereign cloud mandates and rapid digitization initiatives.
How are providers addressing sustainability concerns?
Operators are deploying liquid or geothermal cooling, sourcing renewable power, and implementing AI-based workload orchestration to cut energy use by up to 30%.
Page last updated on:
- Data Center Server Market Servers across all regions, split by tier, facility size and facility type.
- Data Center Construction Market Construction worldwide, split by tier, facility size and facility type.
- Artificial Intelligence (AI) Data Center Market AI facilities across all regions, split by facility type, component and tier.
- North America Data Center Server Market North America's servers, split by data-center tier, form factor and application / workload.
- Data Center Automation Market Global automation demand, split by solution, data center tier type and deployment mode.
- Germany Data Center Storage Market Storage in Germany, split by storage technology, storage type and facility type.
- China Data Center Processor Market Processors in China, split by facility size and tier.
- Data Center Managed Services Market Managed services across all regions, split by service type, deployment model and facility type.
- Data Center Switch Market Switches across all regions, split by switch type, bandwidth class and switching technology.
- France Data Center Construction Market Construction in France, split by tier, facility type and infrastructure.
- Italy Data Center Server Market Italy's servers, split by facility size and tier.
- Italy Hyperscale Data Center Market Italy's hyperscale sites, split by facility type, component and tier.
- Italy Data Center Construction Market Italy's construction, split by tier, facility type and infrastructure.




