Data Center Server Market Size and Share
Market Overview
| Study Period | 2020 - 2031 |
|---|---|
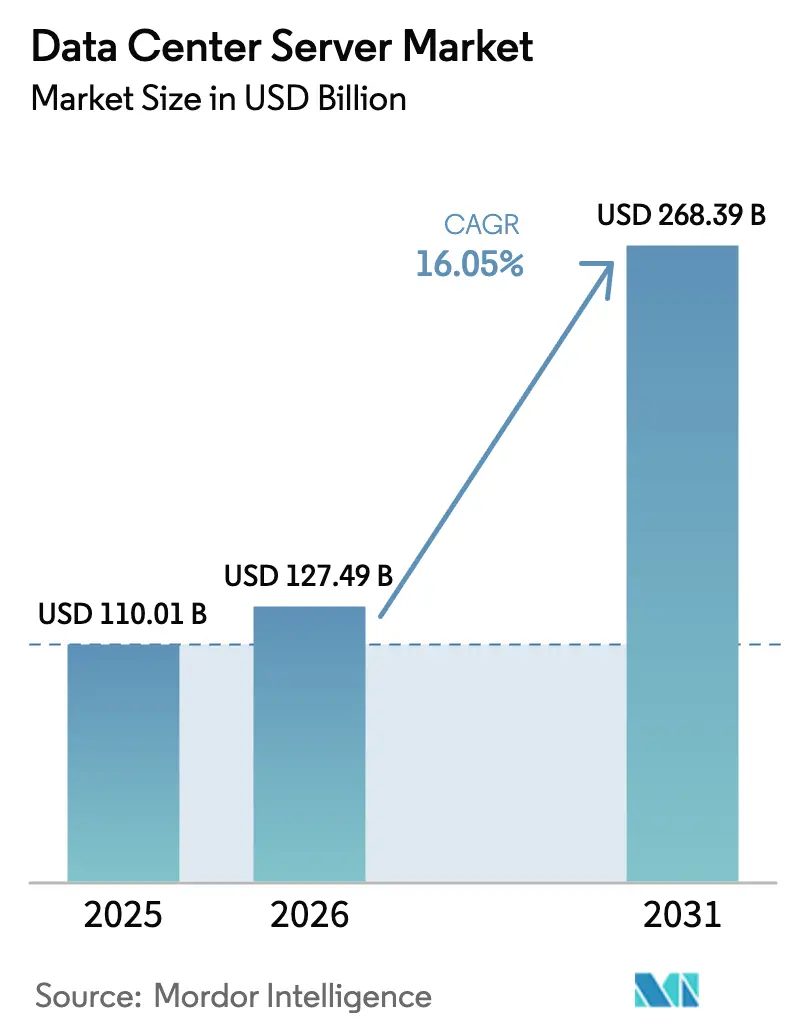
| Market Size (2026) | USD 127.49 Billion |
| Market Size (2031) | USD 268.39 Billion |
| Growth Rate (2026 - 2031) | 16.05% CAGR |
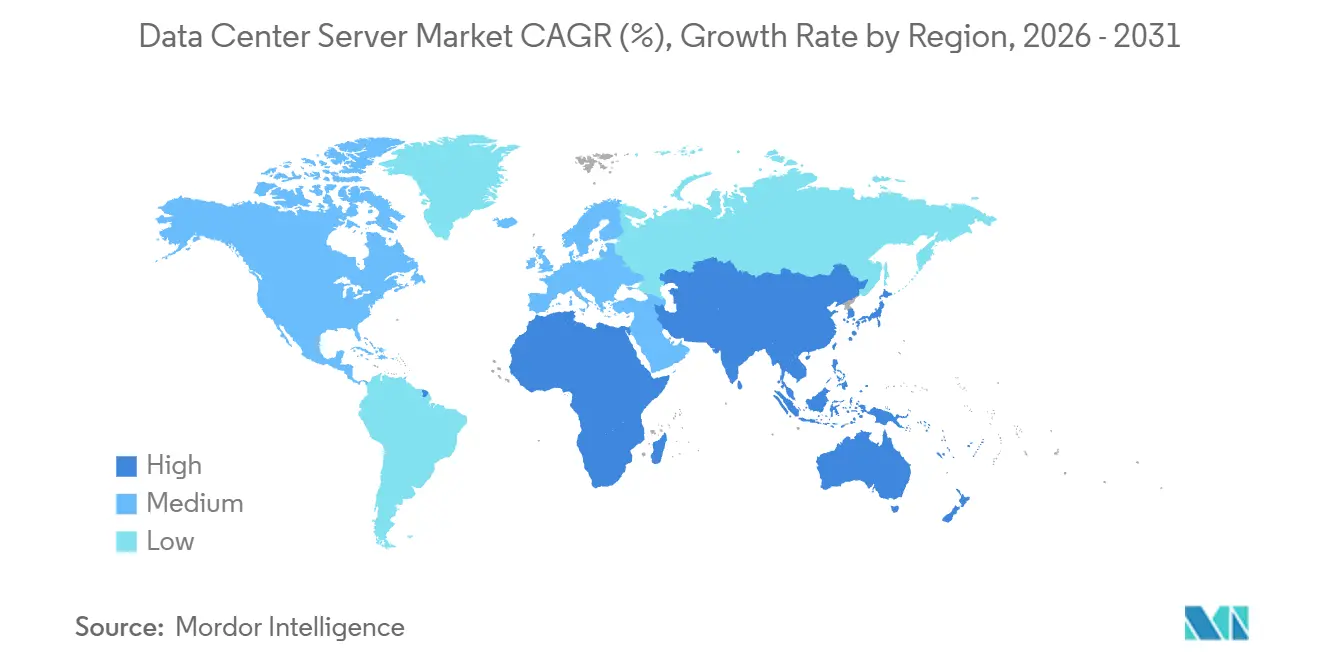
| Fastest Growing Market | Asia Pacific |
| Largest Market | North America |
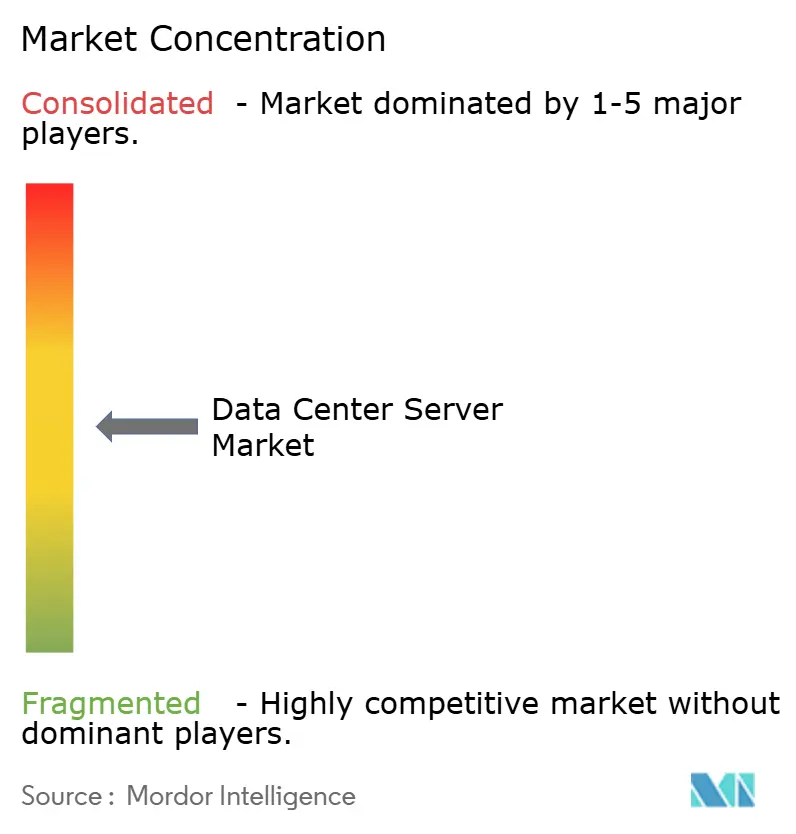
| Market Concentration | Medium |
Major Players *Disclaimer: Major Players sorted in no particular order Image © Mordor Intelligence. Reuse requires attribution under CC BY 4.0. | |
Data Center Server Market Analysis by Mordor Intelligence
The Data Center Server Market size is expected to increase from USD 110.01 billion in 2025 to USD 127.49 billion in 2026 and reach USD 268.39 billion by 2031, growing at a CAGR of 16.05% over 2026-2031.
Escalating artificial-intelligence training runs, rapid edge buildouts, and the adoption of liquid cooling are shortening refresh cycles and underpinning robust demand. Sovereign-AI mandates in Europe and the Middle East are encouraging on-premises clusters, fragmenting the data center server market away from public-cloud concentration. Hyperscale operators are standardizing on GPU-dense racks that exceed 80 kilowatts, forcing OEMs to redesign chassis around direct-to-chip liquid cooling. Supply constraints for high-bandwidth memory are prompting hyperscalers to lock in multiyear component contracts, which, in turn, stabilize medium-term shipment visibility.
Key Report Takeaways
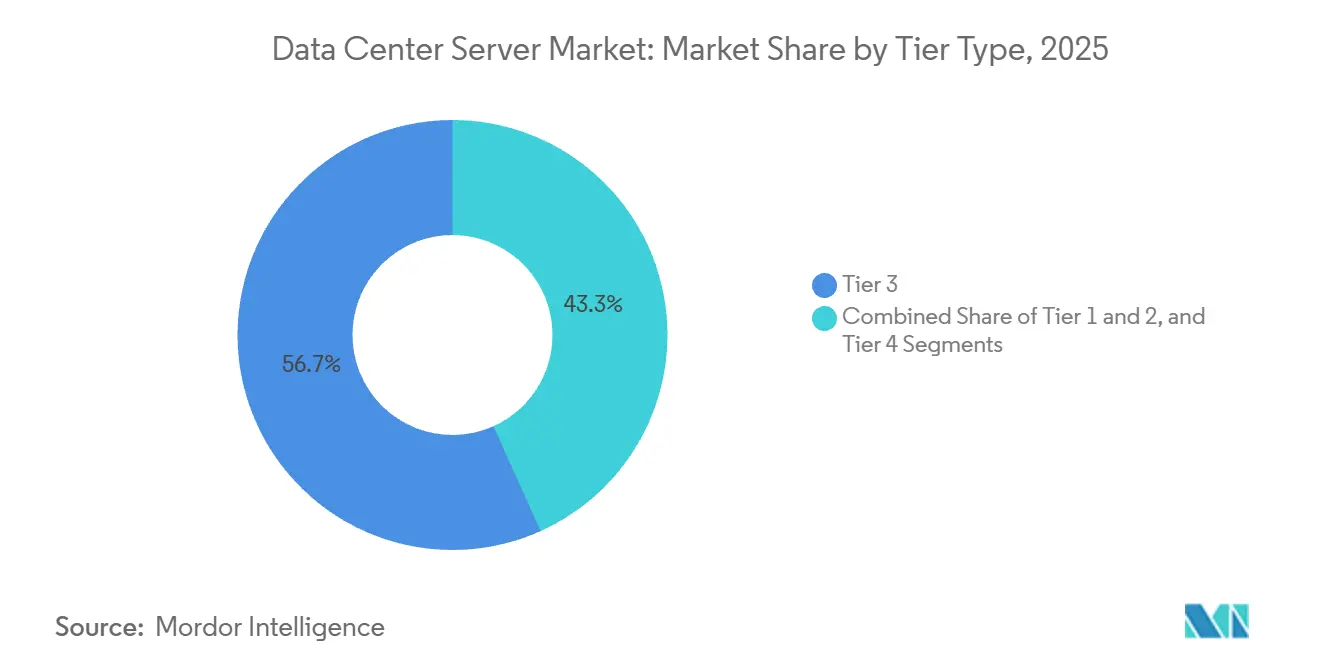
- By tier type, tier 3 facilities held 56.72% of the share in 2025, while tier 4 facilities are projected to grow at a 17.54% CAGR through 2031.
- By data center size, hyperscale campuses accounted for 58.94% of the share in 2025 and are advancing at a 17.48% CAGR over 2026-2031.
- By data-center type, colocation providers accounted for 54.87% of the share in 2025, whereas hyperscalers and cloud-service operators are expanding at a 17.74% CAGR to 2031.
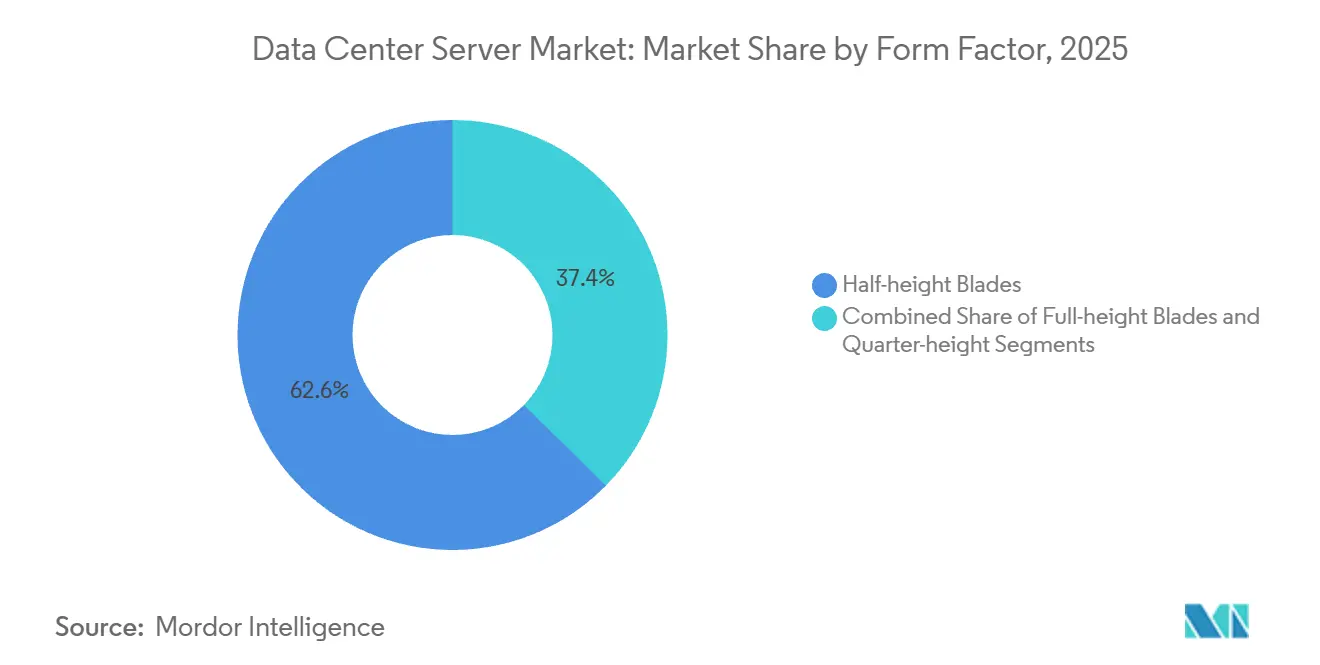
- By form factor, half-height blade servers delivered 62.65% of the share in 2025, while quarter-height and micro-blade designs are rising at a 17.86% CAGR through 2031.
- By application, artificial-intelligence and machine-learning workloads accounted for 37.76% of the share in 2025, whereas virtualization and private-cloud platforms are growing at a 17.39% CAGR through 2031.
- By geography, North America contributed 39.83% of share in 2025, while Asia-Pacific is set to post the fastest growth with a 18.01% CAGR through 2031.
Note: Market size and forecast figures in this report are generated using Mordor Intelligence’s proprietary estimation framework, updated with the latest available data and insights as of January 2026.
Global Data Center Server Market Trends and Insights
Drivers Impact Analysis*
| Driver | (~) % Impact on CAGR Forecast | Geographic Relevance | Impact Timeline |
|---|---|---|---|
| Proliferation of AI and ML Workloads Demanding GPU-Dense Servers | +2.1% | Global with North America and Asia-Pacific focus | Short term (≤ 2 years) |
| Hyperscale and Edge Data-Center Build-Out Momentum | +1.8% | North America, Europe, Asia-Pacific core markets | Medium term (2-4 years) |
| Liquid-Cooling-Ready Server Designs Enabling More than 80 Kw Racks | +1.3% | North America and Europe expanding to Asia-Pacific | Medium term (2-4 years) |
| Adoption of Cloud-Computing Services | +1.0% | Global | Long term (≥ 4 years) |
| Large-Scale Commercialization of 5G Networks | +0.7% | Asia-Pacific, Middle East, selective North America metros | Medium term (2-4 years) |
| Shift Toward ARM and RISC-V Architectures to Cut Total Cost of Ownership | +0.6% | Global with early hyperscale uptake | Long term (≥ 4 years) |
| Source: Mordor Intelligence | |||
Proliferation of AI and ML Workloads Demanding GPU-Dense Servers
Training runs for large language models already involve clusters that exceed 10,000 NVIDIA H100 or AMD MI300X accelerators, elevating rack power to levels that conventional air-cooling cannot support.[1]Jensen Huang, “NVIDIA Financial Reports,” NVIDIA Investor Relations, investor.nvidia.com Meta plans to deploy 350,000 H100-equivalent GPUs by end-2026, translating into roughly 175 megawatts of incremental load in less than two years.[2]Nick Clegg, “Meta Platforms Financial Reports,” Meta Investor Relations, investor.fb.com Microsoft provisioned dedicated GPU clusters across multiple Azure regions to maintain sub-second inference latency for GPT-4 users, highlighting how latency targets now drive server location as strongly as cost.[3]Microsoft Azure Team, “Azure AI Infrastructure Updates,” azure.microsoft.com Older CPU-centric racks lack the memory bandwidth and NVLink fabric needed for multimodal training, which is compressing refresh cycles. Server vendors are therefore shipping liquid-cooled GPU trays as baseline configurations, halving lead times and aligning hardware with hyperscaler deployment schedules.
Hyperscale and Edge Data-Center Build-Out Momentum
Amazon Web Services committed USD 150 billion through 2030 for new capacity, signaling that compute-demand growth remains far from saturation. Google is erecting a 1-gigawatt campus in Saudi Arabia’s NEOM zone that leverages seawater cooling to achieve sub-1.1 power-usage effectiveness, which could serve as a template for desert deployments. Verizon already operates 47 edge nodes across the United States to support 5G standalone cores, each housing up to 50 low-latency servers. Colocation leaders are retrofitting legacy halls with 30 kilowatt feeds to capture AI demand without forcing tenants to lease entire suites. The convergence of hyperscale and edge models is therefore blurring traditional tier classifications and reshaping procurement criteria.
Liquid-Cooling-Ready Server Designs Enabling More than 80 kW Racks
Dell shipped more than 10,000 liquid-cooled PowerEdge systems in 2025 to customers running NVIDIA Blackwell clusters that push racks beyond 120 kilowatts. ASHRAE guidelines cap sustained air-cooled densities near 20 kilowatts, so operators must either embrace liquid solutions or accept lower server counts. Lenovo’s rear-door heat exchangers remove 80% of server heat before it enters the aisle, enabling customers to double density without costly chillers. Immersion methods are gaining share in cryptocurrency and HPC environments, although enterprise hesitation remains due to serviceability concerns. Publication of IEC 63361 in 2024 standardized coolant formulas and connector geometry, accelerating multivendor interoperability.
Adoption of Cloud-Computing Services
Public-cloud IaaS revenue surpassed USD 200 billion in 2025, yet enterprises are increasingly adopting hybrid designs that keep sensitive workloads on-premises while bursting to cloud for peaks, Indian, and Brazilian data-residency rules require that certain records remain within national borders, encouraging regional server clusters. All three hyperscalers are launching local zones in secondary metros to deliver sub-10-millisecond latency while honoring sovereignty mandates. Container orchestration lifts server utilization from historic 20% to roughly 55%, delaying refresh cycles even as total revenue rises. Banks are repatriating risk-modeling workloads after discovering that public-cloud egress fees can exceed USD 1 million per month for petabyte-scale datasets.
Restraints Impact Analysis*
| Restraint | (~) % Impact on CAGR Forecast | Geographic Relevance | Impact Timeline |
|---|---|---|---|
| Supply-Chain Volatility for Advanced Server Components (HBM, GPUs) | -1.2% | Global with acute North America and Asia-Pacific exposure | Short term (≤ 2 years) |
| Rising CapEx for Data-Center Construction | -0.9% | North America, Europe, tier-1 Asia-Pacific metros | Medium term (2-4 years) |
| Escalating Cyber-Security and Ransomware Risks | -0.5% | Global | Medium term (2-4 years) |
| Power-Grid Constraints and Permitting Delays in Tier-1 Metros | -0.4% | North America, Europe, select Asia-Pacific cities | Long term (≥ 4 years) |
| Source: Mordor Intelligence | |||
Supply-Chain Volatility for Advanced Server Components
HBM production remains concentrated in SK Hynix and Micron, resulting in 40-week lead times for NVIDIA H200 servers and 52-week waits for Blackwell systems. SK Hynix raised HBM3e yields to 70%, yet capacity is fully booked until mid-2026. NVIDIA allocates chips to customers that pre-commit multi-year volumes, sidelining mid-tier providers lacking such scale. TSMC’s CoWoS packaging lines are operating above 95% utilization with relief not expected until late 2026. As a result, AI-optimized servers carry 25%-30% premiums, eroding margins for colocation landlords bound by fixed-rate contracts.
Rising CapEx for Data-Center Construction
Land near Dominion Energy substations in Northern Virginia sold for USD 2 million per acre in 2025 versus USD 650,000 in 2019, tripling location costs. Permitting cycles in Frankfurt and Amsterdam now exceed 24 months because municipalities scrutinize water use and acoustic impact. Equinix reported data center construction costs per megawatt rose 18% year over year due to steel inflation and liquid-cooling retrofits. Operators are countering by converting brownfield factories where power is pre-installed, cutting build time from 30 months to 14 months. Prefabricated modules deploy within 90 days, although upfront cash outlay remains 15% higher than stick-built halls.
*Our forecasts treat driver/restraint impacts as directional, not additive. The impact forecasts reflect baseline growth, mix effects, and variable interactions.
Segment Analysis
By Tier Type: Redundancy Preferences Reshape Spend
Tier 3 sites dominated the data center server market, accounting for 56.72% of the market in 2025, as enterprises sought redundancy without the full cost of concurrent maintainability. Tier 4 adoption is accelerating at a 17.54% CAGR, driven by financial and healthcare firms confronting rising downtime penalties. The Uptime Institute noted that 23% of new projects in 2025 requested Tier 4 certification, up nine points from 2023. High-specification facilities integrate dual power supplies and independent cooling loops, adding USD 800-USD 1,200 per server but safeguarding against single-path failure. Tier 1 and Tier 2 environments persist at the edge, where brief outages are tolerable, and capex budgets remain tight.
A parallel architectural divergence is emerging as hyperscalers deploy custom resilience schemes that bypass traditional tier labels, routing workloads across zones in under 200 milliseconds. Basel Committee operational resilience guidelines are nudging banks toward Tier 3 minimums, indirectly influencing server procurement decisions. Colocation landlords are adopting modular UPS systems that scale capacity incrementally, aligning cash outflow with uncertain tenant growth.


By Data Center Size: Hyperscale Dominance Alters Channel Mix
Hyperscale campuses captured 58.94% of the market share in 2025, underscoring how AI training clusters favor footprints exceeding 500,000 square feet. The segment is tracking a 17.48% CAGR through 2031 as Meta and Microsoft commission gigawatt-scale parks. Large regional halls fill the gap for second-tier cloud providers, while medium facilities support mid-market colocation. Small edge sites, though numerous, contribute modestly to the data center server market size because they have limited server counts.
OEMs are reorganizing sales teams around hyperscale accounts that demand custom boards, proprietary firmware, and just-in-time logistics. Original design manufacturers such as Quanta and Wistron are exchanging margin for volume, delivering 50,000-unit quarters to cloud clients. Medium enterprises gravitate toward converged infrastructure that simplifies deployment but increases vendor lock-in. Edge operators favor rugged blades rated for industrial temperatures, a niche dominated by specialist suppliers.
By Data Center Type: Vertical Integration Gains Momentum
Colocation maintained 54.87% of the market share in 2025, yet hyperscalers and cloud operators are growing faster at 17.74% CAGR as they seek full control of mechanical systems. Amazon already operates more than 100 wholly owned sites, allowing deployment of custom Graviton processors without landlord negotiation. Colocation firms now offer hyperscale-flex halls where tenants manage their own chillers, blurring the lease versus build decision. Enterprises are accelerating on-premises spending via appliances such as Oracle Cloud@Customer to comply with data residency rules.
Software-defined orchestration raises utilization above 60% in hyperscaler fleets while enterprise ratios languish near 30%. Colocation landlords deploy AI-driven capacity-planning tools to anticipate tenant expansion, reducing provisioning time from weeks to days. Hyper-converged systems are popular among mid-market buyers that prioritize simplicity over multivendor flexibility.
By Form Factor: Micro-Blades Accelerate At The Edge
Half-height blades accounted for 62.65% of the market share in 2025, balancing density and serviceability inside enterprise chassis. Quarter-height and micro-blade designs are advancing at a 17.86% CAGR through 2031 as telcos deploy 5G core functions in constrained cabinets. Full-height blades remain prevalent in high-performance clusters due to NVMe and dual-socket capacity. Dell’s MX platform mixes blade heights within one enclosure, easing the transition from CPU-centric to AI-augmented loads.
Nokia’s AirFrame servers use quarter-height blades to co-locate compute with radio equipment, cutting latency below five milliseconds. ARM-based blades deliver 40% lower power per thread than x86 incumbents, saving cooling overhead and extending battery backup. Micro-blade adoption in web-tier and content caches underscores how the data center server industry is fragmenting around workload-specific economics rather than one-size-fits-all platforms.
By Application: Repatriation Fuels Virtualization Upswing
AI and ML workloads held 37.76% of the market share in 2025, yet virtualization platforms are growing at 17.39% CAGR as enterprises pull workloads back from public clouds. VMware’s vSphere installed base expanded 12% in 2026, its fastest growth in seven years. High-performance computing is converging with AI, with pharmaceutical and finance industries blending simulation and deep learning on shared GPU fabrics. Storage-centric servers optimized for dense drives are proliferating inside hyperscale archives that feed AI training pipelines.
Inference tasks are migrating to edge nodes equipped with lower-power accelerators, such as AWS Inferentia, distributing AI capabilities closer to users. Computational storage drives offload encryption and compression to the SSD, increasing throughput and freeing CPU cycles. The data center server market, therefore, balances AI-first demand with a renaissance in virtualization that prioritizes data sovereignty and predictable cost.
Geography Analysis
North America accounted for 39.83% of the market share in 2025, driven by hyperscale capital expenditure and early liquid-cooling deployments. The region benefits from mature power grids, abundant fiber, and tax incentives that offset rising land costs. Sovereign-cloud requirements are modest, so multitenant colocation remains attractive for enterprises seeking rapid capacity additions. However, permitting delays in Northern Virginia and California are lengthening construction timelines, nudging operators toward Midwest and Mountain-West alternatives with faster interconnection approvals.
Asia-Pacific is the fastest-growing region at an 18.01% CAGR through 2031. China is prioritizing domestic server vendors after export controls curtailed access to leading-edge GPUs, redirecting demand toward Inspur and Huawei platforms. India’s production-linked incentive scheme is attracting Foxconn and Wistron assembly plants, reducing import duties and shortening lead times for local cloud providers. Japan clusters investments around Tokyo and Osaka due to cable proximity and resilient grids, while regional cities struggle with capacity caps.
Europe is stabilizing as renewable-energy mandates encourage hyperscalers to expand in the Nordics and Ireland where hydro and wind lower carbon intensity. Stringent water-usage regulations in Frankfurt and Amsterdam push developers toward closed-loop cooling and brownfield conversions. The Middle East and Africa are emerging corridors as Saudi Arabia and the United Arab Emirates pledge more than USD 50 billion for digital infrastructure that diversifies economies away from hydrocarbons. South America remains comparatively small, yet Brazil’s data-protection law is stimulating local deployments to avoid cross-border data transfers. Africa’s nascent server market concentrates in South Africa and Nigeria where diesel-solar hybrids mitigate unreliable grids, although total cost exceeds developed-market benchmarks by up to 40%.
Mordor Intelligence provides coverage of the data center server market across other key regional markets, including North America, Americas, Europe, Asia, Middle East, and Africa, each with their regulatory frameworks and demand patterns. Detailed country-level analysis extends to Canada, Brazil, Sweden, and Indonesia incorporating local coverage and market participation, as required.

Competitive Landscape
The data center server market exhibits moderate fragmented, with the top five branded OEMs such as Dell Technologies, Hewlett Packard Enterprise, Lenovo, Inspur, Cisco, and others. while original design manufacturers secure more than 30% of hyperscale volumes. ARM-based entrants such as Ampere Computing and Qualcomm-Ventana are carving out web-tier positions where power per thread drives purchasing decisions. NVIDIA is integrating complete systems under its DGX and HGX brands, compressing OEM margin on GPU-dense configurations.
Broadcom’s takeover of VMware bundles compute, networking, and virtualization in subscription packages that could lock customers into multi-year commitments. AMD is winning inference share with the MI300X chiplet architecture that offers compelling performance per dollar compared to monolithic rivals. Patent filings for immersion-fluid chemistries and blind-mate liquid connectors climbed 40% in 2024, illustrating an innovation race led by specialists such as CoolIT Systems and Asetek. White-space opportunities persist in turnkey cooling subsystems, an area where incumbent OEMs lack in-house depth and therefore partner with niche suppliers.
Vendor roadmaps increasingly emphasize software-defined telemetry that optimizes power, thermals, and job scheduling, elevating firmware and orchestration as competitive levers. Lenovo has formalized a joint portfolio with NVIDIA that couples ThinkSystem servers to DGX software for simplified AI rollouts. Dell is integrating liquid cooling across its XE line to maintain density leadership, while HPE’s GreenLake bundles Cray supercomputers with subscription consumption models. Inspur’s partnership with Alibaba Cloud to co-develop ARM servers underlines the shifting architecture mix in China.
Data Center Server Industry Leaders
Dell Technologies
Hewlett Packard Enterprise
Lenovo Group Limited
Fujitsu Limited
Cisco Systems Inc.
- *Disclaimer: Major Players sorted in no particular order

Recent Industry Developments
- February 2026: NVIDIA announced the Rubin GPU architecture, featuring HBM4 memory on a 3-nanometer node, with production slated for 2027.
- January 2026: Amazon Web Services confirmed a USD 150 billion global capacity expansion through 2030.
- December 2025: Dell Technologies introduced the liquid-cooled PowerEdge XE9680L supporting eight NVIDIA H200 GPUs in a 6U frame.
- November 2025: Qualcomm completed the acquisition of Nuvia and began shipping Oryon-based server processors to hyperscalers.


Research Methodology Framework and Report Scope
Market Definitions and Key Coverage
Our study defines the global data center server market as the total factory-gate revenue generated from newly manufactured rack, blade, tower, micro, and accelerator-rich compute nodes that power colocation, hyperscale, enterprise, and edge facilities. According to Mordor Intelligence analysts, these servers integrate processors, memory, onboard storage, and network interfaces and are sold either bare-metal or pre-configured for virtualization, AI/ML, HPC, and traditional IT workloads.
Refurbished hardware, purely storage appliances, and third-party managed services sit outside this assessment.
Segmentation Overview
- By Tier Type
- Tier 1 and 2
- Tier 3
- Tier 4
- By Data Center Size
- Small Data Center
- Medium Data Center
- Large Data Center
- Hyperscale Data Center
- By Data Center Type
- Colocation Data Center
- Hyperscalers Data Center/CSPs
- Enterprise and Edge Data Center
- By Form Factor
- Half-height Blades
- Full-height Blades
- Quarter-height / Micro-blades
- By Application / Workload
- Virtualisation and Private Cloud
- High-Performance Computing (HPC)
- Artificial Intelligence/Machine Learning and Data Analytics
- Storage-centric
- Edge / IoT Gateways
- By Geography
- North America
- United States
- Canada
- Mexico
- South America
- Brazil
- Argentina
- Rest of South America
- Europe
- Germany
- United Kingdom
- France
- Italy
- Spain
- Rest of Europe
- Asia-Pacific
- China
- India
- Japan
- South Korea
- Rest of Asia-Pacific
- Middle East and Africa
- Middle East
- Saudi Arabia
- United Arab Emirates
- Rest of Middle East
- Africa
- South Africa
- Nigeria
- Rest of Africa
- Middle East
- North America
Detailed Research Methodology and Data Validation
Primary Research
Mordor's analysts interviewed data-center architects, OEM product managers, liquid-cooling integrators, and colocation procurement heads across North America, Europe, Asia-Pacific, and the Gulf. These interactions clarified real-world rack densities, GPU attach ratios, and refresh cadences, which we then married with secondary findings to close information gaps and test assumption elasticity.
Desk Research
We first created a foundational evidence stack using open datasets from bodies such as the U.S. Energy Information Administration, Eurostat, JRC EU Data Center Inventory, China Academy of Information and Communications Technology, and the Korea Copyright Commission, which publish shipment, power-draw, and facility-count statistics. Trade association releases, OCP Foundation white papers, the Uptime Institute's outage studies, and the Open19 Project benchmarks helped us identify form-factor migration rates. Company 10-Ks, rack-density filings, and hyperscaler CAPEX disclosures complemented these sources. Paid databases that Mordor subscribes to, including D&B Hoovers for supplier financials and Dow Jones Factiva for deal flow, offered further triangulation. This list is illustrative, not exhaustive; many other repositories were referenced for validation.
A second pass synthesized patent analytics from Questel, import-export logs from Volza, and regional customs reports to refine unit flows and average selling prices, enriching our bottom-up cross-checks.
Market-Sizing & Forecasting
A top-down model starts with national production plus import-export balances, reconstructing the 2025 demand pool. Selective bottom-up roll-ups of leading OEM shipments and sampled ASP × volume sets validate and adjust totals. Key variables like hyperscaler annual CAPEX, average rack power (kW), server refresh cycle length, GPU attach penetration, and edge facility counts feed a multivariate regression that drives the 2025-2030 view. Scenario analysis layers in power-grid constraints and silicon supply elasticity before finalizing outputs.
Data Validation & Update Cycle
Outputs undergo multi-step variance checks against independent capacity trackers and energy-consumption indices. Senior reviewers flag anomalies, and any material variance triggers re-contact of sources. Reports refresh yearly; interim updates follow major regulatory or technology inflection points, ensuring clients receive our most current baseline.
Why Mordor's Data Center Server Baseline Commands Reliability
Published figures diverge because firms pick different server classes, ASP assumptions, and refresh horizons. Mordor's disciplined scoping, frequent refresh cadence, and dual-track validation temper over-optimistic cloud build plans and under-reported edge rollouts.
Benchmark of Recent Estimates
Benchmark comparison
| Market Size | Anonymized source | Primary gap driver |
|---|---|---|
| USD 110.0 B (2025) | Mordor Intelligence | - |
| USD 59.31 B (2025) | Global Consultancy A | Omits edge-deployable microservers and relies on desk sources only |
| USD 78.87 B (2024) | Industry Research House B | Uses older base year and single ASP benchmark, limited hyperscale coverage |
| USD 98.50 B (2024) | Media Portal C | Excludes GPU-dense and liquid-cooled units, focuses on x86 rack designs |
These contrasts show that when scope and inputs narrow, totals shrink. By selecting the full spectrum of server types, applying region-specific ASPs, and refreshing annually, Mordor Intelligence delivers a balanced, transparent baseline that decision-makers can trace back to clear variables and repeatable steps.


Key Questions Answered in the Report
What is the data center server market size in 2026?
The data center server market reached USD 127.49 billion in 2026.
What CAGR is forecast for the global data center server market between 2026 and 2031?
The market is projected to expand at a 16.05% CAGR during 2026-2031.
Which region is expected to post the fastest server revenue growth through 2031?
Asia-Pacific leads with a 18.01% CAGR propelled by semiconductor self-sufficiency and data-localization mandates.
How large was the hyperscale segment of the data center server market in 2025?
Hyperscale campuses captured 58.94% of global server revenue in 2025.
Why are liquid-cooling-ready servers gaining momentum?
GPU-dense racks now exceed 80 kilowatts, making liquid cooling essential to manage thermal loads that air systems cannot handle economically.
What is the primary component bottleneck affecting AI server deliveries?
Limited production of high-bandwidth memory extends lead times for GPU-equipped servers to as much as 52 weeks.
Page last updated on:


