Canada Data Center Market Size and Share
Market Overview
| Study Period | 2020 - 2031 |
|---|---|
| Forecast Data Period | 2026 - 2031 |
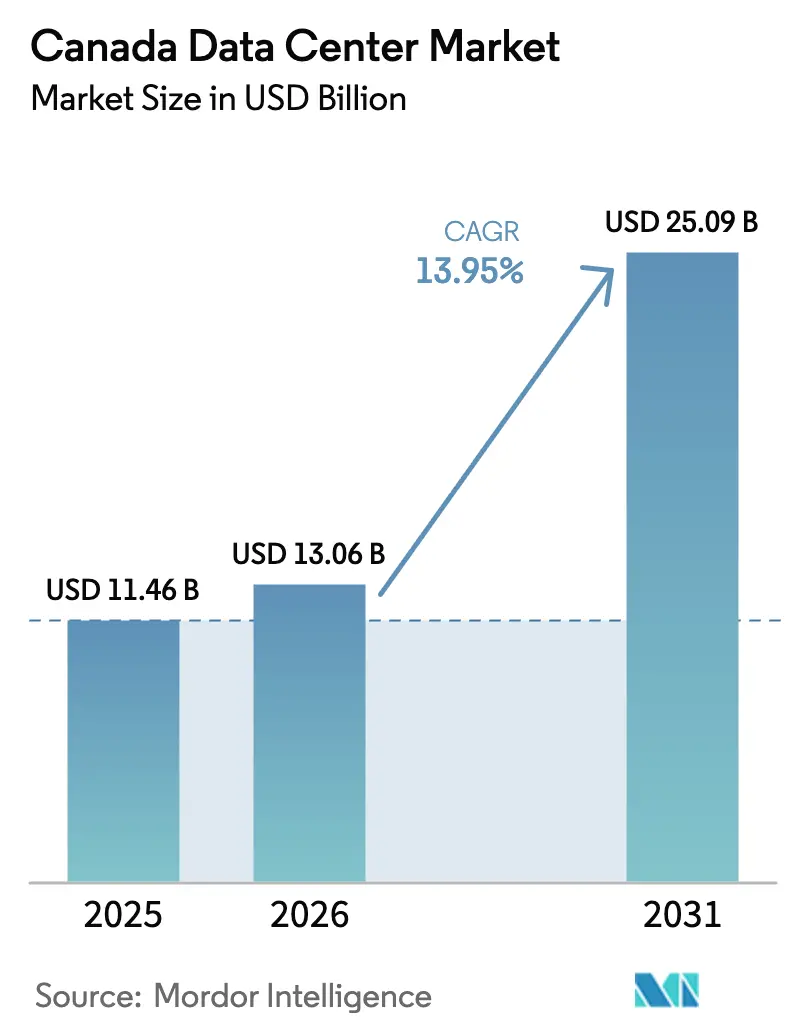
| Base Year Market Size (2025) | USD 11.46 Billion |
| Market Size (2026) | USD 13.06 Billion |
| Market Size (2031) | USD 25.09 Billion |
| Growth Rate (2026 - 2031) | 13.95% CAGR |
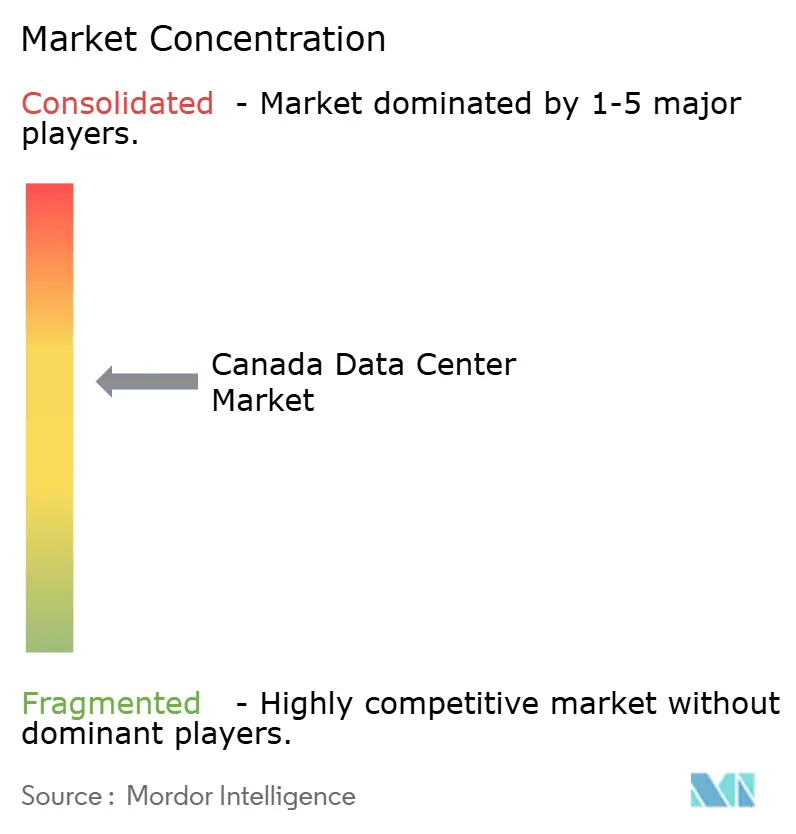
| Market Concentration | Medium |
Major Players *Disclaimer: Major Players sorted in no particular order Image © Mordor Intelligence. Reuse requires attribution under CC BY 4.0. | |
Canada Data Center Market Analysis by Mordor Intelligence
The Canada Data Center Market size in 2026 is estimated at USD 13.06 billion, growing from 2025 value of USD 11.46 billion with 2031 projections showing USD 25.09 billion, growing at 13.95% CAGR over 2026-2031. In terms of IT load capacity, the market is expected to grow from 3.13 thousand megawatt in 2025 to 3.97 thousand megawatt by 2030, at a CAGR of 4.89% during the forecast period (2025-2030). The market segments shares and estimates are calculated and reported in terms of MW. Momentum comes from hyperscale cloud platforms localizing workloads, a surge in artificial intelligence (AI) training clusters, and cross-border data-sovereignty mandates that encourage United States enterprises to process regulated information on Canadian soil. Tier 3 facilities dominate because they deliver high availability at cost levels most enterprises will accept, while colocation arrangements remain the default sourcing model as firms avoid capital-intensive self-builds. Ontario retains the largest provincial footprint thanks to dense fiber routes and proximity to the nation’s financial hub, whereas Quebec accelerates on the back of low-cost hydroelectricity and direct provincial incentives for AI development. Competitive positioning favors operators that combine renewable power access, scale economics, and sovereign-cloud credentials. Against that backdrop, power price disparities outside hydro-rich regions and a shortage of specialized technicians temper the medium-term growth curve.
Key Report Takeaways
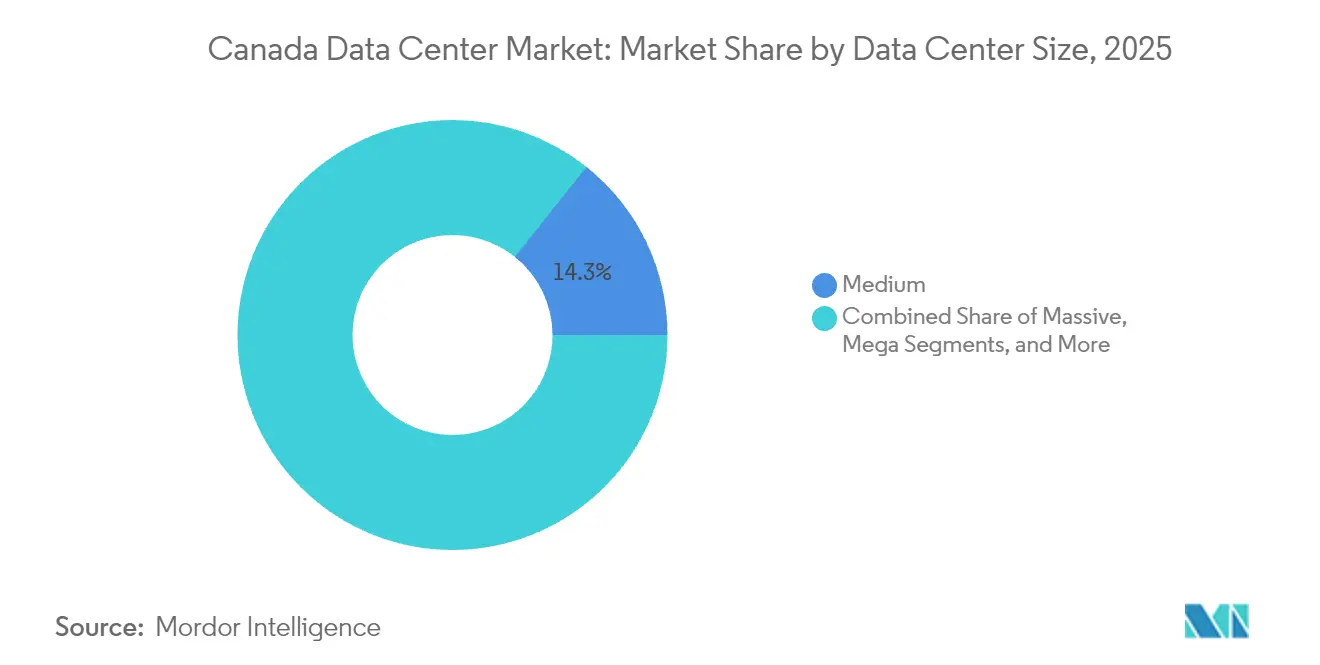
- By data center size, medium facilities captured 14.28% of the Canada data center market share in 2025, while large facilities are advancing at a 4.93% CAGR through 2031.
- By tier classification, Tier 3 facilities held 80.95% revenue share in 2025; Tier 4 is forecast to expand at 5.45% CAGR to 2031.
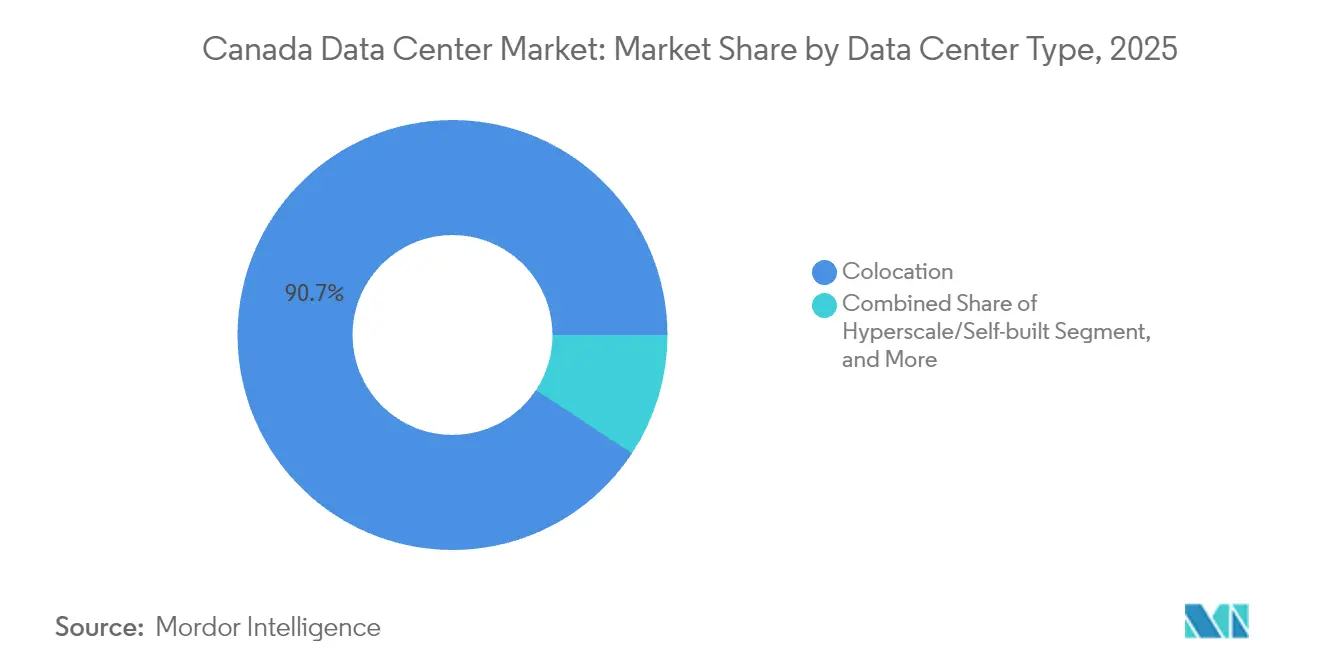
- By data center type, colocation models accounted for 90.72% of the Canada data center market size in 2025 and hyperscale cloud deployments are projected to grow at 6.58% CAGR 2031 over the period.
- By end user, IT and telecommunications commanded 48.12% share in 2025, whereas banking, financial services, and insurance workloads are set to grow the fastest at 6.31% CAGR to 2031.
- By hotspot, Quebec accounted for 24.55% of the Canada data center market share in 2025 and is expanding at a 5.44% CAGR through 2031.
Note: Market size and forecast figures in this report are generated using Mordor Intelligence’s proprietary estimation framework, updated with the latest available data and insights as of 2026.
Canada Data Center Market Trends and Insights
Drivers Impact Analysis*
| Driver | (~) % Impact on CAGR Forecast | Geographic Relevance | Impact Timeline |
|---|---|---|---|
| Surge in cloud service adoption and hyperscale expansions | +1.2% | National – Ontario and Quebec core | Medium term (2-4 years) |
| Government green energy incentives for data centers | +0.9% | Quebec, British Columbia, Manitoba | Long term (≥ 4 years) |
| Rising data consumption from 5G and video streaming | +0.8% | Urban centers nationwide | Short term (≤ 2 years) |
| Carbon credit monetization via hydro and wind power | +0.6% | Quebec and British Columbia | Long term (≥ 4 years) |
| Cross-border data sovereignty demand from United States enterprises | +0.4% | National – Toronto-Montréal corridor | Medium term (2-4 years) |
| Growing AI and HPC workloads from public-sector research | +0.2% | National – research hubs | Long term (≥ 4 years) |
| Source: Mordor Intelligence | |||
Surge in Cloud Service Adoption and Hyperscale Expansions
Hyperscale platforms are localizing infrastructure to satisfy stricter data-residency rules and latency budgets, pushing the Canada data center market toward multi-hundred-megawatt campuses. eStruxture’s Calgary build-out, valued at CAD 750 million (USD 585 million), will deliver 90 MW dedicated to generative-AI and cloud workload. The arrival of these projects compresses deployment timelines for supporting fiber, utility interconnects, and edge nodes. Cloud operators also draw on the national network of cable landing stations to balance east-to-west traffic flows and simultaneously backhaul U.S. overflow traffic when southern networks face congestion. The effect is a steady rise in wholesale colocation contracts, longer average lease tenures, and higher rack-power densities across Tier 3 halls. Because Canada offers political stability and a clear privacy framework, providers view current construction waves as anchor investments that will shape cross-border workload allocation for a decade.
Rising Data Consumption from 5G and Video Streaming
National 5G rollouts create granular data spikes as ultra-high-definition streaming, augmented-reality services, and smart-city sensors converge on mobile backhaul networks. TELUS budgeted CAD 50 billion (USD 39 billion) through 2028 to modernize radio sites and the data center edge required to maintain sub-10-millisecond round-trip latency targets. Video providers concurrently escalate 4K and 8K catalog delivery, which forces content delivery networks to embed cache nodes deep inside carrier hotels. As these workloads mature, single racks now require upward of 30 kW for transcoding accelerators, triple the baseline from legacy streaming nodes. Municipalities with metro-fiber loops and affordable real estate have begun zoning micro-facilities so operators can containerize compute closer to population clusters. Collectively, these shifts anchor a robust demand corridor that will keep utilization levels above the 80% benchmark that triggers the next expansion phase.
Government Green Energy Incentives for Data Centers
Federal and provincial agencies leverage their abundant hydro resources to attract capital-intensive computing projects by reducing power tariffs and expediting grid interconnection approvals. Quebec’s electricity rate of CAD 0.0537 per kWh (USD 0.042 per kWh) under Hydro-Québec’s data-center tariff sits 60% below Alberta’s fossil-fuel-indexed rate, widening location arbitrage opportunities. British Columbia’s Clean Energy Act guarantees 93% renewable generation on the grid, enabling operators to meet net-zero targets without complex off-site power-purchase agreements. At the federal level, the Canadian Sovereign AI Compute Strategy earmarks capital subsidies and accelerated depreciation benefits for sites that document renewable-power sourcing. These incentives compress payback periods by as much as two years, steering a wave of hyperscale bids that might otherwise default to U.S. mountain-state locales. The upshot is a structural cost advantage that underpins medium-term competitiveness for the Canada data center market.
Carbon Credit Monetization via Hydro and Wind Power
Operators are beginning to treat greenhouse-gas offsets as a secondary revenue stream. Under the federal carbon-pricing framework, facilities that certify renewable inputs and deploy waste-heat recovery earn credits tradable to industrial emitters. Bell’s 500 MW AI Fabric project in British Columbia is purpose-engineered to harvest such credits, which management views as a multi-million-dollar cash-flow hedge once GPUs ramp to full utilization. Early estimates suggest a 4% uplift in internal-rate-of-return metrics for greenfield builds that integrate district-heating to nearby campuses. Credible offset economics also resonate with U.S. corporates that need audit-grade emissions accounting, reinforcing Canada’s position as a low-carbon compute enclave for North American multinationals. Over the long term, carbon-credit liquidity could evolve into a core underwriting assumption for project financiers.
Restraints Impact Analysis*
| Restraint | (~) % Impact on CAGR Forecast | Geographic Relevance | Impact Timeline |
|---|---|---|---|
| High power costs outside hydro-rich provinces | -0.7% | Alberta, Saskatchewan, Atlantic provinces | Short term (≤ 2 years) |
| Limited skilled data center workforce availability | -0.5% | National – sharper in secondary metros | Medium term (2-4 years) |
| Lengthy permitting over Indigenous land consultations | -0.3% | Resource-rich territories | Long term (≥ 4 years) |
| Rising insurance premiums for crypto-focused facilities | -0.2% | Mining-intensive regions | Short term (≤ 2 years) |
| Source: Mordor Intelligence | |||
High Power Costs Outside Hydro-Rich Provinces
Electricity in Alberta averages CAD 0.2367 per kWh (USD 0.187 per kWh), a four-and-a-half-fold premium over Quebec tariffs. Such disparities erode the cost model for AI training farms that can consume 70 MW blocks at 90-plus percent load factors. Although natural-gas co-generation projects partially offset grid prices, developers still struggle to model competitive hosting rates compared with hydro regions. The imbalance funnels investment toward eastern corridors, deepening provincial capacity gaps and forcing cloud tenants to backhaul traffic longer distances. Over time, under-investment risks throttling digital-economy growth in prairie and Atlantic provinces unless regulators subsidize renewable build-outs or freeze industrial power rates temporarily. In the near term, pricing volatility knocks 0.7 percentage points off the headline CAGR for the Canada data center market.
Limited Skilled Data Center Workforce Availability
Uptime Institute projects global facility headcount demand will jump 42% by 2030, yet Canadian vocational pipelines lag similar economies.[1]Innovation, Science and Economic Development Canada, “Canadian Sovereign AI Compute Strategy,” ised-isde.canada.ca High-density liquid-cooling, advanced power-train monitoring, and zero-trust cyber-posture frameworks require specialized technicians rarely trained in conventional IT programs. Talent gravitates toward Toronto and Vancouver, leaving new builds in Calgary, Winnipeg, and Halifax short-staffed during commissioning. Wage pressure already adds several million dollars to annual operating expense lines for mid-scale facilities, and project timelines slip when critical path tasks rely on the same pool of commissioning engineers. National re-skilling schemes are underway, but the timing gap means staffing shortfalls will shave 0.5 percentage points off the compound growth rate unless immigration and fast-track apprenticeship reforms gain traction quickly.
*Our forecasts treat driver/restraint impacts as directional, not additive. The impact forecasts reflect baseline growth, mix effects, and variable interactions.
Segment Analysis
By Data Center Size - Capacity Polarization Favors Larger Campuses
Large facilities crossed 1.1 thousand MW of installed IT load in 2025, equal to 33.72% of the Canada data center market size, and are pacing at a 4.93% CAGR through 2031. Hyperscale firms target 50 MW to 100 MW blocks because consolidated campuses unlock bulk-power discounts, streamline security postures, and accommodate in-rack liquid cooling without piecemeal retrofits. Smaller enterprises continue to lease space in medium facilities due to lower minimum commitments, which explains that segment’s 14.28% share last year. Yet capacity requests above 5 MW are migrating almost exclusively to large campuses that bundle on-site substations with direct dark-fiber routes into cloud on-ramps. eStruxture’s Calgary campus exemplifies this shift, reserving two adjacent land parcels for eventual 150 MW expansion corridors.
Medium facilities retain relevance where latency budgets dictate inner-city proximity or where municipal codes restrict power draw. Operators retrofit existing office towers into 5 MW to 10 MW sites that host content-delivery edge nodes, low-latency trading engines, and disaster-recovery arrays. At the smallest end, distributed micro-data centers emerge inside retail exchanges and smart-manufacturing plants, but these assets represent less than 2% of the Canada data center market. Over the next five years, capital allocation patterns strongly suggest a bifurcated landscape in which multi-facility hyperscale parks coexist with high-margin, metro-edge nodes rather than an even distribution across traditional small, medium, and large brackets.


By Tier Type - Tier 3 Remains the Commercial Standard
Tier 3 captured 80.95% of installed capacity in 2025, underpinning mainstream enterprise workload hosting. Operators value the 99.982% uptime guarantee and N+1 redundancy because it balances reliability against cost ceilings tolerable to CIO budgets. The Canada data center market share for Tier 4 facilities will, however, expand by 5.45% CAGR, fueled by banking, defense, and healthcare mandates that stipulate concurrent-maintenance and fault-tolerant architectures. Bell incorporated Tier 4 design into the AI Fabric blueprint to ensure continuous inference availability for public-safety analytics.
Tier 2 halls persist within legacy telecommunications exchanges where non-critical network elements reside, but fresh capex rarely flows to this class. Some owners plan phased upgrades that insert secondary generator lines and double-interlocked static switches to elevate sites to Tier 3 over the life of the lease. In contrast, Tier 1 is virtually absent in Canada because even budget-constrained customers expect at least basic redundant components. The progression illustrates a broader premiumization arc as AI and real-time analytics workloads demand ever-tighter service-level agreements, gradually nudging the mean uptime expectation closer to Tier 4 status over the decade.
By Data Center Type - Colocation Dominates, Cloud Self-Build Accelerates
Colocation accounted for 90.72% of installed cabinets in 2025, underscoring how enterprises prefer operational outsourcing while retaining control over server procurement and security stacks. Wholesale deals drive square-footage demand as tenants lease full suites for predictable power envelopes, whereas retail cages serve seasonal traffic bursts and proof-of-concept sandboxes. Self-build hyperscale campuses represent the fastest-growing slice at 6.58% CAGR as Amazon Web Services, Google Cloud, and Microsoft Azure execute sovereign-cloud blueprints. These firms prioritize direct utility relationships and proprietary evaporative-cooling designs that colocation landlords cannot replicate without multi-million-dollar, tenant-specific fit-outs.
Hybrid deployment models are flourishing, where enterprises deploy core AI training rigs on hyperscale stacks and burst smaller inference engines into retail colocation racks nearer to users. TELUS’s Sovereign AI Factory blends both paradigms: a colocation framework integrated with NVIDIA DGX clusters that clients rent on demand. Over the forecast window, such composite models are expected to deepen entanglement between carrier hotels, regional cloud zones, and on-premise micro-pods, embedding structural complexity into the Canada data center industry without dislodging colocation from its anchor role.
By End User - Telecom and IT Lead, Financial Services Accelerate
Telecom and IT workloads absorbed 48.12% of national rack count in 2025 as carriers virtualized 5G cores and content platforms cached media libraries closer to viewers. Network-function virtualization alone doubled compute density in TOR-IX metro facilities compared with 2023 levels. Banks and insurers trail at only 12.00% today, yet their 6.31% CAGR through 2031 will lift the segment into second place as tighter anti-money-laundering regulations, real-time payment rails, and open-banking APIs demand low-latency processing inside sovereign boundaries. The shift takes place while generative-AI risk analytics and fraud-detection inference jobs escalate GPU carriage per node, swelling power budgets for next-generation trading grids.
E-commerce, public-sector digitization, and media companies combine for the remaining third of cabinet consumption. Federal agencies ramp cloud-first migrations away from aging mainframes, but they stipulate domestic hosting, thereby feeding incremental colocation absorption in national capital regions. Manufacturing firms contribute a small yet rising share as industrial IoT telemetry flows into data lakes for predictive maintenance cycles. Across verticals, enterprises converge on a sourcing pattern where mission-critical, privacy-sensitive datasets remain within Canada while less sensitive archives traverse cross-border WAN paths cementing the long-run utilization outlook for the Canada data center market.
Geography Analysis
Quebec accounted for 24.55% of the Canada data center market share in 2025 and is expanding at a 5.44% CAGR through 2031, the fastest pace among all provinces. Low-carbon hydroelectricity priced at CAD 0.0537 per kWh (USD 0.042 per kWh) underpins total operating cost that sits 40% below the national average, giving the province a durable edge for energy-intensive AI training clusters. The 2025 pipeline already tops 600 MW of announced capacity, positioning Quebec to lift its share of the Canada data center market size by at least 3 percentage points by the end of the decade. Provincial tax credits tied to renewable-power sourcing further compress payback periods, drawing hyperscale players that previously limited investment to Toronto metro zones.
Campus designs in Montréal and Lévis now target rack densities of 70 kW, reflecting demand from generative-AI workloads that flourish under abundant low-cost power. Operators integrate district-heating schemes that funnel waste heat into municipal systems, enabling an additional revenue stream through verification-grade carbon credits. Fiber-optic corridors connecting Montréal to Ashburn and New York deliver sub-15-millisecond round-trip latency, allowing U.S. enterprises to host compliance-sensitive data in Canada without noticeable performance penalties. As provincial regulators fast-track environmental permits for projects leveraging renewable generation, Quebec is on track to anchor the next wave of sovereign-cloud and high-performance compute deployments in the Canada data center market.
Ontario kept a 35.78% foothold in 2025, leveraging deep interconnection at 151 Front Street West and fast backhaul to New York financial venues, which together anchor trading, fintech, and gaming workloads. The province’s data-center development pipeline now exceeds 500 MW as local governments streamline building permits and brownfield conversions. Quebec, by contrast, owns the growth narrative with a 5.44% CAGR as competitively priced hydroelectricity underpins hyperscale AI training farms and energy-intensive cryptocurrency rigs. Provincial policy layers grants on top of low tariffs, aligning ESG compliance with shareholder return thresholds for global cloud firms.
British Columbia ranks third in cumulative IT load, yet its Pacific gateway vantage fosters submarine-cable redundancy that multinational SaaS vendors value for trans-Pacific route diversity. Bell’s AI Fabric cluster in Kamloops allocates 500 MW of capacity across six buildings, harnessing hydro and integrating district-heating loops that supply a nearby university campus. Alberta illustrates a mixed picture: abundant land and business-friendly tax regimes invite large footprints, but gas-indexed electricity tariffs compress margin headroom. Developers respond with on-site renewable micro-grids to shave energy costs, illustrating how location differentials shape design decisions inside the Canada data center industry.
Atlantic provinces and Manitoba remain niche but promising. Halifax leverages subsea-cable landing stations for latency-sensitive content to Europe, whereas Winnipeg markets baseload hydro power and cold ambient temperatures favorable to free-air cooling most of the year. Saskatchewan eyes flare-gas-to-power schemes for modular facilities near oil fields, but workforce scarcity and complex permitting timelines postpone large-scale arrivals. Over the decade, regional policy competition and grid decarbonization trajectories will redistribute incremental megawatts, yet Ontario and Quebec are projected to hold twin core roles given fiber aggregation and renewable-price advantages.
Competitive Landscape
Canada’s data center sector demonstrates moderate concentration: the five largest operators control just over 55% of installed megawatts. eStruxture, Equinix, and Vantage sustain multiregional footprints, while Bell, Rogers, and TELUS integrate network assets with expanding data-center estates to capture AI hosting demand. Capital efficiency increasingly revolves around vertical integration; telecom incumbents fold AI-optimized facilities into managed-service portfolios, leveraging last-mile access contracts to upsell edge compute. Pure-play colocation providers scale through sale-leaseback transactions, pulling in institutional capital to fund multi-building expansions in Quebec and Ontario corridors.
Technology is the strategic swing factor. Operators race to deploy direct-to-chip liquid cooling and 400G optical fabrics to attract high-density GPU workloads that command premium recurring revenue. eStruxture’s next-generation halls support 70 kW racks at PUE targets below 1.3, benchmarking favorably against North American peers. Vantage absorbs 4Degrees Colocation to acquire proprietary coolant distribution intellectual property, underscoring how Mergers and Acquisitions unlock specialized capabilities more rapidly than greenfield R&D. License-to-operate credentials also matter: players with Clean Energy Certificates earn preferential consideration from ESG-oriented tenants.
Funding pipelines stay robust. Cologix raised CAD 1.5 billion (USD 1.17 billion) in 2024 to finance new Montréal and Vancouver capacity clusters, while DigitalBridge partnered with DataBank for a USD 600 million debt deal that includes Canadian sites. Rising land prices near Tier I metros, however, squeeze smaller entrants that lack anchor-tenant commitments. Over the outlook horizon, expect selective consolidation as top-tier operators purchase single-site specialists, using balance-sheet leverage to scale ahead of hyperscale pre-lease negotiations.
Canada Data Center Industry Leaders
Vantage Data Centers LLC
Equinix Inc.
eStruxture Data Centers Inc.
Les.net Inc.
IREN Limited
- *Disclaimer: Major Players sorted in no particular order

Recent Industry Developments
- May 2025: Bell Canada announced Bell AI Fabric to build 500 MW of hydro-powered AI compute capacity across six British Columbia facilities, partnering with Groq and Thompson Rivers University.
- March 2025: eStruxture confirmed a CAD 750 million (USD 585 million) 90 MW data center near Calgary, expected to create 250 construction and 45 permanent roles.
- March 2025: TELUS joined NVIDIA to repurpose an existing site into a Sovereign AI Factory for domestic model development and deployment.
- January 2025: DigitalBridge and DataBank closed USD 600 million financing to extend North American edge-data-center footprints into Canada.


Canada Data Center Market Report Scope
Ontario, Quebec are covered as segments by Hotspot. Large, Massive, Medium, Mega, Small are covered as segments by Data Center Size. Tier 1 and 2, Tier 3, Tier 4 are covered as segments by Tier Type. Non-Utilized, Utilized are covered as segments by Absorption.| Large |
| Massive |
| Medium |
| Mega |
| Small |
| Tier 1 and 2 |
| Tier 3 |
| Tier 4 |
| Hyperscale/Self-built | ||
| Enterprise/Edge | ||
| Colocation | Non-Utilized | |
| Utilized | Retail Colocation | |
| Wholesale Colocation | ||
| BFSI |
| IT and ITES |
| E-Commerce |
| Government |
| Manufacturing |
| Media and Entertainment |
| Telecom |
| Other End Users |
| Ontario |
| Quebec |
| Rest of Canada |
| By Data Center Size | Large | ||
| Massive | |||
| Medium | |||
| Mega | |||
| Small | |||
| By Tier Type | Tier 1 and 2 | ||
| Tier 3 | |||
| Tier 4 | |||
| By Data Center Type | Hyperscale/Self-built | ||
| Enterprise/Edge | |||
| Colocation | Non-Utilized | ||
| Utilized | Retail Colocation | ||
| Wholesale Colocation | |||
| By End User | BFSI | ||
| IT and ITES | |||
| E-Commerce | |||
| Government | |||
| Manufacturing | |||
| Media and Entertainment | |||
| Telecom | |||
| Other End Users | |||
| By Hotspot | Ontario | ||
| Quebec | |||
| Rest of Canada | |||


Market Definition
- IT LOAD CAPACITY - The IT load capacity or installed capacity, refers to the amount of energy consumed by servers and network equipments placed in a rack installed. It is measured in megawatt (MW).
- ABSORPTION RATE - It denotes the extend to which the data center capacity has been leased out. For instance, a 100 MW DC has leased out 75 MW, then absorption rate would be 75%. It is also referred as utilization rate and leased-out capacity.
- RAISED FLOOR SPACE - It is an elevated space build over the floor. This gap between the original floor and the elevated floor is used to accommodate wiring, cooling, and other data center equipment. This arrangement assist in having proper wiring and cooling infrastructure. It is measured in square feet (ft^2).
- DATA CENTER SIZE - Data Center Size is segmented based on the raised floor space allocated to the data center facilities. Mega DC - # of Racks must be more than 9000 or RFS (raised floor space) must be more than 225001 Sq. ft; Massive DC - # of Racks must be in between 9000 and 3001 or RFS must be in between 225000 Sq. ft and 75001 Sq. ft; Large DC - # of Racks must be in between 3000 and 801 or RFS must be in between 75000 Sq. ft and 20001 Sq. ft; Medium DC # of Racks must be in between 800 and 201 or RFS must be in between 20000 Sq. ft and 5001 Sq. ft; Small DC - # of Racks must be less than 200 or RFS must be less than 5000 Sq. ft.
- TIER TYPE - According to Uptime Institute the data centers are classified into four tiers based on the proficiencies of redundant equipment of the data center infrastructure. In this segment the data center are segmented as Tier 1,Tier 2, Tier 3 and Tier 4.
- COLOCATION TYPE - The segment is segregated into 3 categories namely Retail, Wholesale and Hyperscale Colocation service. The categorization is done based on the amount of IT load leased out to potential customers. Retail colocation service has leased capacity less than 250 kW; Wholesale colocation services has leased capacity between 251 kW and 4 MW and Hyperscale colocation services has leased capacity more than 4 MW.
- END CONSUMERS - The Data Center Market operates on a B2B basis. BFSI, Government, Cloud Operators, Media and Entertainment, E-Commerce, Telecom and Manufacturing are the major end-consumers in the market studied. The scope only includes colocation service operators catering to the increasing digitalization of the end-user industries.
| Keyword | Definition |
|---|---|
| Rack Unit | Generally referred as U or RU, it is the unit of measurement for the server unit housed in the racks in the data center. 1U is equal to 1.75 inches. |
| Rack Density | It defines the amount of power consumed by the equipment and server housed in a rack. It is measured in kilowatt (kW). This factor plays a critical role in data center design and, cooling and power planning. |
| IT Load Capacity | The IT load capacity or installed capacity, refers to the amount of energy consumed by servers and network equipment placed in a rack installed. It is measured in megawatt (MW). |
| Absorption Rate | It denotes how much of the data center capacity has been leased out. For instance, if a 100 MW DC has leased out 75 MW, then the absorption rate would be 75%. It is also referred to as utilization rate and leased-out capacity. |
| Raised Floor Space | It is an elevated space built over the floor. This gap between the original floor and the elevated floor is used to accommodate wiring, cooling, and other data center equipment. This arrangement assists in having proper wiring and cooling infrastructure. It is measured in square feet/meter. |
| Computer Room Air Conditioner (CRAC) | It is a device used to monitor and maintain the temperature, air circulation, and humidity inside the server room in the data center. |
| Aisle | It is the open space between the rows of racks. This open space is critical for maintaining the optimal temperature (20-25 °C) in the server room. There are primarily two aisles inside the server room, a hot aisle and a cold aisle. |
| Cold Aisle | It is the aisle wherein the front of the rack faces the aisle. Here, chilled air is directed into the aisle so that it can enter the front of the racks and maintain the temperature. |
| Hot Aisle | It is the aisle where the back of the racks faces the aisle. Here, the heat dissipated from the equipment’s in the rack is directed to the outlet vent of the CRAC. |
| Critical Load | It includes the servers and other computer equipment whose uptime is critical for data center operation. |
| Power Usage Effectiveness (PUE) | It is a metric which defines the efficiency of a data center. It is calculated by: (𝑇𝑜𝑡𝑎𝑙 𝐷𝑎𝑡𝑎 𝐶𝑒𝑛𝑡𝑒𝑟 𝐸𝑛𝑒𝑟𝑔𝑦 𝐶𝑜𝑛𝑠𝑢𝑚𝑝𝑡𝑖𝑜𝑛)/(𝑇𝑜𝑡𝑎𝑙 𝐼𝑇 𝐸𝑞𝑢𝑖𝑝𝑚𝑒𝑛𝑡 𝐸𝑛𝑒𝑟𝑔𝑦 𝐶𝑜𝑛𝑠𝑢𝑚𝑝𝑡𝑖𝑜𝑛). Further, a data center with a PUE of 1.2-1.5 is considered highly efficient, whereas, a data center with a PUE >2 is considered highly inefficient. |
| Redundancy | It is defined as a system design wherein additional component (UPS, generators, CRAC) is added so that in case of power outage, equipment failure, the IT equipment should not be affected. |
| Uninterruptible Power Supply (UPS) | It is a device that is connected in series with the utility power supply, storing energy in batteries such that the supply from UPS is continuous to IT equipment even during utility power is snapped. The UPS primarily supports the IT equipment only. |
| Generators | Just like UPS, generators are placed in the data center to ensure an uninterrupted power supply, avoiding downtime. Data center facilities have diesel generators and commonly, 48-hour diesel is stored in the facility to prevent disruption. |
| N | It denotes the tools and equipment required for a data center to function at full load. Only "N" indicates that there is no backup to the equipment in the event of any failure. |
| N+1 | Referred to as 'Need plus one', it denotes the additional equipment setup available to avoid downtime in case of failure. A data center is considered N+1 when there is one additional unit for every 4 components. For instance, if a data center has 4 UPS systems, then for to achieve N+1, an additional UPS system would be required. |
| 2N | It refers to fully redundant design wherein two independent power distribution system is deployed. Therefore, in the event of a complete failure of one distribution system, the other system will still supply power to the data center. |
| In-Row Cooling | It is the cooling design system installed between racks in a row where it draws warm air from the hot aisle and supplies cool air to the cold aisle, thereby maintaining the temperature. |
| Tier 1 | Tier classification determines the preparedness of a data center facility to sustain data center operation. A data center is classified as Tier 1 data center when it has a non-redundant (N) power component (UPS, generators), cooling components, and power distribution system (from utility power grids). The Tier 1 data center has an uptime of 99.67% and an annual downtime of <28.8 hours. |
| Tier 2 | A data center is classified as Tier 2 data center when it has a redundant power and cooling components (N+1) and a single non-redundant distribution system. Redundant components include extra generators, UPS, chillers, heat rejection equipment, and fuel tanks. The Tier 2 data center has an uptime of 99.74% and an annual downtime of <22 hours. |
| Tier 3 | A data center having redundant power and cooling components and multiple power distribution systems is referred to as a Tier 3 data center. The facility is resistant to planned (facility maintenance) and unplanned (power outage, cooling failure) disruption. The Tier 3 data center has an uptime of 99.98% and an annual downtime of <1.6 hours. |
| Tier 4 | It is the most tolerant type of data center. A Tier 4 data center has multiple, independent redundant power and cooling components and multiple power distribution paths. All IT equipment are dual powered, making them fault tolerant in case of any disruption, thereby ensuring interrupted operation. The Tier 4 data center has an uptime of 99.74% and an annual downtime of <26.3 minutes. |
| Small Data Center | Data center that has floor space area of ≤ 5,000 Sq. ft or the number of racks that can be installed is ≤ 200 is classified as a small data center. |
| Medium Data Center | Data center which has floor space area between 5,001-20,000 Sq. ft, or the number of racks that can be installed is between 201-800, is classified as a medium data center. |
| Large Data Center | Data center which has floor space area between 20,001-75,000 Sq. ft, or the number of racks that can be installed is between 801-3,000, is classified as a large data center. |
| Massive Data Center | Data center which has floor space area between 75,001-225,000 Sq. ft, or the number of racks that can be installed is between 3001-9,000, is classified as a massive data center. |
| Mega Data Center | Data center that has a floor space area of ≥ 225,001 Sq. ft or the number of racks that can be installed is ≥ 9001 is classified as a mega data center. |
| Retail Colocation | It refers to those customers who have a capacity requirement of 250 kW or less. These services are majorly opted by small and medium enterprises (SMEs). |
| Wholesale Colocation | It refers to those customers who have a capacity requirement between 250 kW to 4 MW. These services are majorly opted by medium to large enterprises. |
| Hyperscale Colocation | It refers to those customers who have a capacity requirement greater than 4 MW. The hyperscale demand primarily originates from large-scale cloud players, IT companies, BFSI, and OTT players (like Netflix, Hulu, and HBO+). |
| Mobile Data Speed | It is the mobile internet speed a user experiences via their smartphones. This speed is primarily dependent on the carrier technology being used in the smartphone. The carrier technologies available in the market are 2G, 3G, 4G, and 5G, where 2G provides the slowest speed while 5G is the fastest. |
| Fiber Connectivity Network | It is a network of optical fiber cables deployed across the country, connecting rural and urban regions with high-speed internet connection. It is measured in kilometer (km). |
| Data Traffic per Smartphone | It is a measure of average data consumption by a smartphone user in a month. It is measured in gigabyte (GB). |
| Broadband Data Speed | It is the internet speed that is supplied over the fixed cable connection. Commonly, copper cable and optic fiber cable are used in both residential and commercial use. Here, optic cable fiber provides faster internet speed than copper cable. |
| Submarine Cable | A submarine cable is a fiber optic cable laid down at two or more landing points. Through this cable, communication and internet connectivity between countries across the globe is established. These cables can transmit 100-200 terabits per second (Tbps) from one point to another. |
| Carbon Footprint | It is the measure of carbon dioxide generated during the regular operation of a data center. Since, coal, and oil & gas are the primary source of power generation, consumption of this power contributes to carbon emissions. Data center operators are incorporating renewable energy sources to curb the carbon footprint emerging in their facilities. |


Research Methodology
Mordor Intelligence follows a four-step methodology in all our reports.
- Step-1: Identify Key Variables: In order to build a robust forecasting methodology, the variables and factors identified in Step-1 are tested against available historical market numbers. Through an iterative process, the variables required for market forecast are set and the model is built on the basis of these variables.
- Step-2: Build a Market Model: Market-size estimations for the forecast years are in nominal terms. Inflation is not a part of the pricing, and the average selling price (ASP) is kept constant throughout the forecast period for each country.
- Step-3: Validate and Finalize: In this important step, all market numbers, variables and analyst calls are validated through an extensive network of primary research experts from the market studied. The respondents are selected across levels and functions to generate a holistic picture of the market studied.
- Step-4: Research Outputs: Syndicated Reports, Custom Consulting Assignments, Databases & Subscription Platforms


