Market Overview
| Study Period | 2020 - 2031 |
|---|---|
| Forecast Data Period | 2026 - 2031 |
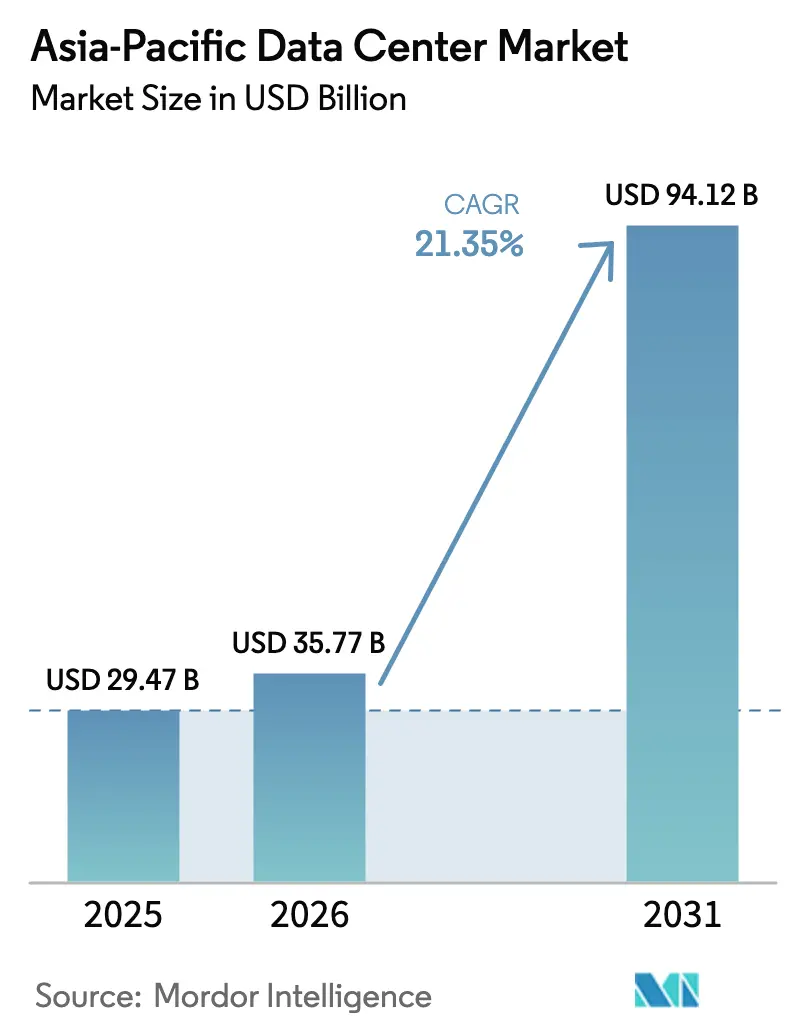
| Base Year Market Size (2025) | USD 29.47 Billion |
| Market Size (2026) | USD 35.77 Billion |
| Market Size (2031) | USD 94.12 Billion |
| Growth Rate (2026 - 2031) | 21.35% CAGR |
| Market Concentration | Medium |
Major Players
*Disclaimer: Major Players sorted in no particular order Image © Mordor Intelligence. Reuse requires attribution under CC BY 4.0. |
|
Asia-Pacific Data Center Market Analysis by Mordor Intelligence
Asia-Pacific Data Center Market size in 2026 is estimated at USD 35.77 billion, growing from 2025 value of USD 29.47 billion with 2031 projections showing USD 94.12 billion, growing at 21.35% CAGR over 2026-2031. In terms of installed base, the market is expected to grow from 29.31 thousand megawatt in 2025 to 63.11 thousand megawatt by 2030, at a CAGR of 16.57% during the forecast period (2025-2030). The market segment shares and estimates are calculated and reported in terms of MW. Rapid 5G roll-outs, AI/ML workload proliferation, and data-sovereignty regulations are doubling capacity in just five years, making the Asia Pacific Data Center market the world’s fastest-growing digital-infrastructure arena. Operators are racing to integrate liquid cooling, renewable-energy sourcing, and submarine-cable landing connectivity to satisfy power-dense workloads while meeting increasingly stringent efficiency mandates. China currently dominates with 34.58% share, yet India’s 20.50% CAGR signals a seismic rebalancing of demand toward South Asia. Colocation remains the prevailing service model, but the hyperscale self-build wave led by Chinese cloud giants is redrawing the competitive map as enterprises weigh cost, latency, and compliance trade-offs.
Key Report Takeaways
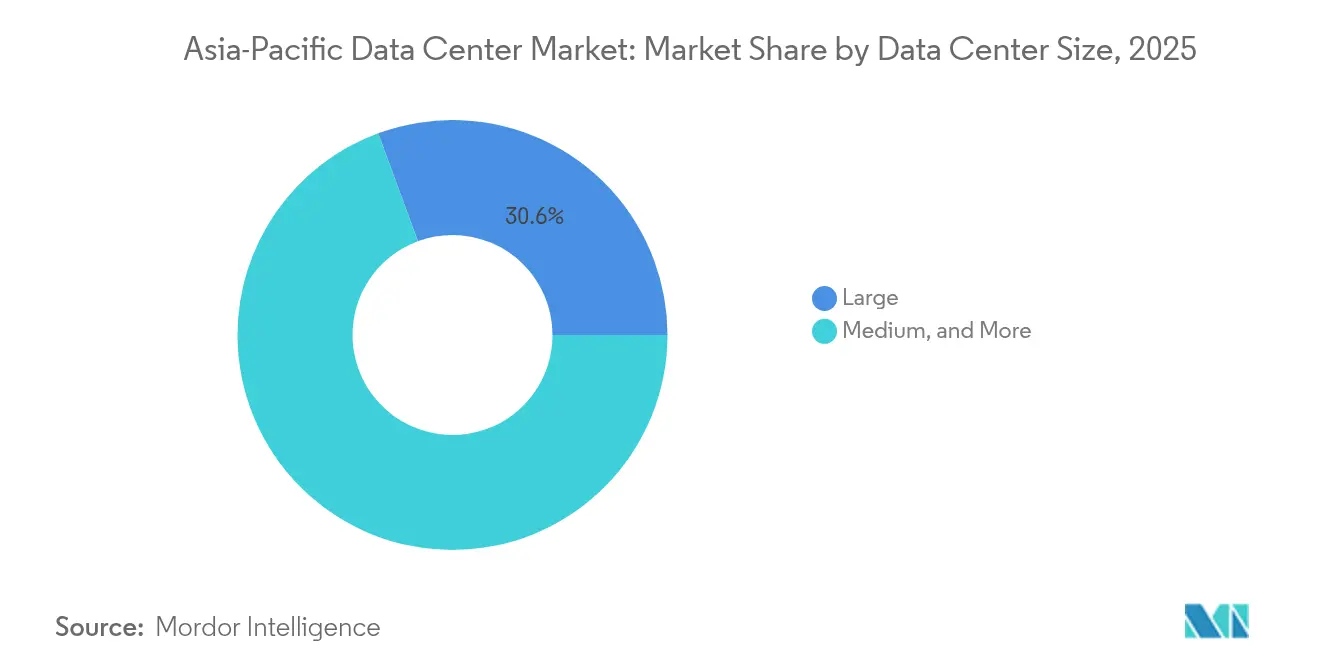
- By data center size, large-scale facilities commanded 30.62% share of the Asia-Pacific Data Center market size in 2025, while medium-scale sites are advancing at a 12.90% CAGR on the back of edge-computing demand.
- By tier type, tier 3 facilities captured 62.35% share of the Asia-Pacific Data Center market size in 2025 and are projected to grow at a 16.05% CAGR through 2031.
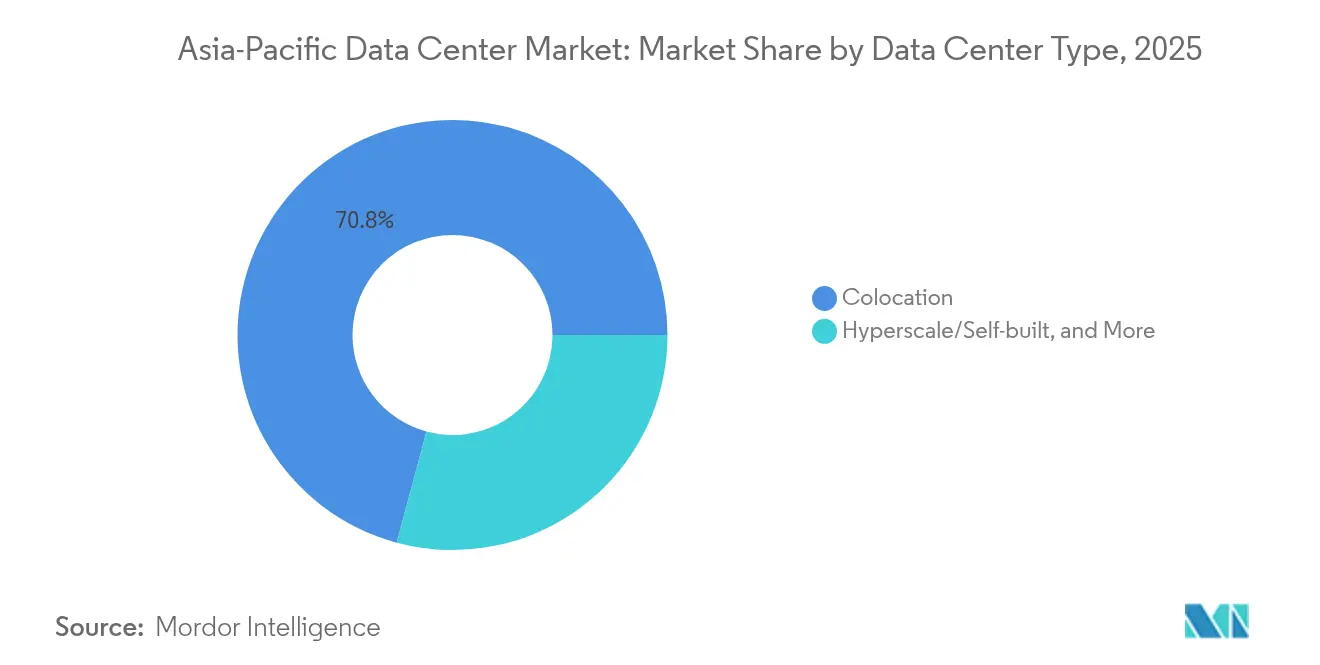
- By data center type, colocation held 70.82% of the Asia-Pacific Data Center market share in 2025; hyperscale/self-build deployments are forecast to post the fastest 16.95% CAGR through 2031.
- By end user, IT and Telecom represented 45.10% revenue share in 2025; BFSI is expected to record the highest 12.30% CAGR during the forecast window.
- By geography, China led with 34.10% Asia-Pacific Data Center market share in 2025, whereas India is on course for the quickest 19.95% CAGR to 2031.
Note: Market size and forecast figures in this report are generated using Mordor Intelligence’s proprietary estimation framework, updated with the latest available data and insights as of 2026.
Asia-Pacific Data Center Market Trends and Insights
Drivers Impact Analysis*
| Driver | (~) % Impact on CAGR Forecast | Geographic Relevance | Impact Timeline |
|---|---|---|---|
| Accelerating roll-out of 5G core networks | +3.20% | China, Japan, South Korea, Singapore | Medium term (2-4 years) |
| Rising hyperscale self-build investments by Chinese tech majors | +4.10% | China, Southeast Asia | Long term (≥ 4 years) |
| Government tax-holiday incentives for green data centers | +2.80% | Singapore, Malaysia, Thailand, India | Medium term (2-4 years) |
| Surging AI/ML workload demand for on-prem GPU clusters | +3.90% | Global Asia-Pacific, concentrated in China, Japan, India | Short term (≤ 2 years) |
| Rapid integration of submarine-cable landing stations with edge facilities | +1.70% | Australia, Singapore, Japan, Philippines | Long term (≥ 4 years) |
| Build-to-suit models preferred by sovereign wealth funds | +2.30% | Singapore, Australia, Malaysia | Medium term (2-4 years) |
| Source: Mordor Intelligence | |||


Accelerating Roll-out of 5G Core Networks
Widespread 5G adoption is reshaping workload-placement economics across the Asia Pacific Data Center market. China surpassed 3.38 million 5G base stations in 2024, each requiring sub-20 ms latency, thereby pushing operators to position medium-sized edge facilities nearer to population centers [1]Ministry of Industry and Information Technology, “China 5G Base Station Development 2024,” miit.gov.cn. In Japan, carriers injected JPY 1.2 trillion into 5G infrastructure during 2024 to enable ultra-low-latency applications across manufacturing and entertainment, catalyzing regional demand for distributed compute nodes. Singapore achieved 95% 5G coverage and stipulated local processing for critical services, a policy that accelerates new edge builds [2]Infocomm Media Development Authority, “Nationwide 5G Coverage Update 2024,” imda.gov.sg. The resulting traffic dispersion explains why medium facilities are growing faster than mega sites. For developers, network-backhaul partnerships and modular designs have emerged as key differentiators when courting telecom tenants.
Rising Hyperscale Self-build Investments by Chinese Tech Majors
Alibaba, Tencent, and ByteDance are redirecting cloud-infrastructure budgets toward in-house campuses to optimize costs and comply with localization rules. Alibaba earmarked USD 28 billion for new regional builds through 2027, allocating 60% to self-operated estates [3]Alibaba Group, “Annual Report 2024,” alibabagroup.com. ByteDance dedicated USD 7.2 billion to AI-ready designs that support large-language-model training, while Tencent invested USD 5.8 billion in liquid-cooled sites targeting Southeast Asian gamers. The surge is boosting the Asia Pacific Data Center market’s hyperscale segment yet intensifying pricing pressure on retail colocation. Incumbents are responding with deeper service portfolios-inter-cloud interconnects, managed GPU clusters, and compliance-as-a-service-to defend share.
Government Tax-holiday Incentives for Green Data Centers
Fiscal incentives are increasingly tied to sustainability metrics. Singapore offers 10-year tax holidays for facilities achieving PUE below 1.3 and supporting liquid cooling. Malaysia grants full income-tax exemption on green projects above MYR 200 million, spurring capacity along the Johor–Singapore corridor. Thailand’s eight-year corporate-tax relief for LEED Gold builds helped attract USD 2.1 billion in 2024 commitments. These policies tilt the Asia Pacific Data Center market toward operators capable of financing cutting-edge cooling and on-site renewables, giving large colocation players a scale advantage.
Surging AI/ML Workload Demand for On-prem GPU Clusters
GPU-dense racks are rewriting design baselines. NVIDIA’s regional revenue hit USD 18.4 billion in fiscal 2024 on 340% shipment growth, underscoring a swift pivot toward AI-optimized footprints. SoftBank’s 200 MW Hokkaido facility targets 100 kW-per-rack densities by employing direct liquid cooling. This high-power intensity accelerates the shift from legacy enterprise campuses to purpose-built hyperscale and colocation sites. Operators able to guarantee 30+ kW per cabinet and sub-1.3 PUE are commanding premium pricing, lifting returns despite rising energy tariffs.
Restraints Impact Analysis*
| Restraint | (~) % Impact on CAGR Forecast | Geographic Relevance | Impact Timeline |
|---|---|---|---|
| Prolonged grid connection approval cycles | -2.10% | India, Indonesia, Philippines, Vietnam | Medium term (2-4 years) |
| Pronounced water scarcity risk in Northern China | -1.80% | Northern China, parts of India | Long term (≥ 4 years) |
| High real-estate cost inflation in tier-one Asia-Pacific cities | -1.40% | Singapore, Hong Kong, Tokyo, Sydney | Short term (≤ 2 years) |
| Shortage of certified data center engineers | -1.90% | Global Asia-Pacific, acute in Southeast Asia | Medium term (2-4 years) |
| Source: Mordor Intelligence | |||
Prolonged Grid-Connection Approval Cycles
Connection delays extend project payback periods in high-growth markets. Indian approvals average 18–24 months as state boards scrutinize environmental impact and grid stability [4].Central Electricity Authority, “Grid Connection Guidelines 2024,” cea.nic.inIndonesia’s PLN imposes similar timelines for >10 MW loads, and the Philippines’ renewable-certificate mandate lengthens processing by up to a year. Developers shoulder idle-land costs and warehoused equipment depreciation, dampening IRRs and slowing the Asia Pacific Data Center market’s capacity ramp.
Shortage of Certified Data center Engineers
Asia-Pacific needs thousands of additional professionals to operate new plants. Singapore reported a 3,200-person skills gap in 2024 with salaries climbing 28%. Thailand launched a USD 15 million program to train 2,000 specialists by 2026. Rising labor premiums inflate opex and heighten operational-risk exposure for tier 3 and tier 4 sites, compelling operators to automate monitoring and adopt remote-hands services.
*Our forecasts treat driver/restraint impacts as directional, not additive. The impact forecasts reflect baseline growth, mix effects, and variable interactions.
Segment Analysis
By Data Center Size: Medium Facilities Drive Edge Computing Growth
Medium-scale sites posted 12.90% CAGR through 2031 as telecom and CDN providers prioritize 5- to 20-MW nodes for metro-edge traffic aggregation. Large campuses still hold 30.62% share of the Asia Pacific Data Center market size, favored by global cloud tenants for economies of scale. Massive (>100 MW) hubs function as regional cores supporting AI training, while small facilities serve niche enterprise or remote-area requirements. As 5G densification continues, decentralized architectures will keep propelling medium-site demand, even as mega-projects dominate capital deployed.
The Asia Pacific Data Center industry increasingly embraces a hub-and-spoke topology: massive hubs supply high-density compute, and medium satellites ensure latency compliance at the network edge. Power and land constraints in primary cities are prompting land-banking strategies in secondary metros such as Osaka, Hyderabad, and Johor Bahru. For investors, portfolio diversification across size classes reduces exposure to single-site utility bottlenecks.


By Tier Type: Tier 3 Dominance Reflects Cost-Performance Balance
Tier 3 captured 62.35% share of the Asia Pacific Data Center market size in 2025, offering the 99.982% uptime most enterprises deem sufficient without tier 4’s cost premium. Mandates from regulators like Singapore’s Monetary Authority require tier 3 minimums for financial data residency, cementing demand. Tier 1 and tier 2 attract dev-test workloads, while tier 4 stays confined to critical clearing-house systems and select government clouds.
Standardized tier 3 blueprints shorten permitting cycles and enable prefabricated component use, trimming build schedules by up to 20%. ISO 27001 alignment further streamlines certification. Consequently, tier 3 will likely widen its leadership as AI spurs higher rack densities yet operators remain cost-sensitive.
By Data Center Type: Colocation Leadership Faces Hyperscale Challenge
Colocation retained 70.82% Asia Pacific Data Center market share in 2025, buoyed by enterprises avoiding capex. Retail suites supplying <250 kW clients and wholesale halls for multi-MW tenants together underpin this dominance. Yet hyperscale self-build is clocking 16.95% CAGR as cloud majors seek custom power envelopes and security postures. Operators counter with value-adds-sovereign-cloud zones, managed Kubernetes, and sustainability dashboards-to lock renewals.
Enterprise/edge facilities provide compliance-driven, on-prem compute for BFSI and healthcare clients. Meanwhile, unused colo capacity is being carved into AI-ready modules to lift occupancy and defend yields. The Asia Pacific Data Center market thus pivots on a two-track model: hyperscale campuses for predictable mega-workloads and flexible colocation for diversified tenant rosters.
By End User: IT and Telecom Leadership Challenged by BFSI Growth
IT and Telecom supplied 45.10% demand in 2025, leveraging facilities for CDN, OTT streaming, and 5G core hosting. BFSI, however, heads the growth table at 12.30% CAGR, propelled by real-time payments and open-banking APIs that require ultra-low latency and domestic data residency. Manufacturing, fueled by Industry 4.0 analytics, and e-commerce platforms also scale consumption but at mid-single-digit rates.
Digital-banking pioneers like DBS expanded multi-region capacity to satisfy both customer-experience targets and regulator audits. Telecom operators also double as data center landlords, cross-selling cloud and private-network services. This blurring of vertical lines is reshaping sales cycles and demanding multi-disciplinary support teams within facilities.
Geography Analysis
China commands 34.10% share, anchored by USD 41 billion 2024 capex from Alibaba, Tencent, and ByteDance. National regulations capping PUE at 1.4 for new builds force modernization, stimulating uptake of liquid cooling and direct-current architectures. Northern-China water scarcity is steering projects toward coastal or hydro-rich provinces, pushing secondary-city growth.
India’s 19.95% CAGR owes much to Digital India, infrastructure-status financing, and single-window approvals. Equinix’s USD 200 million Chennai launch targets BFSI and manufacturing tenants needing sub-50 ms pan-India round trips. Japan, Australia, and Singapore round out the mature triad-each with stable rules but unique constraints in land or power-while Indonesia, Malaysia, and Thailand emerge as next-wave hotspots tied to submarine-cable routes and sovereign-cloud policies.
Japan combines government AI-supercomputer subsidies worth JPY 72.5 billion with utilities offering renewable-energy PPAs, making Hokkaido and Kyushu attractive for GPU farms. Australia’s Sydney-Melbourne core benefits from enterprise headquarters traffic, but Perth and Adelaide are carving out disaster-recovery niches linked via new west-to-east optical spines.
Singapore’s gateway status persists despite land scarcity. The Green DC Roadmap’s new PUE and carbon caps encourage taller, more efficient high-rise designs and offshore floating-platform pilots. Across Southeast Asia, Indonesia’s Golden Indonesia 2045 blueprint and Malaysia’s Digital Economy Masterplan channel FDI into Batam, Johor, and Greater Jakarta clusters. Vietnam and the Philippines trail but display double-digit pipeline growth aligned with ecommerce expansion.
Competitive Landscape
The Asia Pacific Data Center market shows moderate concentration. Global platforms such as Equinix, Digital Realty, and NTT leverage balance-sheet heft to pre-secure power and dark fiber in multiple jurisdictions. Regional specialists like AirTrunk, STT GDC, and NEXTDC capture white-space by tailoring builds to local permitting nuances and renewable-energy availability.
Blackstone’s AUD 24 billion purchase of AirTrunk in September 2024 exemplifies infrastructure-fund appetite for cash-flow-stable assets. JV structures-Digital Realty with Indonesia’s Mitratel, NTT with Microsoft Azure in Japan-pair capital with tenant pipelines, reducing ramp-up risk. Technology roadmaps focus on immersion and rear-door liquid cooling, on-site battery energy storage, and AI-ops for predictive maintenance. Patent-filing data shows Japanese firms leading PUE-reduction IP while Chinese clouds dominate AI-optimized rack design.
Medium-term, competitive intensity will hinge on renewables access and sub-5 ms latency footprints rather than sheer megawatt scale. Operators incapable of meeting enterprise ESG targets risk stranded capacity, whereas those integrating sustainability certifications into service-level agreements secure pricing power.
Asia-Pacific Data Center Industry Leaders
-
Amazon Web Services, Inc
-
Equinix, Inc.
-
Huawei Cloud Computing Technologies Co., Ltd
-
Digital Realty Trust Inc.
-
Beijing VNET Broadband Data Center Co., Ltd
- *Disclaimer: Major Players sorted in no particular order


Recent Industry Developments
- September 2024: Blackstone finalized the AirTrunk acquisition for AUD 24 billion (USD 16.1 billion), unlocking expansion capital for India and Indonesia.
- August 2024: Digital Realty and Mitratel launched a USD 500 million JV to build hyperscale parks in Jakarta and Surabaya.
- July 2024: Vantage Data Centers arranged USD 1.6 billion to fund 400 MW across India, Japan, and Australia.
- June 2024: STT GDC inaugurated Singapore’s first AI-ready facility rated for 100 kW per rack.
- May 2024: NEXTDC purchased the Sydney S7 site for AUD 353 million, adding 50 MW capacity.


Asia-Pacific Data Center Market Report Scope
Large, Massive, Medium, Mega, Small are covered as segments by Data Center Size. Tier 1 and 2, Tier 3, Tier 4 are covered as segments by Tier Type. Non-Utilized, Utilized are covered as segments by Absorption. Australia, China, India, Indonesia, Japan, Malaysia are covered as segments by Country.
By Data Center Size
| Large |
| Massive |
| Medium |
| Mega |
| Small |
By Tier Type
| Tier 1 and 2 |
| Tier 3 |
| Tier 4 |
By Data Center Type
| Hyperscale/Self-built | ||
| Enterprise/Edge | ||
| Colocation | Non-Utilized | |
| Utilized | Retail Colocation | |
| Wholesale Colocation | ||
By End User
| BFSI |
| IT and ITES |
| E-Commerce |
| Government |
| Manufacturing |
| Media and Entertainment |
| Telecom |
| Other End Users |
By Country
| China |
| Japan |
| India |
| Indonesia |
| Australia |
| Singapore |
| New Zealand |
| Malaysia |
| Thailand |
| Rest of Asia Pacific |
| By Data Center Size | Large | ||
| Massive | |||
| Medium | |||
| Mega | |||
| Small | |||
| By Tier Type | Tier 1 and 2 | ||
| Tier 3 | |||
| Tier 4 | |||
| By Data Center Type | Hyperscale/Self-built | ||
| Enterprise/Edge | |||
| Colocation | Non-Utilized | ||
| Utilized | Retail Colocation | ||
| Wholesale Colocation | |||
| By End User | BFSI | ||
| IT and ITES | |||
| E-Commerce | |||
| Government | |||
| Manufacturing | |||
| Media and Entertainment | |||
| Telecom | |||
| Other End Users | |||
| By Country | China | ||
| Japan | |||
| India | |||
| Indonesia | |||
| Australia | |||
| Singapore | |||
| New Zealand | |||
| Malaysia | |||
| Thailand | |||
| Rest of Asia Pacific | |||


Market Definition
- IT LOAD CAPACITY - The IT load capacity or installed capacity, refers to the amount of energy consumed by servers and network equipments placed in a rack installed. It is measured in megawatt (MW).
- ABSORPTION RATE - It denotes the extend to which the data center capacity has been leased out. For instance, a 100 MW DC has leased out 75 MW, then absorption rate would be 75%. It is also referred as utilization rate and leased-out capacity.
- RAISED FLOOR SPACE - It is an elevated space build over the floor. This gap between the original floor and the elevated floor is used to accommodate wiring, cooling, and other data center equipment. This arrangement assist in having proper wiring and cooling infrastructure. It is measured in square feet (ft^2).
- DATA CENTER SIZE - Data Center Size is segmented based on the raised floor space allocated to the data center facilities. Mega DC - # of Racks must be more than 9000 or RFS (raised floor space) must be more than 225001 Sq. ft; Massive DC - # of Racks must be in between 9000 and 3001 or RFS must be in between 225000 Sq. ft and 75001 Sq. ft; Large DC - # of Racks must be in between 3000 and 801 or RFS must be in between 75000 Sq. ft and 20001 Sq. ft; Medium DC # of Racks must be in between 800 and 201 or RFS must be in between 20000 Sq. ft and 5001 Sq. ft; Small DC - # of Racks must be less than 200 or RFS must be less than 5000 Sq. ft.
- TIER TYPE - According to Uptime Institute the data centers are classified into four tiers based on the proficiencies of redundant equipment of the data center infrastructure. In this segment the data center are segmented as Tier 1,Tier 2, Tier 3 and Tier 4.
- COLOCATION TYPE - The segment is segregated into 3 categories namely Retail, Wholesale and Hyperscale Colocation service. The categorization is done based on the amount of IT load leased out to potential customers. Retail colocation service has leased capacity less than 250 kW; Wholesale colocation services has leased capacity between 251 kW and 4 MW and Hyperscale colocation services has leased capacity more than 4 MW.
- END CONSUMERS - The Data Center Market operates on a B2B basis. BFSI, Government, Cloud Operators, Media and Entertainment, E-Commerce, Telecom and Manufacturing are the major end-consumers in the market studied. The scope only includes colocation service operators catering to the increasing digitalization of the end-user industries.
| Keyword | Definition |
|---|---|
| Rack Unit | Generally referred as U or RU, it is the unit of measurement for the server unit housed in the racks in the data center. 1U is equal to 1.75 inches. |
| Rack Density | It defines the amount of power consumed by the equipment and server housed in a rack. It is measured in kilowatt (kW). This factor plays a critical role in data center design and, cooling and power planning. |
| IT Load Capacity | The IT load capacity or installed capacity, refers to the amount of energy consumed by servers and network equipment placed in a rack installed. It is measured in megawatt (MW). |
| Absorption Rate | It denotes how much of the data center capacity has been leased out. For instance, if a 100 MW DC has leased out 75 MW, then the absorption rate would be 75%. It is also referred to as utilization rate and leased-out capacity. |
| Raised Floor Space | It is an elevated space built over the floor. This gap between the original floor and the elevated floor is used to accommodate wiring, cooling, and other data center equipment. This arrangement assists in having proper wiring and cooling infrastructure. It is measured in square feet/meter. |
| Computer Room Air Conditioner (CRAC) | It is a device used to monitor and maintain the temperature, air circulation, and humidity inside the server room in the data center. |
| Aisle | It is the open space between the rows of racks. This open space is critical for maintaining the optimal temperature (20-25 °C) in the server room. There are primarily two aisles inside the server room, a hot aisle and a cold aisle. |
| Cold Aisle | It is the aisle wherein the front of the rack faces the aisle. Here, chilled air is directed into the aisle so that it can enter the front of the racks and maintain the temperature. |
| Hot Aisle | It is the aisle where the back of the racks faces the aisle. Here, the heat dissipated from the equipment’s in the rack is directed to the outlet vent of the CRAC. |
| Critical Load | It includes the servers and other computer equipment whose uptime is critical for data center operation. |
| Power Usage Effectiveness (PUE) | It is a metric which defines the efficiency of a data center. It is calculated by: (𝑇𝑜𝑡𝑎𝑙 𝐷𝑎𝑡𝑎 𝐶𝑒𝑛𝑡𝑒𝑟 𝐸𝑛𝑒𝑟𝑔𝑦 𝐶𝑜𝑛𝑠𝑢𝑚𝑝𝑡𝑖𝑜𝑛)/(𝑇𝑜𝑡𝑎𝑙 𝐼𝑇 𝐸𝑞𝑢𝑖𝑝𝑚𝑒𝑛𝑡 𝐸𝑛𝑒𝑟𝑔𝑦 𝐶𝑜𝑛𝑠𝑢𝑚𝑝𝑡𝑖𝑜𝑛). Further, a data center with a PUE of 1.2-1.5 is considered highly efficient, whereas, a data center with a PUE >2 is considered highly inefficient. |
| Redundancy | It is defined as a system design wherein additional component (UPS, generators, CRAC) is added so that in case of power outage, equipment failure, the IT equipment should not be affected. |
| Uninterruptible Power Supply (UPS) | It is a device that is connected in series with the utility power supply, storing energy in batteries such that the supply from UPS is continuous to IT equipment even during utility power is snapped. The UPS primarily supports the IT equipment only. |
| Generators | Just like UPS, generators are placed in the data center to ensure an uninterrupted power supply, avoiding downtime. Data center facilities have diesel generators and commonly, 48-hour diesel is stored in the facility to prevent disruption. |
| N | It denotes the tools and equipment required for a data center to function at full load. Only "N" indicates that there is no backup to the equipment in the event of any failure. |
| N+1 | Referred to as 'Need plus one', it denotes the additional equipment setup available to avoid downtime in case of failure. A data center is considered N+1 when there is one additional unit for every 4 components. For instance, if a data center has 4 UPS systems, then for to achieve N+1, an additional UPS system would be required. |
| 2N | It refers to fully redundant design wherein two independent power distribution system is deployed. Therefore, in the event of a complete failure of one distribution system, the other system will still supply power to the data center. |
| In-Row Cooling | It is the cooling design system installed between racks in a row where it draws warm air from the hot aisle and supplies cool air to the cold aisle, thereby maintaining the temperature. |
| Tier 1 | Tier classification determines the preparedness of a data center facility to sustain data center operation. A data center is classified as Tier 1 data center when it has a non-redundant (N) power component (UPS, generators), cooling components, and power distribution system (from utility power grids). The Tier 1 data center has an uptime of 99.67% and an annual downtime of <28.8 hours. |
| Tier 2 | A data center is classified as Tier 2 data center when it has a redundant power and cooling components (N+1) and a single non-redundant distribution system. Redundant components include extra generators, UPS, chillers, heat rejection equipment, and fuel tanks. The Tier 2 data center has an uptime of 99.74% and an annual downtime of <22 hours. |
| Tier 3 | A data center having redundant power and cooling components and multiple power distribution systems is referred to as a Tier 3 data center. The facility is resistant to planned (facility maintenance) and unplanned (power outage, cooling failure) disruption. The Tier 3 data center has an uptime of 99.98% and an annual downtime of <1.6 hours. |
| Tier 4 | It is the most tolerant type of data center. A Tier 4 data center has multiple, independent redundant power and cooling components and multiple power distribution paths. All IT equipment are dual powered, making them fault tolerant in case of any disruption, thereby ensuring interrupted operation. The Tier 4 data center has an uptime of 99.74% and an annual downtime of <26.3 minutes. |
| Small Data Center | Data center that has floor space area of ≤ 5,000 Sq. ft or the number of racks that can be installed is ≤ 200 is classified as a small data center. |
| Medium Data Center | Data center which has floor space area between 5,001-20,000 Sq. ft, or the number of racks that can be installed is between 201-800, is classified as a medium data center. |
| Large Data Center | Data center which has floor space area between 20,001-75,000 Sq. ft, or the number of racks that can be installed is between 801-3,000, is classified as a large data center. |
| Massive Data Center | Data center which has floor space area between 75,001-225,000 Sq. ft, or the number of racks that can be installed is between 3001-9,000, is classified as a massive data center. |
| Mega Data Center | Data center that has a floor space area of ≥ 225,001 Sq. ft or the number of racks that can be installed is ≥ 9001 is classified as a mega data center. |
| Retail Colocation | It refers to those customers who have a capacity requirement of 250 kW or less. These services are majorly opted by small and medium enterprises (SMEs). |
| Wholesale Colocation | It refers to those customers who have a capacity requirement between 250 kW to 4 MW. These services are majorly opted by medium to large enterprises. |
| Hyperscale Colocation | It refers to those customers who have a capacity requirement greater than 4 MW. The hyperscale demand primarily originates from large-scale cloud players, IT companies, BFSI, and OTT players (like Netflix, Hulu, and HBO+). |
| Mobile Data Speed | It is the mobile internet speed a user experiences via their smartphones. This speed is primarily dependent on the carrier technology being used in the smartphone. The carrier technologies available in the market are 2G, 3G, 4G, and 5G, where 2G provides the slowest speed while 5G is the fastest. |
| Fiber Connectivity Network | It is a network of optical fiber cables deployed across the country, connecting rural and urban regions with high-speed internet connection. It is measured in kilometer (km). |
| Data Traffic per Smartphone | It is a measure of average data consumption by a smartphone user in a month. It is measured in gigabyte (GB). |
| Broadband Data Speed | It is the internet speed that is supplied over the fixed cable connection. Commonly, copper cable and optic fiber cable are used in both residential and commercial use. Here, optic cable fiber provides faster internet speed than copper cable. |
| Submarine Cable | A submarine cable is a fiber optic cable laid down at two or more landing points. Through this cable, communication and internet connectivity between countries across the globe is established. These cables can transmit 100-200 terabits per second (Tbps) from one point to another. |
| Carbon Footprint | It is the measure of carbon dioxide generated during the regular operation of a data center. Since, coal, and oil & gas are the primary source of power generation, consumption of this power contributes to carbon emissions. Data center operators are incorporating renewable energy sources to curb the carbon footprint emerging in their facilities. |


Research Methodology
Mordor Intelligence follows a four-step methodology in all our reports.
- Step-1: Identify Key Variables: In order to build a robust forecasting methodology, the variables and factors identified in Step-1 are tested against available historical market numbers. Through an iterative process, the variables required for market forecast are set and the model is built on the basis of these variables.
- Step-2: Build a Market Model: Market-size estimations for the forecast years are in nominal terms. Inflation is not a part of the pricing, and the average selling price (ASP) is kept constant throughout the forecast period for each country.
- Step-3: Validate and Finalize: In this important step, all market numbers, variables and analyst calls are validated through an extensive network of primary research experts from the market studied. The respondents are selected across levels and functions to generate a holistic picture of the market studied.
- Step-4: Research Outputs: Syndicated Reports, Custom Consulting Assignments, Databases & Subscription Platforms


