
Cloud Computing Market Size and Share
Cloud Computing Market Analysis by Mordor Intelligence
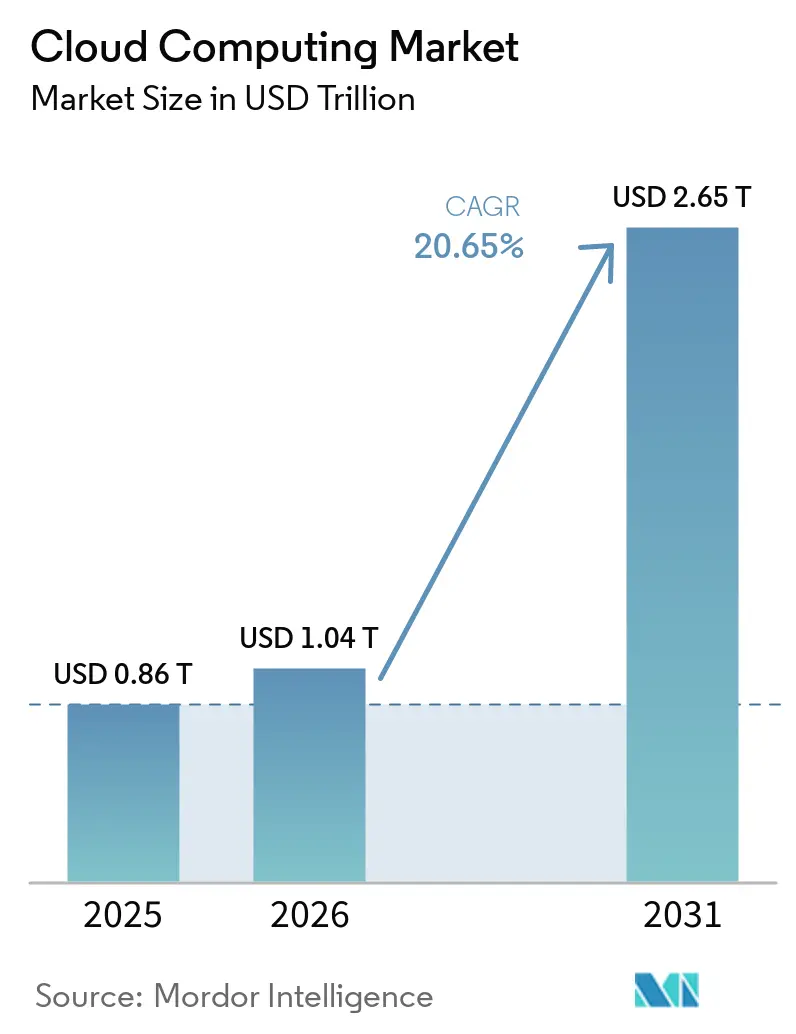
The cloud computing market size is estimated at USD 1.04 trillion in 2026 and is projected to be USD 1.25 trillion in 2027, reaching USD 3.16 trillion by 2032, growing at a CAGR of 20.35% from 2027 to 2032.
Business applications and AI services give suppliers complementary sources of cloud demand. Buyers choose between private, public and hybrid deployment according to how much control a workload requires and how predictable its bill must be. For telecom operations in Japan, hybrid cloud’s appeal lies in integrating external capacity with an operator’s own platform. Sovereign procurement also makes qualification valuable, placing supplier eligibility alongside technical capability in the commercial decision. Application depth and integration expertise support expansion, while budget overruns and localization requirements can postpone the workloads that would use additional capacity.
Key Report Takeaways
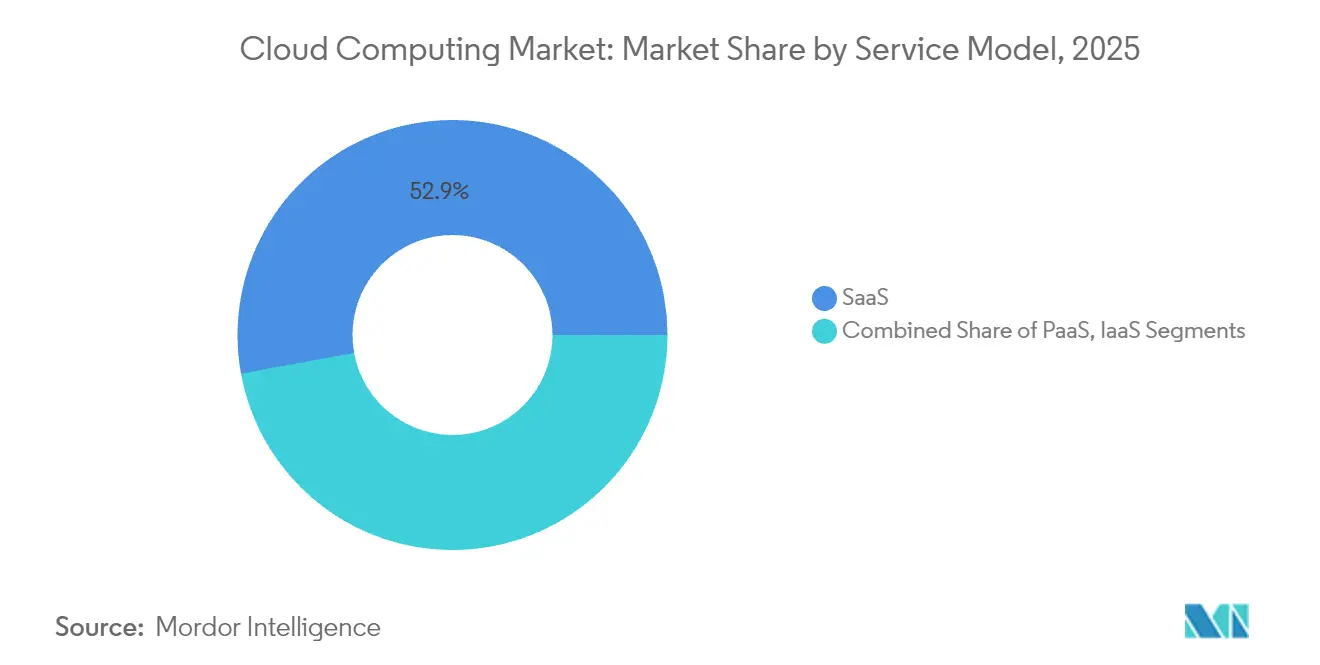
- By service model, SaaS held a 52.63% cloud computing market share in 2026, while PaaS is forecast to be the fastest-growing segment at a 22.55% CAGR from 2027 to 2032.
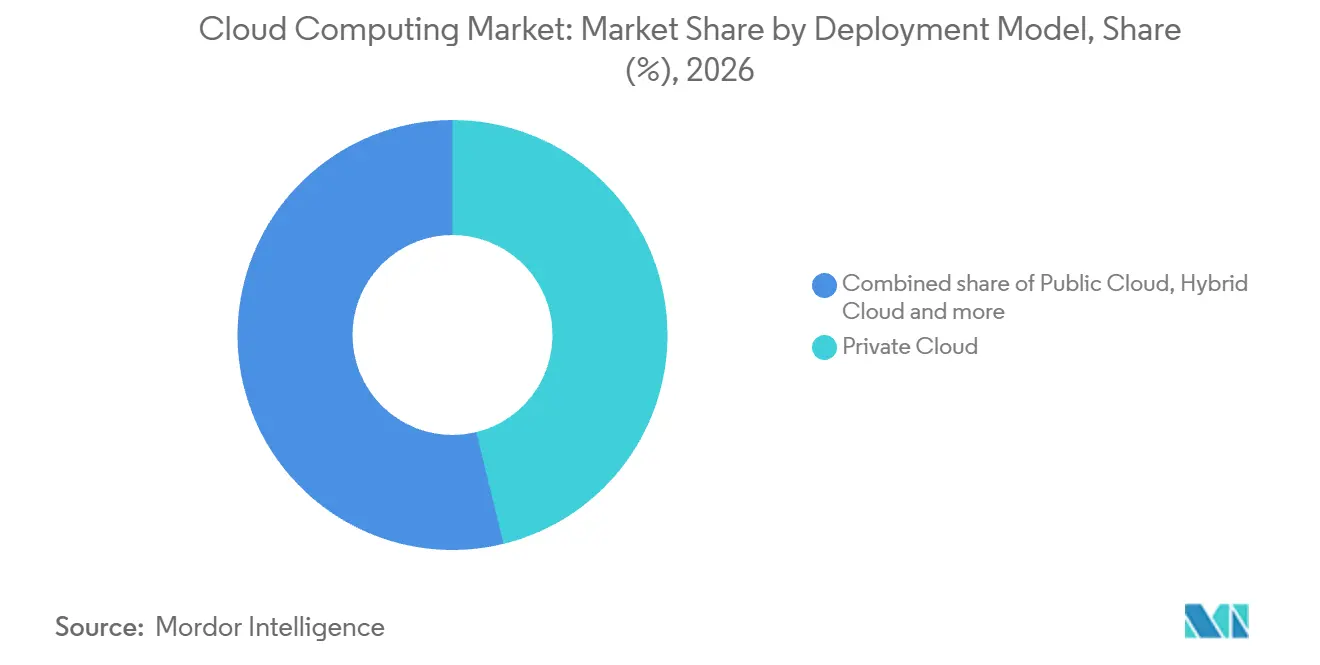
- Private cloud led deployment models with a 46.18% share of the cloud computing market size in 2026, and hybrid cloud is forecast to grow fastest at a 21.95% CAGR from 2027 to 2032.
- Among end-user verticals, BFSI led with a 27.39% share of cloud-service revenue in 2026, while the healthcare and life sciences segment is forecast to grow fastest at a 20.7% CAGR from 2027 to 2032.
- Across organization sizes, large enterprises led with 52.87% of cloud-service revenue in 2026, whereas small and mid-sized enterprises are forecast to grow fastest at a 21% CAGR from 2027 to 2032.
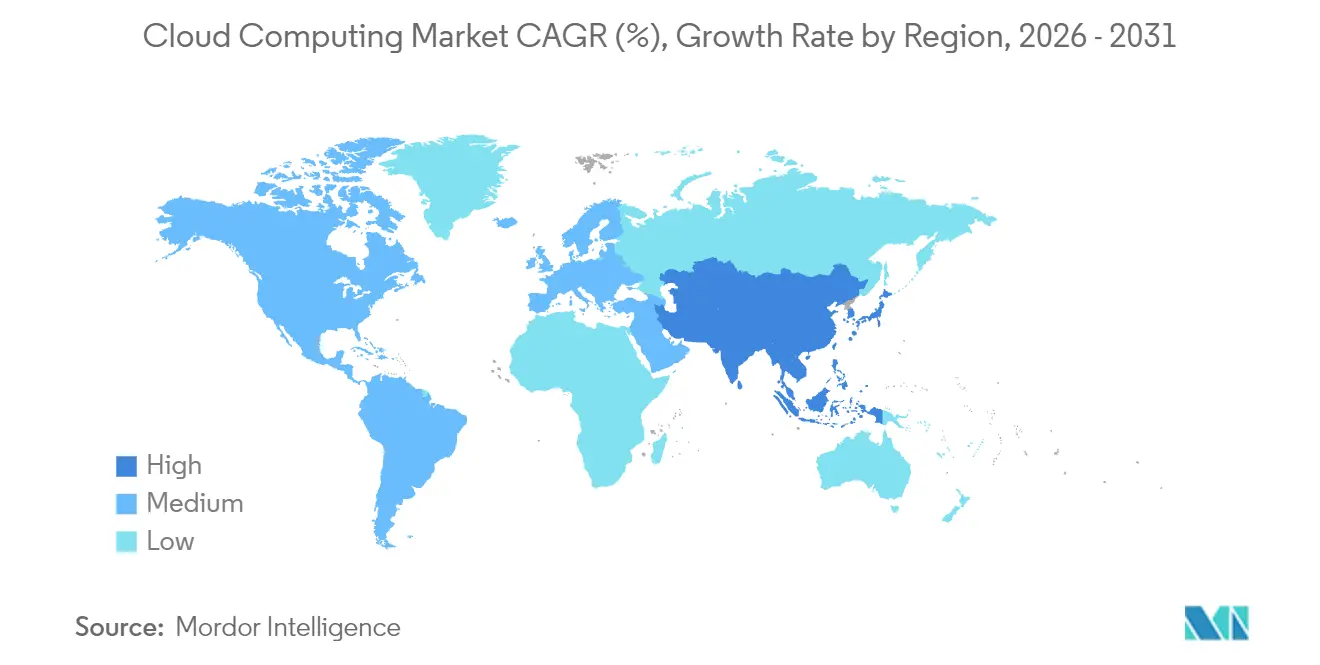
- North America was the leading geography with a 24.05% share of cloud-service revenue in 2026, while Asia-Pacific is forecast to grow fastest at a 21.4% CAGR from 2027 to 2032.
Note: Market numbers in this report are based on Mordor Intelligence's proprietary estimation framework, which combines nine months of actuals with Q4 projections for base year 2026.
Market Trends and Insights
Drivers Impact Analysis of Cloud Computing Market*
| Driver | (~) % Impact on CAGR Forecast | Geographic Relevance | Impact Timeline |
|---|---|---|---|
| Explosive SaaS adoption in core enterprise software | +7% | The European Union | Short term (≤ 2 years) |
| Proliferation of Gen-AI workloads demanding elastic compute | +8% | North America, Europe and Asia-Pacific | Short term (≤ 2 years) |
| Industry-specific cloud platforms (compliance-ready blueprints) | +4.5% | United States and Canada | Medium term (2-4 years) |
| Sovereign-cloud procurement and regulatory initiatives in EU and GCC | +3.5% | European Union and Oman | Medium term (2-4 years) |
| Rise of edge-cloud zones for XR and autonomous ops | +1.5% | The United States | Medium term (2-4 years) |
| Green-cloud buying criteria tied to Scope-3 targets | +1% | The United Kingdom | Long term (≥ 4 years) |
| Source: Mordor Intelligence | |||
Explosive SaaS adoption in core enterprise software
Core business applications give cloud suppliers an expansion route inside an already substantial software customer base. In 2025, 96.44% of EU enterprises using paid cloud services purchased at least one SaaS service, including email, office, finance, accounting, ERP, CRM or security software. Within the same paid-cloud population, use of cloud enterprise resource planning applications rose from 25.89% in 2023 to 30.12% in 2025. Application vendors can pursue the gap between basic SaaS use and cloud ERP adoption by selling additional functions into customers already using hosted software.
Proliferation of Gen-AI workloads demanding elastic compute
Elastic delivery gives cloud suppliers a way to serve AI workloads whose capacity requirements change over time. AWS reported an annualized AI revenue run rate above USD 15 billion in Q1 2026. Microsoft Cloud revenue reached USD 59.3 billion in its fiscal fourth quarter ended June 2026, up 27% year over year, reflecting demand across Azure and first-party AI applications and services. For a buyer using variable capacity, additional service consumption can create supplier revenue without another fixed infrastructure purchase. AI-related demand creates revenue opportunities in both supplying compute capacity and delivering the applications that put it to use.
Industry-specific cloud platforms (compliance-ready blueprints)
For regulated healthcare operators in the United States and Canada, a cloud platform can combine application design with the controls needed for clinical use. Reusable controls reduce repeated design work when another workflow moves onto the same platform. Lower implementation effort changes the cost of adding a regulated application, separately from the price of computing capacity. This can make smaller workflows more practical to deliver through cloud services, widening the set of functions worth moving. The supplier’s sector expertise then has commercial value in preparing the next workflow for service, alongside the capacity consumed.
Sovereign-cloud procurement and regulatory initiatives in EU and GCC
Oman’s cloud-first procurement ties public-sector cloud demand to supplier eligibility as well as technical capability. Oman’s July 2026 Cloud-First Policy requires government entities, except security and military agencies, to prioritize cloud solutions.[1] Covered entities must contract only with providers holding valid authorization from the Telecommunications Regulatory Authority. The covered government entities must also ensure compliance with cybersecurity, data-protection and risk-management requirements. Because covered entities must prioritize cloud solutions and contract only with authorized providers, the policy directs the resulting procurement opportunity toward eligible suppliers.
Restraints Impact Analysis of Cloud Computing Market*
| Restraint | (~) % Impact on CAGR Forecast | Geographic Relevance | Impact Timeline |
|---|---|---|---|
| Data-localization laws fragmenting global footprints | -2% | The European Union | Long term (≥ 4 years) |
| Run-rate cost overruns vs on-prem TCO | -1.5% | North America, Europe and Asia-Pacific | Short term (≤ 2 years) |
| Advanced chip export controls limiting GPU supply | -1% | China and other countries | Short term (≤ 2 years) |
| Scarcity of low-carbon power for hyperscale DCs | -0.5% | The Republic of Ireland | Long term (≥ 4 years) |
| Source: Mordor Intelligence | |||
Data-localization laws fragmenting global footprints
A geographically broad cloud service becomes harder to scale when residency requirements constrain the locations from which it can operate. In its 2025 annual report, Akamai said localization and residency rules in certain jurisdictions could reduce its addressable market, raise costs and complexity, and lengthen sales cycles. For a provider facing those risks, a larger geographic footprint cannot automatically translate into a larger pool of serviceable customers. Additional compliance complexity can absorb resources before a contract generates revenue, weakening the economics of entering a smaller jurisdiction.
Run-rate cost overruns vs on-prem TCO
Uncertain running costs can make another workload harder to approve even when cloud services meet the buyer’s operating needs. In Flexera’s 2026 global survey, 17% of respondents reported exceeding their public cloud budgets in the past year. A project can meet its operating purpose and still leave further expansion exposed to review of the gap between expected and actual costs, delaying account growth for the provider.
*Our forecasts treat driver/restraint impacts as directional, not additive. The impact forecasts reflect baseline growth, mix effects, and variable interactions.
Cloud Computing Market Segment Analysis
By Service Model:
Application Relationships Anchor RevenueSaaS accounted for a 52.63% share of the cloud computing market size in 2026, making it the largest segment. Salesforce’s subscription and support revenue grew 10% to USD 39.4 billion in its fiscal year ended January 31, 2026.[2] The category primarily comprised enterprise cloud-service fees and included support, updates and term software licenses, with term licenses representing approximately 6%. Salesforce attributed the increase mainly to new customers, upgrades and added subscriptions, with pricing not a significant driver, linking its revenue growth to sales volume rather than higher prices.
PaaS is forecast to be the fastest-growing segment, with a 22.55% CAGR from 2027 to 2032. Tuya reported PaaS revenue of USD 67.9 million in Q2 2026, up 16.9% year over year. It attributed the increase primarily to higher demand, customer focus and product enhancements, despite tariff-related headwinds since April 2025. Its 318 premium PaaS customers in the 12 months ended June 30, 2026, each contributed more than USD 100,000 of PaaS revenue. Premium customers contributed approximately 89.5% of Tuya’s Q2 2026 PaaS revenue, making retention of this cohort commercially important alongside new customer acquisition.

By Deployment Model:
Selective Relocation Sustains Private InfrastructurePrivate cloud represented a 46.18% cloud computing market share in 2026, making it the largest segment. Broadcom’s 2026 survey covered 1,800 senior IT decision-makers at organizations with at least 1,000 employees across 8 countries, with 600 participants each from North America, Europe, and Asia-Pacific and Japan. It found that 50% of enterprise respondents had repatriated some workloads from public to private cloud, up 15 percentage points from 2025. Security and compliance led reported repatriation motives at 51%, followed by cost predictability at 39%, making workload suitability and predictable costs separate sources of demand for private infrastructure.
Hybrid cloud is forecast to be the fastest-growing segment, with a 21.95% CAGR from 2027 to 2032. On February 26, 2026, NTT DOCOMO and NEC launched a commercial 5G core in Japan combining DOCOMO’s virtualization platform with AWS public cloud.[3] NEC contributed core software and architecture, and the partners implemented fault tolerance and redundancy for commercial operation. For an operator, the value of this configuration depends on preserving network service through an integrated deployment across both environments. In this launch, NEC’s architecture and the fault-tolerance and redundancy work formed part of the supplier scope alongside the AWS public-cloud capacity.
By End-user Vertical:
Core Operations Broaden Cloud CommitmentsBFSI was the largest segment, accounting for 27.39% of cloud-service revenue in 2026. LSEG’s 2025 global survey of 453 financial-services executives found that 87% of firms had increased cloud investment over the preceding 2 years. The survey highlighted scalability, revenue growth and AI enablement among the strategic outcomes receiving greater emphasis. Because firms emphasized scalability and AI enablement alongside revenue growth, suppliers supporting these objectives can expect to be assessed beyond hosting cost.
The fastest-growing segment is healthcare and life sciences, with a forecast CAGR of 20.7% from 2027 to 2032. WellSpan Health’s migration to AWS included its full Epic electronic medical record environment. Moving the core clinical record alongside other applications can make cloud capacity part of routine care operations, expanding its commercial role beyond isolated analytical projects. Completed in 2026, WellSpan’s migration covered more than 300 clinical applications and 7.5 petabytes of clinical and nonclinical data.
By Organization Size:
Account Depth Differentiates Enterprise DemandLarge enterprises accounted for 52.87% of cloud-service revenue in 2026, making them the largest segment. Flexera’s 2026 global survey, fielded in winter 2025, covered 753 cloud decision-makers and users and defined large enterprises as organizations with more than 10,000 employees. Within that surveyed size group, 76% spent more than USD 5 million monthly on public cloud services. Such spending intensity means a supplier can build a substantial revenue base from a relatively small number of successful enterprise relationships. A single account loss can leave a revenue gap that acquiring a lightly used customer will not close.
Small and mid-sized enterprises (SMEs) are forecast to be the fastest-growing segment, with a 21% CAGR from 2027 to 2032. In 2025, 49.3% of EU small enterprises with 10 to 49 employees or self-employed persons, within Eurostat’s surveyed business activities, used paid cloud services. Most enterprises in that surveyed size band had therefore not adopted paid cloud services in 2025, leaving room for first-time adoption. An enterprise in this size band has a limited employee base across which to spread the work of introducing an application. Repeatable setup lets the supplier serve this buyer with limited staff without making each additional account a custom implementation engagement.
Geography Analysis
North America Cloud Computing Market
North America held a 24.05% share of the cloud computing market size in 2026, making it the largest geography. The Government Accountability Office (GAO) reported in 2026 that United States federal cloud-services contract spending had risen from USD 2.3 billion to more than USD 10 billion annually over the preceding 10 years. Those contracts covered virtual machines, database hosting, cloud storage, and application development and deployment. That spread of contract types gives suppliers a federal application-development opportunity alongside infrastructure provision, extending the revenue base beyond hosting and storage.
Asia-Pacific Cloud Computing Market
Asia-Pacific is forecast to be the fastest-growing geography, with a 21.4% CAGR from 2027 to 2032. Google Cloud launched its Bangkok region in January 2026, adding local infrastructure with in-country data residency and low-latency service for Thai customers. In its fiscal 2024/25 report, GovTech Singapore said it had completed a migration of 213 systems across 41 agencies to Government on Commercial Cloud Plus and Government on Commercial Cloud. The work took more than 2 years and responded to the Government Private Cloud’s planned retirement. New local supply supports workloads constrained by residency or latency, while the completed Singapore transition establishes a commercial-cloud base for further applications.
In Europe, surveyed EU paid-cloud users favored email (85.2%), office software (71.7%) and file storage (71.5%) in 2025, and 73% of Irish enterprises used paid cloud, including email, software or data storage. In 2025, 36% of internet-connected Brazilian enterprises paid for cloud processing, while on June 18, 2025, Microsoft reported Chile Central operating through 3 independent physical locations serving businesses and public organizations in Chile and other South American countries. In Africa, AWS and Sonatel, an Orange affiliate, made on-demand compute and storage available in Dakar, Senegal, in April 2025 for West African customers. In Saudi Arabia, financial institutions regulated by the Saudi Central Bank (SAMA) should obtain SAMA approval before hybrid or public cloud use or contracting, include cybersecurity terms before use, and use Saudi hosting in principle, with explicit approval for foreign services. Saudi hosting and approval rules shape financial-sector access, while Chile Central and Dakar place capacity closer to regional buyers.
Mordor Intelligence provides coverage of the cloud computing market across other key regional markets, including North America, Europe, Asia, and South America, each with their regulatory frameworks and demand patterns. Detailed country-level analysis extends to Canada, France, India, Brazil, United States, and Spain incorporating local coverage and market participation, as required.
Regulatory Framework and Outlook
These selected jurisdictions are compared from the perspective of enterprise cloud providers handling regulated personal data. In the United States, health-data rules make electronic protected health information risk assessment and safeguards applicable to covered entities and business associates. Other countries combine cloud-specific delivery duties with international-transfer or data-governance requirements. These differences affect the operating controls and customer agreements needed to serve regulated workloads.
Regulatory Table of Cloud Computing Market
| Decision factor | United States | Germany | Brazil | China |
|---|---|---|---|---|
| Primary authority | Department of Health and Human Services, Office for Civil Rights | Bundesnetzagentur | National Data Protection Authority (ANPD) | Cyberspace Administration of China; Ministry of Industry and Information Technology; Ministry of Public Security |
| Key instruments or direction | HIPAA Security Rule, 45 CFR 164.308; proposed cybersecurity revision | EU Data Act cloud-switching provisions | ANPD Resolution 19; EU adequacy under Resolution 32/2026 | Network Data Security Management Regulations, effective January 1, 2025 |
| Commercial effect | Covered entities document assurances from direct business associates; covered entities and business associates assess risks and safeguard electronic protected health information | Cloud providers remove covered switching barriers; directly related switching costs are permitted during the transition | Controllers verify valid personal-data transfer bases and mechanisms; operators provide available information; EU is an adequate destination | Personal-information compliance audits; additional governance for classified important-data processors |
| Current policy attractiveness | Medium | Medium | Medium | Low |
| Future direction of policy attractiveness | Hardening | Hardening | No change | No change |
| Source: Mordor Intelligence | ||||
In the United States, health-data safeguards and direct-business-associate assurances provide a compliance route, while HHS’s unfinalized January 2025 Security Rule proposal is classified as a long-term action without scheduled implementation. Germany’s switching-support duties require provider adaptation, and the scheduled January 12, 2027 removal of switching and data-egress charges will further limit cost recovery. Brazil’s EU adequacy route operates within an existing transfer framework that preserves controller verification and operator-assistance obligations, supporting continuity after the 2026 decision. In China, personal-information audits and classified-important-data governance add operating work, while the August 2026 commitment to continue personal-information enforcement sustains regulatory pressure.
Value Chain Stages
The value chain compares physical hosting, cloud-service operation and customer implementation as an operating sequence. Equinix’s IBX infrastructure offerings generate monthly recurring revenue from customer space and power use under fixed-duration contracts. That structure makes physical availability itself a monetized input, before usage-priced cloud services or implementation work generate revenue farther along the chain. The distinction matters because capacity, consumption and implementation create different earnings opportunities and different exposure to interruption.
Value Chain Analysis Table of Cloud Computing Market
| Primary activity | Key participants | Value capture | Bottleneck | Resilience response |
|---|---|---|---|---|
| Physical data-center hosting | Colocation operators such as Equinix | IBX monthly space and power fees under fixed-duration contracts | Exposure to higher power costs, outages and capacity constraints | Energy-infrastructure investment, as Equinix undertook in 2025 |
| Cloud-service operation | Cloud-service operators such as Amazon (AWS), Microsoft | EC2 on-demand hourly/second usage, 60-second minimum, no long-term commitment; Azure pay-as-you-go usage beyond monthly free amounts | Risk of mismatch between provisioned capacity and paid usage | Stage capacity additions against paid workload demand |
| Application implementation and managed services | Integration and managed-services providers such as Accenture | Contract fees for managed services and technology integration under engagement-specific terms | Engagement scope and delivery complexity | Stage implementation and link fees to defined deliverables |
| Source: Mordor Intelligence | ||||
Equinix reported more than 10,500 customers and over 500,000 global interconnections in 2025. That scale gives its hosting stage a connection role alongside housing equipment, allowing physical infrastructure to support relationships across a large customer base. Accenture’s 2026 disclosure recognizes technology-integration revenue over time using costs incurred against estimated total costs, while contract terms vary with scope and complexity. For an integration provider, defining the system-delivery scope determines the work against which revenue progress is measured, making scope control part of value capture.
Competitive Landscape
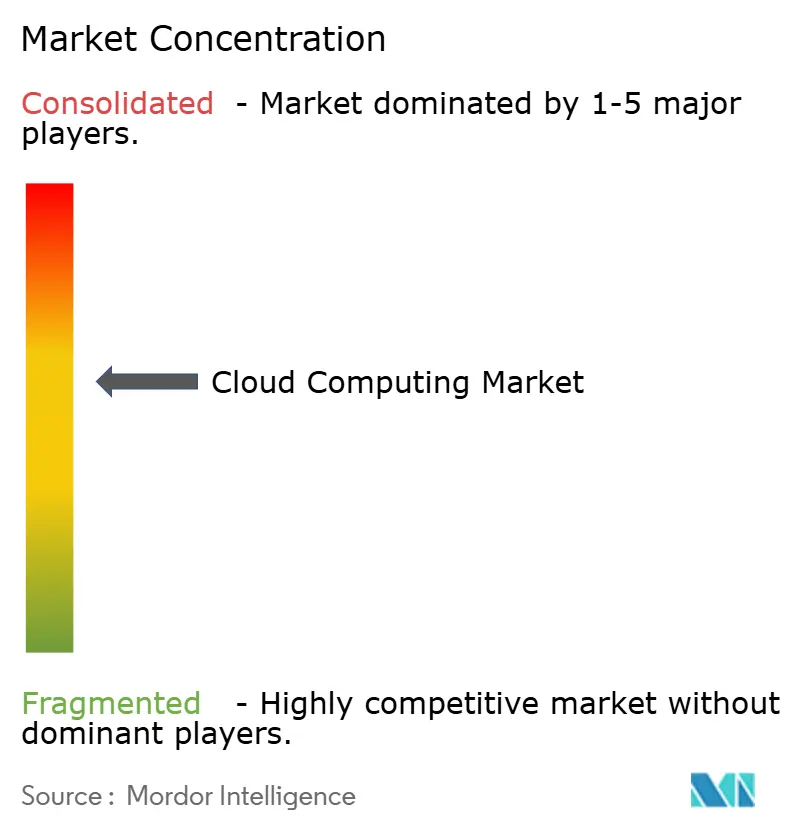
Competition has a large-platform core, alongside providers differentiated by hybrid-cloud software or sovereign delivery requirements. Amazon (AWS) recorded AWS segment sales of USD 42.2 billion in Q2 2026, up 37% year over year. Microsoft reported 43% year-over-year growth in Azure and other cloud services in its fiscal fourth quarter of 2026, a measure including GitHub and Nuance Healthcare cloud services. Google Cloud supplies infrastructure, platform, application and other enterprise services. For challengers, a workload-specific or compliance-focused offer provides a way to compete without replicating the breadth of these growing cloud platforms.
Alibaba Cloud’s parent, Alibaba Group, reported 45% year-over-year growth in external-customer revenue for AI Cloud and Compute Services in the quarter ended June 30, 2026. The newly reported segment combined Cloud Intelligence Group with T-Head, and Alibaba attributed its revenue momentum primarily to increasing adoption of AI-related products. IBM’s Hybrid Cloud (Red Hat) software measure grew 11% year over year in Q2 2026. Alibaba’s segment spans Cloud Intelligence Group and T-Head while IBM’s measure covers Red Hat software, so enterprises meet the 2 at different layers of a deployment rather than as like-for-like cloud platforms.
In April 2026, the European Commission awarded 4 sovereign-cloud contracts for EU institutions, bodies, offices and agencies, including a Proximus-led consortium using S3NS services. Within the awarded offering, S3NS was a Thales and Google Cloud joint venture, and the Google Cloud-based technical environment was operated exclusively by EU companies. By February 19, 2026, Microsoft Azure had completed an industry-led supplier audit for regulated life-sciences use through the Joint Audit Group managed by Ingelheimer Kreis. The audit used spot-checks of selected operations, reflected information Microsoft presented, and provided assurance to the group’s members. On the Commission’s Cloud Sovereignty Framework, Proximus/S3NS reached SEAL-2 (data sovereignty), below the SEAL-3 (digital resilience) reached by the 3 awardees developing their own technology, so a hyperscaler-based offering qualified while challengers achieved higher sovereignty ratings in this procurement.
Cloud Computing Industry Leaders
-
Amazon (AWS)
-
Microsoft
-
Google Cloud
-
Alibaba Cloud
-
IBM
- *Disclaimer: Major Players sorted in no particular order
Cloud Computing Market Companies Covered in this Report
- Amazon (AWS)
- Microsoft
- Google Cloud
- Alibaba Cloud
- IBM
- Oracle
- Salesforce
- SAP SE
- Adobe
- Tencent Cloud
- Huawei Cloud
- Rackspace Technology
- VMware
- Snowflake
- Workday
- ServiceNow
- DigitalOcean
- OVHcloud
- Linode
- Nutanix
Key Opportunities for Market Participants
These opportunities compare EU cloud-migration needs with UK public-sector purchasing channels. The European Commission identifies high data-egress charges, lengthy switching procedures and interoperability gaps as barriers to changing cloud providers. Interoperability gaps can result in data or application loss, making migration execution commercially important alongside lower exit costs. For UK public-sector buyers, a parallel opening is access to cloud hosting, software and support through a defined procurement framework.
Market Opportunities Table of Cloud Computing Market
| Opportunity | Why now | Buyer / lead segment | Recommended play | Main barrier | Likely beneficiaries |
|---|---|---|---|---|---|
| EU cloud portability services | Scheduled Data Act switching-charge transition | Enterprises changing cloud providers | Package migration testing and application transfer | Interoperability gaps and potential data or application loss | Cloud migration and integration providers |
| UK public-sector cloud call-offs | G-Cloud 15 launched in August 2026; an 18-month reopening window was announced for new and growing suppliers after launch | Public-sector buyers of cloud hosting, software and support | Match service bundles to competitive or direct call-off routes | Securing buyer selection after framework admission | Microsoft Limited and Google Cloud EMEA Limited |
| Centralized UK government cloud supply | Roadmap targets agreement of an all-of-government central cloud contract in December 2026 | UK government bodies | Prepare service bundles for planned standardized marketplace purchasing | Centralized buyer selection | Providers able to support centralized public-sector purchasing |
| Source: Mordor Intelligence | |||||
The strongest opening is migration work that preserves operational continuity when the financial cost of changing providers falls. Suppliers can differentiate through tested application transfers and recoverable data handling because the remaining interoperability risk concerns what survives the move. UK cloud sellers face a separate choice between call-off engagement and preparation for the planned central contract, which calls for an offer suited to standardized government purchasing.
Recent Industry Developments in Cloud Computing Market
- Aug 2026: Microsoft announced general availability of its India South Central cloud region in Hyderabad, Telangana, enabling customers to run eligible Microsoft Cloud services and workloads from the region.
- Aug 2026: The Government Commercial Agency launched G-Cloud 15, a UK public-sector framework covering cloud hosting, software and support.
- Jul 2026: WellSpan Health announced that it had completed its AWS migration, covering more than 300 clinical applications and 7.5 petabytes of clinical and nonclinical data, including its full Epic electronic medical record environment.
Cloud Computing Market Report Scope and Research Methodology
Market Definition and Coverage
Cloud computing market measures annual spending worldwide on computing services delivered over a network to enterprise and consumer customers. The value covers infrastructure, platform, and software services across cloud deployment models, classified by service model, customer industry, organization size, and geography.
Scope exclusions: Traditional on-premise software licenses, hardware-only sales, data center construction and facility equipment sold separately, and telecommunications connectivity sold separately from cloud services are excluded.
Segments Covered in This Report
- By Service Model
- IaaS
- PaaS
- SaaS
- By Deployment Model
- Public Cloud
- Private Cloud
- Hybrid Cloud
- By End-user Vertical
- IT and Telecom
- BFSI
- Manufacturing
- Retail and Consumer Goods
- Healthcare and Life Sciences
- Others
- By Organization Size
- Large Enterprises
- Small and Mid-Sized Enterprises (SMEs)
- By Geography
- North America
- United States
- Canada
- Mexico
- South America
- Brazil
- Argentina
- Rest of South America
- Europe
- Germany
- United Kingdom
- France
- Italy
- Spain
- Rest of Europe
- Asia-Pacific
- China
- Japan
- India
- South Korea
- Southeast Asia
- Rest of Asia-Pacific
- Middle East and Africa
- Middle East
- Saudi Arabia
- United Arab Emirates
- Turkey
- Rest of Middle East
- Africa
- South Africa
- Nigeria
- Egypt
- Rest of Africa
- Middle East
- North America
Data Sources, Market Sizing, and Validation
Desk Research
NIST Special Publication 800-145 provides the service and deployment model definitions used to organize the market, while Eurostat's enterprise cloud-use statistics show adoption by service and business size. The U.S. Government Accountability Office's cloud procurement reviews and the United Nations Conference on Trade and Development's Digital Economy Report add procurement evidence and digital infrastructure context.
Company annual reports, investor presentations and reputable business and technology press can supplement these sources with provider cloud revenue, investment, product and customer evidence. Such indicators help cross-check the scale and direction of the defined global customer-spending pool. These named sources are not exhaustive, and further sources inform collection, validation and clarification.
Primary Interviews and Surveys
Structured interviews and surveys can include cloud service providers, enterprise and consumer buyers, systems integrators, and cloud procurement or finance leaders across APAC, EMEA, and the Americas. Their input can test secondary-source interpretations of service boundaries, customer spending, deployment choices and demand drivers, while discrepancies are checked against documented prices, disclosed revenues and public adoption indicators.
Distribution of primary research fieldwork respondents
| Company type | Respondent position | Region |
|---|---|---|
| Top tier: 32% | CXOs: 20% | APAC: 38% |
| Mid tier: 45% | Functional/Unit leaders: 30% | EMEA: 30% |
| Smaller Players: 23% | Managers: 50% | Americas: 32% |
Market-Sizing & Forecasting
The estimate starts from global customer spending on IaaS, PaaS and SaaS and checks that top-down total against selected provider revenue disclosures and sampled service price times customer usage where evidence is available. A consistent transaction rule counts the annual customer charge once, including a bundled service price only once, and excludes separately sold equipment, facilities and connectivity. Service-model, deployment, end-user, organization-size and regional shares are built from published market splits, provider disclosures, public adoption indicators and buyer evidence, then reconciled so each set represents the same annual spending pool.
For the forecast, scenario analysis tests how enterprise application adoption, AI-related compute demand, migration among public, private and hybrid deployments, customer-sector uptake, and regional data-center investment affect spending and its mix through 2032. Provider capacity and service pricing help test value growth, while adoption and usage indicators inform whether customer demand can absorb that capacity. Where a split or indicator is unavailable, the analyst records the gap, uses adjacent public evidence and expert input to set a bounded assumption, and checks its effect against the total. Interviews can challenge variable-level assumptions and reveal missing drivers without substituting opinion for observed market evidence.
Data Validation & Update Cycle
Analysts triangulate the annual spending estimate against provider disclosures, public adoption and procurement indicators, price and usage evidence, and buyer or supplier input. They investigate unusual movements and material differences between independent signals, document the resolution, and review source quality, arithmetic, boundaries and segment totals in successive analyst checks before sign-off. Analysts re-contact knowledgeable respondents when an answer conflicts with a later disclosure or leaves a material boundary or forecast input unresolved. Estimates are refreshed annually, revisited between cycles after material market events, and checked again in a fresh pre-delivery review.
Mordor Intelligence's Cloud Computing Market Size Compared With Other Published Estimates
Published estimates can differ in the transactions and products they count and the inputs used to model demand. Cloud computing market measures annual spending worldwide on computing services delivered over a network to enterprise and consumer customers.
Key Gap Drivers include the study's defined coverage and market-specific modeling choices. Service-model, deployment, end-user, organization-size and regional shares are built from published market splits, provider disclosures, public adoption indicators and buyer evidence, then reconciled so each set represents the same annual spending pool.
Benchmark comparison
| Source | Market Size | Gaps in Research Methodology |
|---|---|---|
| Mordor Intelligence | USD 1.25 T (2027) | |
| Global Consultancy A | USD 1.13 T (2024) | At its 2024 base, this estimate is 9.6% below this report's 2027 value of USD 1.25 T, 3 years later. Its earlier base year and lower stated 2025-2030 growth rate can contribute to a lower value than the report's later-year estimate. |
| Global Consultancy B | USD 1.09 T (2024) | At its 2024 base, this estimate is 12.8% below this report's 2027 value of USD 1.25 T, 3 years later. Its earlier measurement year can contribute to a lower comparison with the report's later-year estimate. |
Mordor Intelligence's analysts triangulate the annual spending estimate against provider disclosures, public adoption and procurement indicators, price and usage evidence, and buyer or supplier input.
Key Questions Answered in the Report
What is the cloud computing market size and growth outlook?
It is projected at USD 1.25 trillion in 2027 and USD 3.16 trillion by 2032, with a 20.35% CAGR from 2027 to 2032.
Which forces are expanding demand for cloud services?
Enterprise application adoption and AI services are major forces. AWS reported an annualized AI revenue run rate above USD 15 billion in Q1 2026.
Which cloud service model has the largest share?
SaaS led with 52.63% of cloud-service revenue in 2026. PaaS is forecast to grow fastest at a 22.55% CAGR from 2027 to 2032.
Which companies compete for enterprise cloud business?
Amazon (AWS), Microsoft, Google Cloud, Alibaba Cloud and IBM are major competitors.
What is a key challenge for further cloud adoption?
Cost predictability is a constraint. In Flexera’s 2026 global survey, 17% of respondents reported exceeding their public cloud budgets in the past year.
Which region leads cloud revenue and which is growing fastest?
North America led with 24.05% of cloud-service revenue in 2026. Asia-Pacific is forecast to grow fastest at a 21.4% CAGR from 2027 to 2032.