
Cloud Infrastructure Services Market Size and Share
Market Overview
| Study Period | 2020 - 2031 |
|---|---|
| Market Size (2026) | USD 377.07 Billion |
| Market Size (2031) | USD 871.48 Billion |
| Growth Rate (2026 - 2031) | 18.21 % |
| Fastest Growing Market | Asia Pacific |
| Largest Market | North America |
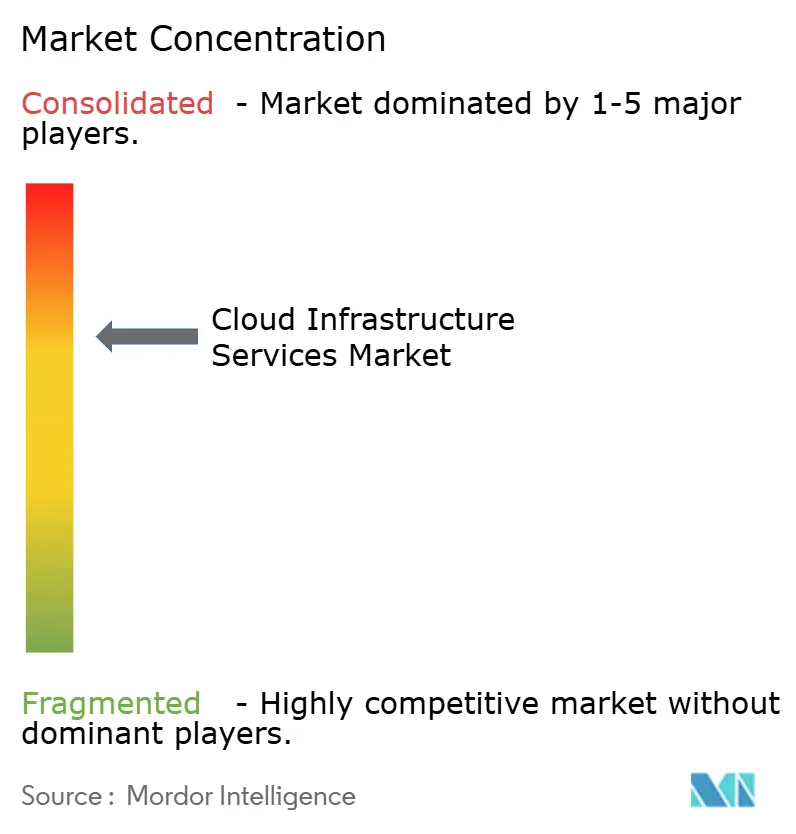
| Market Concentration | Medium |
Major Players *Disclaimer: Major Players sorted in no particular order Image © Mordor Intelligence. Reuse requires attribution under CC BY 4.0. | |
Cloud Infrastructure Services Market Analysis by Mordor Intelligence
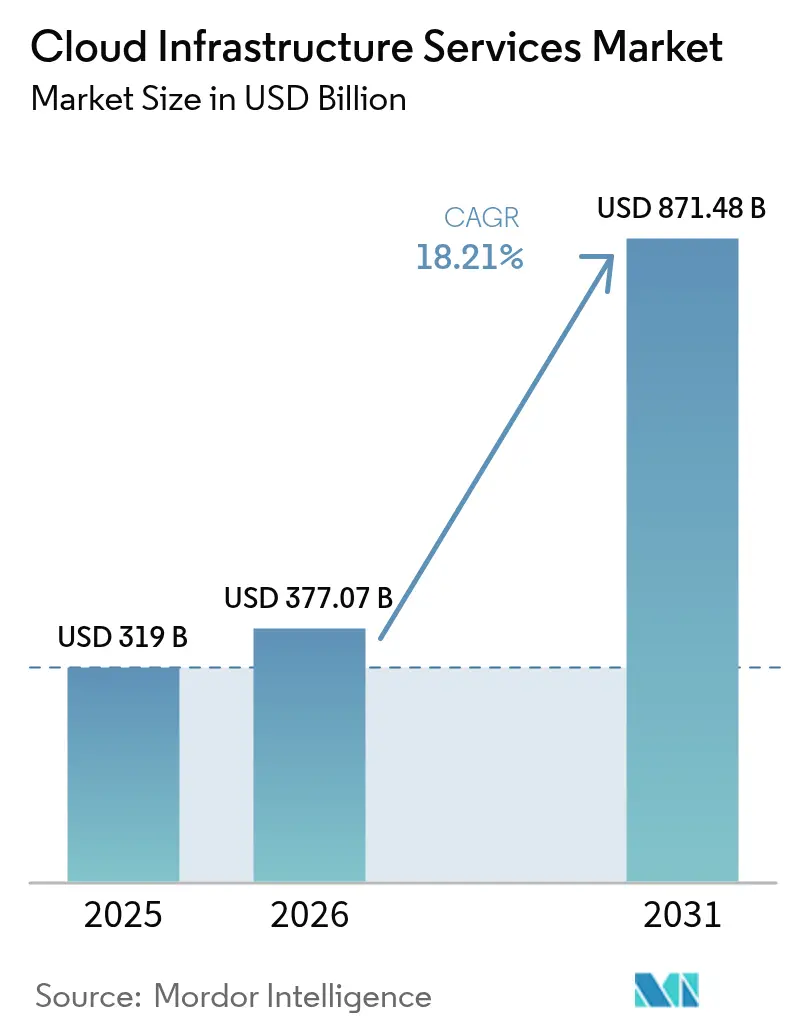
Cloud Infrastructure Services Market size in 2026 is estimated at USD 377.07 billion, growing from 2025 value of USD 319 billion with 2031 projections showing USD 871.48 billion, growing at 18.21% CAGR over 2026-2031.
Heightened adoption stems from artificial-intelligence workloads that depend on scalable GPU clusters unavailable in legacy data centers. Public-cloud leaders removed egress fees in 2024, responding to rising regulatory mandates for data portability and sharpening price competition. Sovereign-cloud build-outs in Asia-Pacific and Europe redirect spending to regional providers as governments tighten residency rules, Microsoft. Supply-chain shortages of high-bandwidth memory and advanced GPUs continue to cap capacity, though easing is anticipated by late 2025. Competitive intensity deepens as hyperscalers push custom silicon and edge-computing nodes to preserve margin while meeting ultra-low-latency requirements.
Key Report Takeaways
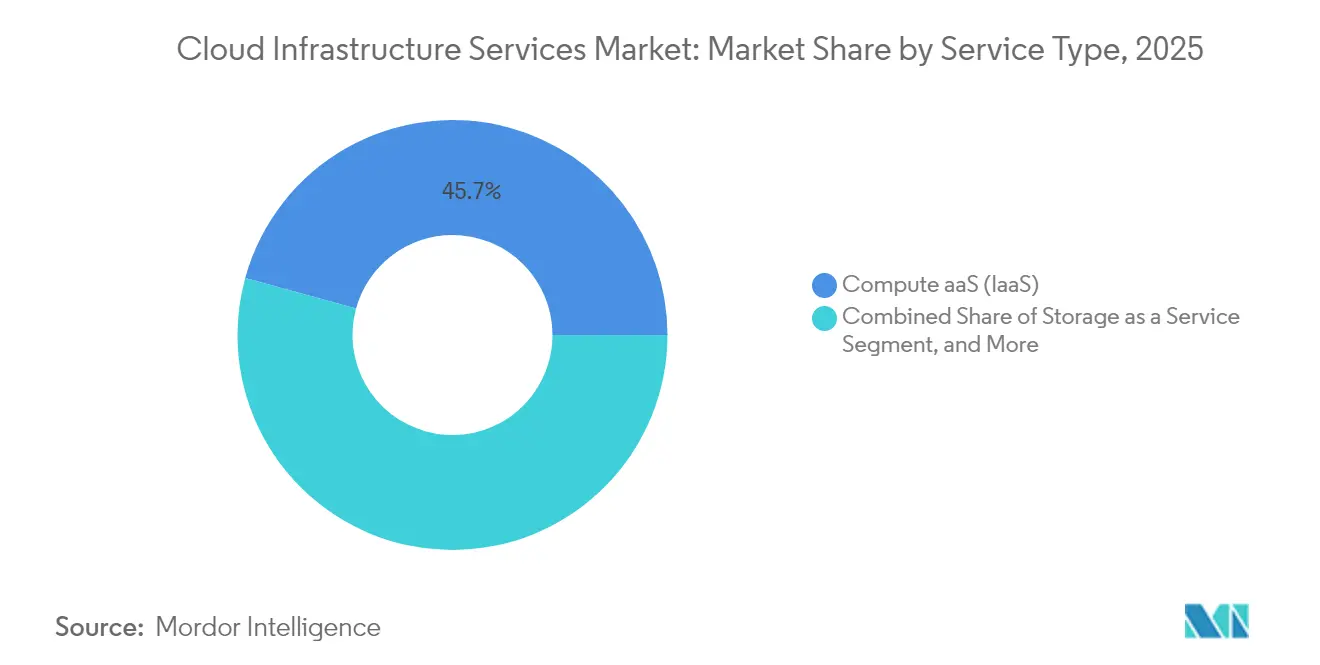
- By service type, compute as a service led with 45.72% revenue share in 2025 in the cloud infrastructure services market, while networking as a service is forecast to expand at a 22.74% CAGR to 2031.
- By deployment model, the public cloud segment commanded 90.35% of the cloud infrastructure services market share in 2025, whereas Hybrid Cloud is advancing at a 26.35% CAGR through 2031.
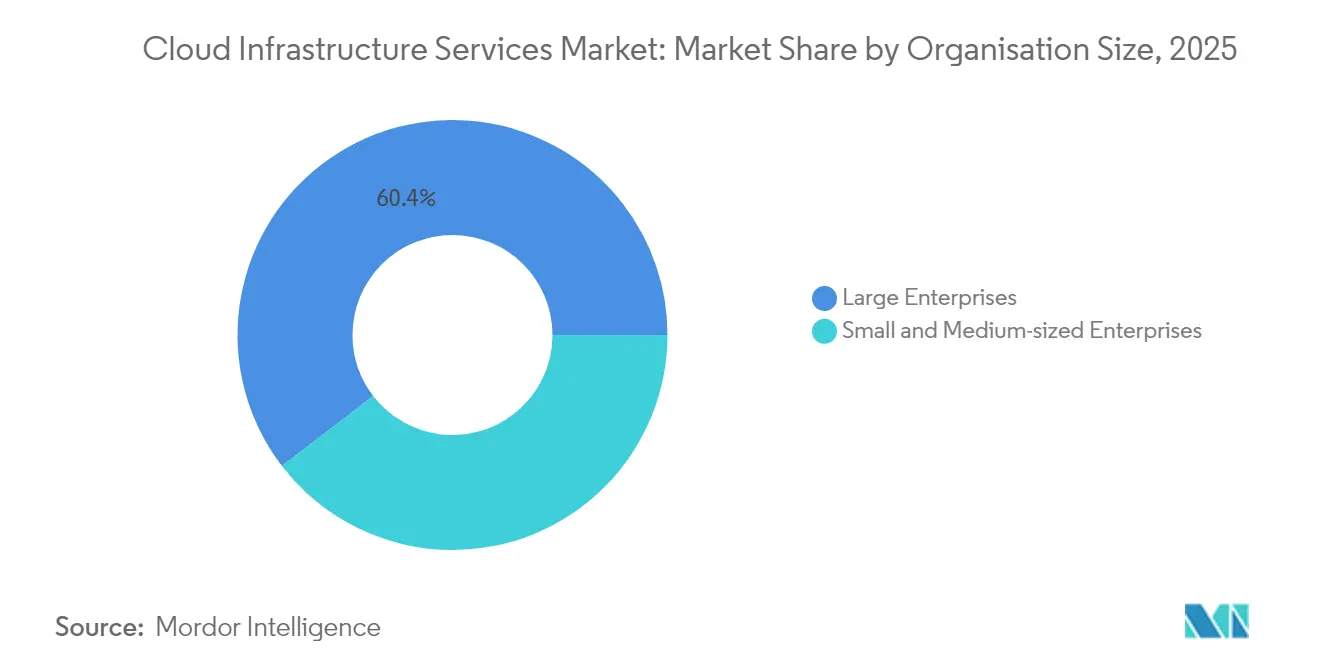
- By organization size, large enterprises accounted for 60.42% of 2025 revenue in the cloud infrastructure services market, while small and medium enterprises are projected to grow at a 20.75% CAGR to 2031.
- By end-user vertical, IT and telecommunications held 23.65% of the market in 2025 in the cloud infrastructure services market; healthcare and life sciences are poised for a 24.38% CAGR over 2026-2031.
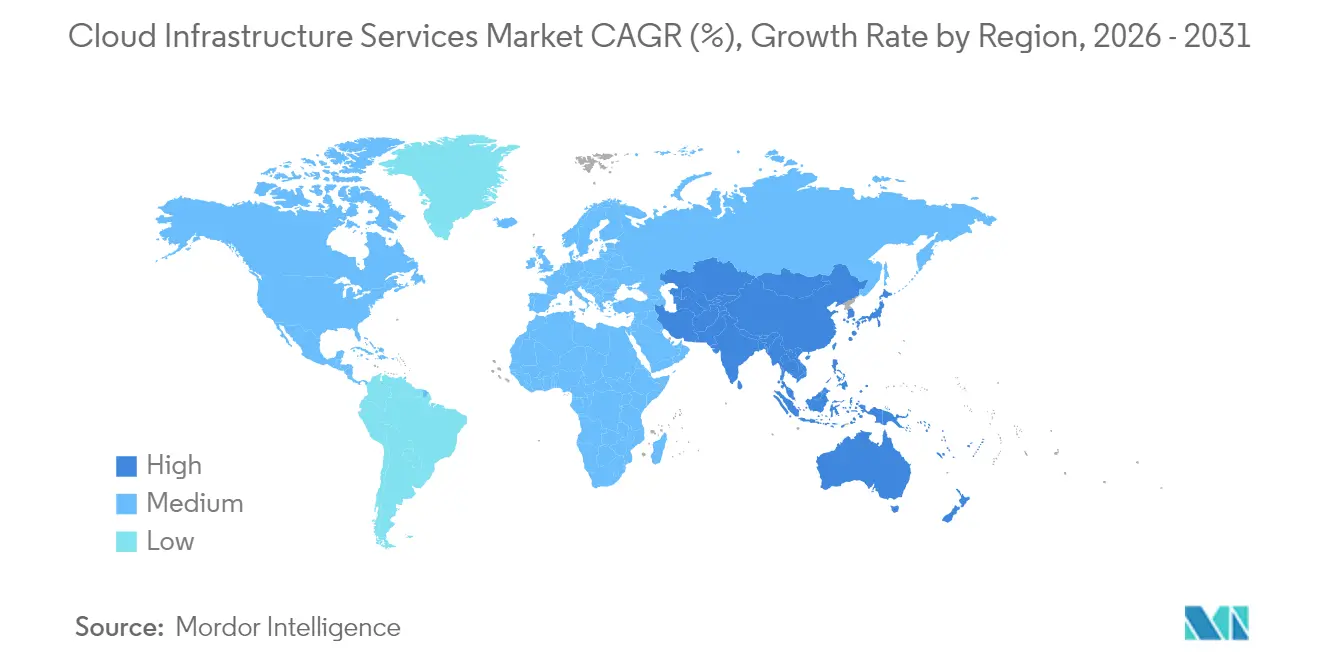
- By geography, North America captured a 46.28% revenue share in 2025 in the cloud infrastructure services market; however, the Asia-Pacific region is set to expand at a 23.41% CAGR through 2031.
Note: Market size and forecast figures in this report are generated using Mordor Intelligence’s proprietary estimation framework, updated with the latest available data and insights as of 2026.
Market Trends and Insights
Drivers Impact Analysis of Cloud Infrastructure Services Market*
| Driver | (~) % Impact on CAGR Forecast | Geographic Relevance | Impact Timeline |
|---|---|---|---|
| Growing IaaS benefits | +3.2% | Global, with strongest uptake in North America and Europe | Medium term (2-4 years) |
| Cost-savings and ROI focus | +2.8% | Global, particularly SME segments in emerging markets | Short term (≤ 2 years) |
| Rapid edge-computing roll-outs | +4.1% | Asia-Pacific core, spill-over to North America | Medium term (2-4 years) |
| Sovereign-cloud build-outs | +2.3% | Asia-Pacific, Europe, with selective adoption in MEA | Long term (≥ 4 years) |
| AI-accelerator demand for custom silicon | +3.7% | Global, concentrated in major tech hubs | Short term (≤ 2 years) |
| Carbon-optimised "green cloud" contracts | +1.4% | Europe and North America, expanding to Asia-Pacific | Long term (≥ 4 years) |
| Source: Mordor Intelligence | |||
Growing IaaS Benefits
Enterprises accelerate adoption of Infrastructure as a Service to gain operational flexibility and avoid capital expenditure on rapidly obsolescing hardware. Hyperscalers deploy purpose-built GPU clusters such as Oracle’s Zettascale Cloud Supercluster with 131,000 NVIDIA Blackwell GPUs to capture AI training demand.[1]Rich Brueckner, “Oracle Debuts Zettascale Cloud Supercluster,” Inside HPC, insidehpc.com Healthcare providers illustrate this shift, as Epic workloads migrated to the public cloud recorded better scalability and user satisfaction, even while grappling with cost-visibility challenges. Extended server lifecycles, AWS moved to five-year depreciation in 2025, improve provider margins that can be reinvested in new capacity. These dynamics collectively elevate the cloud infrastructure services market trajectory by enabling elastic consumption models aligned to unpredictable AI workload peaks.
Cost-Savings and ROI Focus
Budget priorities favor operational spending that matches resource usage, prompting organizations to replace on-premises infrastructure with pay-as-you-go cloud contracts. Small businesses embrace SaaS at a 78% penetration rate, highlighting how simplified services lower technical barriers. The UAE projects USD 17 billion in cumulative economic value from hyperscale cloud deployments by 2030, mainly through productivity gains and SME job creation. Despite this upside, OECD data show only 41% of SMEs use cloud computing, evidencing a persistent skills gap. Providers increasingly bundle AI-powered automation and cost-governance tools to help smaller firms monitor consumption, reinforcing the inclusive expansion of the cloud infrastructure services market.
Rapid Edge-Computing Roll-Outs
Global edge-spending reached USD 232 billion in 2024 and continues climbing as 5G networks demand sub-10 millisecond latency for consumer and industrial workloads. Microsoft’s Azure Edge Zones and Google Distributed Cloud deliver managed hardware at the network perimeter, priced from USD 10,864 per rack per month for telco use cases. Carrier partnerships, such as Google Cloud with AT&T, exploit local breakout capabilities to host low-latency applications close to the user. As these deployments standardize developer experiences across core and edge sites, the cloud infrastructure services market becomes the default platform for time-critical analytics, boosting overall demand.
Sovereign-Cloud Build-Outs
Regulators push data-residency mandates that compel architectural redesigns. Nearly 64% of Australian enterprises assess sovereignty-focused strategies, while 19% across broader Asia-Pacific plan higher sovereign-cloud spending. Italy’s partnership with Telekom Italia shows regulated verticals emphasizing in-country hosting to satisfy banking and healthcare rules. The EU Data Act, enforceable from September 2025, eliminates switching fees by 2027, driving providers to refactor services for portability. These initiatives redistribute workloads toward regional operators, creating new addressable pools inside the cloud infrastructure services market.
Restraints Impact Analysis of Cloud Infrastructure Services Market*
| Restraint | (~) % Impact on CAGR Forecast | Geographic Relevance | Impact Timeline |
|---|---|---|---|
| Data-loss and privacy concerns | -2.1% | Global, with heightened sensitivity in Europe and Asia-Pacific | Medium term (2-4 years) |
| High bandwidth and monitoring costs | -1.8% | Global, particularly affecting emerging markets | Short term (≤ 2 years) |
| GPU / server supply-chain bottlenecks | -3.4% | Global, most severe in North America and Asia-Pacific tech hubs | Short term (≤ 2 years) |
| Egress-fee and localisation regulations | -1.2% | Europe and Asia-Pacific primarily, with spillover effects globally | Medium term (2-4 years) |
| Source: Mordor Intelligence | |||
Data-Loss and Privacy Concerns
Cybersecurity incidents remain a primary barrier. Surveyed federal agencies reported 90% ransomware exposure within three years, prompting a pivot to zero-trust architectures. Multinationals juggle conflicting jurisdictions such as GDPR and the US CLOUD Act, adding compliance overhead. Although sovereign-cloud options mitigate exposure, they introduce multicloud complexity and higher run-rates, tempering the growth of the cloud infrastructure services market.
GPU / Server Supply-Chain Bottlenecks
NVIDIA H100 GPUs and high-bandwidth memory products are oversubscribed through 2025, restricting capacity expansion. Amazon’s Project Greenland centralizes GPU allocation to avoid resource idling and to ensure top-line AI projects proceed. Substrate shortages within Taiwanese and Japanese plants extend lead times, while a grey market inflates prices for scarce components. Delayed deliveries slow new region launches and cap the achievable scale of the cloud infrastructure services market in the short term.
*Our forecasts treat driver/restraint impacts as directional, not additive. The impact forecasts reflect baseline growth, mix effects, and variable interactions.
Cloud Infrastructure Services Market Segment Analysis
By Service Type:
Networking Infrastructure Drives GrowthCompute as a Service generated 45.72% of 2025 revenue as enterprises pursued elastic processing power for complex AI model training. The cloud infrastructure services market size for compute surpassed USD 145.86 billion in 2025 and is expected to expand steadily through 2031. Networking as a Service exhibits a 22.74% CAGR, reflecting the proliferation of edge nodes that interlink 5G core networks with regional data centers. Google’s carrier-grade 5G Core-as-a-Service, built with Ericsson, illustrates how integrated networking and AI functions unlock incremental opportunities. Storage as a Service registers consistent uptake as data-intensive workloads migrate to cost-effective object storage. Database and managed-hosting lines address compliance-heavy industries, offering pre-configured encryption and audit trails.
The growth split underscores the architectural transition toward distributed computing. As sensor-rich devices push telemetry directly into edge caches, networking services experience outsized momentum. Meanwhile, compute services defend share by embedding custom accelerators, such as Google’s A3 Ultra VMs that boost GPU-to-GPU bandwidth for generative AI positions, bundled offers that combine networking, compute, and storage under unified SLAs, enabling customers to adopt composable resources across the cloud infrastructure services market without vendor lock-in.



By Deployment Model:
Hybrid Acceleration Challenges Public DominancePublic Cloud retained 90.35% share in 2025 and remains the default entry point for greenfield digital programs. However, the hybrid model is forecast to grow at 26.35% CAGR, adding flexibility for data-sensitive workloads. The cloud infrastructure services market share attributable to hybrid environments is set to double by 2031 as firms deploy private extensions inside colocation sites. Federal agencies have already cut exclusive data center usage from 27% to 5% within three years, highlighting irreversible migration away from legacy setups.
Hybrid strategies resolve sovereignty and latency concerns by placing sensitive data on private clouds while consuming burst capacity in public regions. Orchestrating these patterns is complex; therefore, IBM acquired HashiCorp for USD 6.4 billion to integrate Terraform automation into its portfolio and simplify workflow portability. As orchestration standards consolidate, the cloud infrastructure services market size tied to hybrid solutions accelerates, bringing new revenue for system integrators and multicloud management vendors.
By Organization Size:
SME Democratization AcceleratesLarge Enterprises contributed 60.42% of 2025 spending as they pursued multi-region architectures supporting mission-critical applications. Yet SMEs account for the fastest expansion at 20.75% CAGR, closing the digital divide as providers roll out wizard-driven consoles and local currency billing. The cloud infrastructure services market size for SMEs is forecast to multiply through 2031 due to simplified onboarding, AI-assisted cost controls, and community-driven training programs. Nigeria’s firms increasingly favor domestic clouds offering naira-based pricing and in-country data storage, highlighting regional tailoring
Persistent barriers remain. OECD research shows that only 41% of SMEs use any form of cloud computing, hindered by expertise gaps and network reliability. Providers respond with managed security bundles, pre-set compliance templates, and promotional credits earmarked for startups, ensuring sustained inflows of new workloads into the cloud infrastructure services market.
By End-User Vertical:
Healthcare Transformation LeadsIT and Telecommunications users dominated 23.65% of 2025 revenue, leveraging mature DevOps cultures and continuous network upgrades. Healthcare and Life Sciences is projected to grow at a 24.38% CAGR, overtaking traditional leaders as electronic health records, medical imaging, and precision medicine datasets migrate into HIPAA-compliant cloud enclaves. Average hospital cloud expenditure already stands at USD 38 million per year. The cloud infrastructure services market size tied to healthcare is primed for expansion as AI models improve diagnostic accuracy in oncology and radiology.
Healthcare adoption highlights the need for stringent data governance. Sovereign solutions gain traction where patient privacy regulations ban cross-border processing. Providers respond with region-locked key-management services and audit capabilities that satisfy regulators, reinforcing the verticalization trend inside the cloud infrastructure services market. BFSI, retail, and public-sector workloads follow similar trajectories, though at more moderate growth rates, constrained by legacy application refactoring requirements.
Geography Analysis
North America Cloud Infrastructure Services Market
North America controlled 46.28% of 2025 revenue, reflecting deep enterprise cloud maturity and large-scale AI investments by hyperscalers. Amazon earmarked more than USD 30 billion for new data centers in Pennsylvania and North Carolina, creating 1,750 skilled positions. Meta committed USD 10 billion to a Louisiana facility that will require three additional power plants, capturing expanding AI inference workloads. Power-grid limitations present a mounting hurdle: lead times for new capacity now span up to seven years, forcing operators to negotiate renewable energy contracts and explore nuclear partnerships. Despite these constraints, the cloud infrastructure services market remains anchored in the region thanks to sustained demand from Fortune 500 enterprises and advanced digital public-sector programs.
APAC Cloud Infrastructure Services Market
Asia-Pacific is the fastest-growing geography, forecast to rise at a 23.41% CAGR through 2031. The regional data-center market could reach USD 30.69 billion by 2029, buoyed by IoT proliferation and 5G adoption. India plans an additional 850 MW of capacity by 2026, with AWS pledging USa USD 12.7 billion investment in Asia. Malaysia’s Johor Bahru region holds 1.6 GW in active supply and may surpass Singapore as Southeast Asia’s prime hub, though the projected demand of 5 GW by 2035 strains sustainability targets. ASEAN aggregate capacity could quintuple to 7,589 MW by 2028, positioning regional providers alongside global incumbents. This momentum cements Asia-Pacific as the epicenter of new workload deployments, expanding the cloud infrastructure services market at record pace.
EMEA and South America Cloud Infrastructure Services Market
Europe, South America, and Middle East and Africa contribute smaller but strategic shares. European growth centers on sovereign-cloud frameworks that comply with GDPR and the forthcoming EU Data Act Lexology. Africa’s cloud sector, valued at more than USD 600 billion and growing 25-30% annually, struggles with data-residency laws and limited local infrastructure. Operators like Africa Data Centres add regional POPs while Starlink’s satellite coverage across 15 African nations offers alternative last-mile connectivity. These initiatives collectively expand the cloud infrastructure services market footprint into previously underserved territories.

Regulatory Landscape
Cloud infrastructure services are increasingly shaped by portability, security assurance, and systemic-risk oversight requirements, which influence service design and procurement eligibility. In the European Union, the Data Act becomes enforceable from September 2025 and includes provisions that remove barriers to switching by targeting lock-in mechanisms such as switching fees by 2027, reinforcing data portability expectations across providers.
In June 2026, the European Commission proposed the Cloud and AI Development Act (CADA), setting an industrial-policy direction to expand EU data center capacity and introducing a trusted-cloud assurance approach for public-sector use. In the United States, government cloud adoption continues to run through formal authorization frameworks, including FedRAMP, and defense workloads also align to Department of Defense requirements such as DISA provisional authorization and the Cloud Computing Security Requirements Guide (SRG), raising expectations for security controls, auditability, and residency-aligned architectures.
Value Chain Analysis
The cloud infrastructure services value chain begins upstream with semiconductor design and manufacturing (CPUs, GPUs, networking silicon, memory), server and storage OEMs/ODMs, and data center construction inputs (concrete, steel, copper), plus long-lead electrical equipment such as transformers and switchgear. This then feeds into hyperscalers, regional cloud providers, and colocation operators that build and operate data centers, along with interconnection and fabric providers, telecom carriers, and CDNs that deliver low-latency connectivity to end users and edge sites.
Value capture downstream is amplified by software and services layers such as virtualization and container platforms, cloud management and security tooling, and system integrators and managed service partners that implement, migrate, and optimize customer environments. Constraints remain concentrated in infrastructure delivery, including grid access and power availability, multi-year interconnection queues in key US markets, extended 12 to 24 month lead times for electrical infrastructure, and continued shortages in advanced AI hardware, which collectively affect region launches, instance availability, and customer procurement cycles.
Competitive Landscape
The cloud infrastructure services market exhibits oligopolistic traits, with AWS, Microsoft, and Google Cloud collectively controlling 62% of global revenue in Q1 2025 CRN. AWS still leads at 29% although three consecutive quarters of sub-consensus growth point to maturation challenges. Competitive differentiation pivots to AI performance; Google’s A3 Ultra instances and Microsoft’s Azure Maia custom silicon target high-throughput training workloads, while Oracle positions a 131,000-GPU supercluster for HPC customers.
Regional providers gain share by addressing sovereignty and latency gaps. Huawei Cloud Stack delivered 77% revenue growth in 2023 and more than doubled hybrid-cloud sales, capitalizing on geopolitical tailwinds. New “AI neoclouds” such as CoreWeave and Lambda Labs focus on GPU rentals, forecast to generate USD 32 billion in spending by 2027. M&A reshapes tooling: IBM closed the USD 6.4 billion HashiCorp acquisition to bolster multicloud automation. Patent activity rises as hyperscalers lock in distributed-processing IP and cross-license to avoid litigation.
Strategic investments exceed USD 100 billion annually as providers race to secure land, power, and chip supply. EdgeCore reserved USD 17 billion for a Virginia campus, and SK Group plus AWS allocated USD 4 billion for a 60,000-GPU complex in South Korea. The resource-intensive nature of next-generation AI farms accentuates barriers to entry, reinforcing a high market-concentration narrative across the cloud infrastructure services market.
Cloud Infrastructure Services Industry Leaders
Amazon Web Services, Inc.
Google LLC
Microsoft Corporation
IBM Corporation
Oracle Corporation
- *Disclaimer: Major Players sorted in no particular order
Cloud Infrastructure Services Market Companies Covered in this Report
- Amazon Web Services
- Microsoft Corporation
- Google LLC
- IBM Corporation
- Oracle Corporation
- Alibaba Cloud
- Rackspace Technology
- Fujitsu Ltd
- Lumen Technologies (CenturyLink)
- VMware Inc.
- DXC Technology
- NTT Ltd / Dimension Data
- Verizon Business
- Tencent Cloud
- ATandT Business
- NEC Corporation

Market Opportunities and Future Outlook
AI-heavy workloads are pulling spend toward GPU-rich compute, high-performance storage, and advanced networking, creating room for specialized capacity provisioning and cost-governance services as customers look for predictable accelerator access amid supply constraints. Evidence of this shift includes Omdia reporting global cloud infrastructure spending of USD 110.9 billion in Q4 2025, up 29% year-on-year, alongside hyperscalers scaling capital investment to support AI production infrastructure.
Policy-driven sovereignty and systemic-risk oversight are also creating opportunities for region-locked offerings, assured-cloud certifications, and regulated-vertical reference architectures. In June 2026, the European Commission proposed the Cloud and AI Development Act (CADA), adding a trusted-cloud assurance framework for public administrations, while in the United Kingdom the Critical Third Parties (Designation) Regulations 2026, effective July 13, 2026, formally designated AWS, Google Cloud, Microsoft, and Oracle as critical third parties to the financial system. That designation raises demand for demonstrable resilience, audit readiness, and concentration-risk controls in supplier offerings and buyer governance.
Recent Industry Developments in Cloud Infrastructure Services Market
- July 2026: Amazon Web Services announced expansion of its Asia Pacific (Hyderabad) Region data center capacity in India, linked to a long-horizon investment roadmap through 2030. The announcement supports in-country capacity for latency-sensitive and residency-aligned workloads, and it expands infrastructure supply for AI training and inference at regional scale.
- June 2026: Amazon Web Services introduced a new Local Zone in Athens, Greece, with general availability slated for July 2026. The added metro footprint supports lower-latency deployment patterns and offers a way for customers to balance centralized regions with localized data processing requirements.
- June 2025: Amazon announced a USD 13 billion investment in Australian data centers, paired with three solar farms to power operations. The build-out targets capacity growth while addressing energy sourcing constraints that increasingly influence hyperscaler expansion decisions.


Cloud Infrastructure Services Market Report Scope and Research Methodology
Market Definition and Coverage
For this methodology, the cloud infrastructure services market is defined as the revenue earned from delivering core cloud infrastructure capabilities (compute, storage, and networking) through public, private, or hybrid cloud environments for enterprise and public sector customers.
Scope exclusions: Excludes SaaS application subscriptions and most IT outsourcing services that do not provide underlying cloud infrastructure capacity.
Segments Covered in This Report
- By Service Type
- Compute as a Service
- Storage as a Service
- Networking as a Service
- Other Service Types (DaaS, Managed Hosting)
- By Deployment Model
- Public Cloud
- Private Cloud
- Hybrid Cloud
- By Organisation Size
- Large Enterprises
- Small and Medium-sized Enterprises
- By End-user Vertical
- IT and Telecommunications
- BFSI
- Retail
- Healthcare and Life Sciences
- Government
- Other End-user Verticals
- By Geography
- North America
- South America
- Europe
- Asia-Pacific
- Middle East and Africa
Data Sources, Market Sizing, and Validation
Desk Research
Desk research helped anchor the market to real-world demand signals and spending capacity before assumptions were set. We referred to public sources such as IT spending outlooks from the OECD, digital economy and ICT indicators from the World Bank, and macro and price indicators from the IMF to normalize multi-country comparisons.
To reflect the actual cloud build-out cycle, we also reviewed public materials including the ITU's connectivity indicators, NIST cloud and cybersecurity guidance, and technical publications from IEEE that describe infrastructure architecture and usage patterns. These were supplemented with company filings, investor presentations, earnings commentary, and credible press coverage to spot inflection points like GenAI-related infrastructure demand. Where needed for consistency across many providers, we used paid subscriptions for company financials and intelligence, plus patent databases and a news and financials feed to verify timelines and product positioning. The examples listed here are illustrative, and many other public and paid sources were also used for data collection, cross-checks, and clarification.
Primary Interviews and Surveys
Primary work tested what desk research could not explain reliably, especially pricing behavior, workload mix, and adoption speed by region and industry. We spoke with cloud infrastructure suppliers, channel and managed service partners, large buyers, and independent domain experts across APAC, EMEA, and the Americas, then used surveys to pressure-test key assumptions before finalizing the model.
Distribution of primary research fieldwork respondents
| Company type | Respondent position | Region |
|---|---|---|
| Top tier: 29% | CXOs: 16% | APAC: 44% |
| Mid tier: 55% | Functional/Unit leaders: 31% | EMEA: 36% |
| Smaller Players: 16% | Managers: 53% | Americas: 20% |
Market-Sizing & Forecasting
Market sizing starts with a top-down reconstruction of cloud infrastructure spend by linking enterprise IT budgets and cloud adoption patterns to infrastructure service consumption, then filtering it through regional and vertical demand intensity. The total is subsequently corroborated with selective bottom-up approximations, where sampled provider revenues, channel checks, and ASP times usage volumes are used to validate and adjust the aggregate value.
Key inputs in the model include indicators such as cloud workload migration pace, compute and storage consumption intensity, average price per instance or per GB-month trends, the mix shift toward GPU-enabled capacity, and the rate of new data center capacity additions that support cloud regions. Where the picture is incomplete for smaller suppliers, the gap is handled using proxy variables such as customer mix and regional penetration, which are then verified through primary feedback to ensure totals are not overstated.
For forecasting, scenario analysis is used because growth depends on macro conditions and the timing of large infrastructure rollouts. Variables such as IT spending growth, cloud adoption by industry, pricing trajectories, and capacity expansion plans are projected forward, and then expert views are used to select realistic paths for each region before producing a final blended outlook.
Data Validation & Update Cycle
Validation is done through several checks so the output remains consistent with observable market signals. We compare the final totals against independent indicators such as public cloud spending series, reported infrastructure services revenue trends, and capacity expansion announcements, and then investigate any variance that appears too large to be explained by pricing or mix.
Before sign-off, anomalies are reviewed in a multi-step analyst pass, where assumptions are re-checked and, when needed, experts are re-contacted to clarify changes in pricing, demand, or reporting. Reports are refreshed annually, and interim updates are completed when material events occur that can shift the outlook. Right before delivery, a final review pass is performed so clients receive the latest updated view.
Mordor Intelligence's Cloud Infrastructure Services Market Size Compared With Other Published Estimates
Published market numbers for cloud infrastructure services often do not match because the service basket is not defined the same way, and year and currency timing can also shift results. Differences also show up when some estimates lean heavily on vendor-reported growth narratives without enough cross-checks from demand and capacity signals.
SaaS application spending sits outside Mordor Intelligence's scope for this market, and this single exclusion can move totals by a wide margin when other sources report broader public cloud spend. Another common gap comes from how providers are counted, where some sources focus on only the biggest global platforms, while others include a long tail of regional infrastructure providers and private cloud operators. We also see variance based on how pricing is trended, since GPU-related demand can lift average spend per workload, and not all models refresh those assumptions at the same cadence.
Benchmark comparison
| Source | Market Size | Gaps in Research Methodology |
|---|---|---|
| Mordor Intelligence | USD 377.07 B (2026) | |
| Trade Journal A | USD 330.40 B (2024) | Uses a narrower cloud infrastructure revenue framing tied to quarterly tracking, and it can undercount private cloud and smaller regional providers, which makes its total less comparable to a broader service-coverage model. |
| Press Release B | USD 171.80 B (2024) | Limits the scope to IaaS public cloud services, which excludes adjacent infrastructure platform components and private or hybrid deployments, so it reports a smaller subset of the overall infrastructure services market. |
The spread in the table is mostly explained by what is included and the year being quoted, rather than by math errors. When the scope is tightened to only IaaS public cloud, the value drops sharply, and when coverage is broadened to full infrastructure services across deployment types, the value rises. Our process keeps the estimate traceable to clear demand drivers, pricing logic, and repeatable checks that can be revisited as the market shifts.


Key Questions Answered in the Report
What is the current value of the cloud infrastructure services market?
The market reached USD 377.07 billion in 2026 and is forecast to climb to USD 871.48 billion by 2031 at an 18.21% CAGR.
Which service type leads revenue today?
Compute as a Service held 45.72% of 2025 revenue, reflecting enterprise demand for elastic processing power.
Why is Asia-Pacific the fastest-growing region?
Massive investments in 5G, data-center capacity, and government digital programs are propelling a 23.41% regional CAGR through 2031.
How are sovereignty regulations affecting cloud strategies?
New laws such as the EU Data Act mandate in-region data storage and fee-free portability, steering workloads toward sovereign clouds and hybrid deployments.
What is the biggest restraint on market growth?
Ongoing shortages of advanced GPUs and high-bandwidth memory chips, combined with supply-chain bottlenecks, limit capacity expansion and slow new region launches.
Which vertical will see the fastest growth through 2031?
Healthcare and Life Sciences is expected to register a 24.38% CAGR as hospitals migrate electronic health records and AI-enabled diagnostics to compliant cloud platforms.
Page last updated on:


 Your data is secure and never sold or shared.


