Private Cloud Market Size and Share
Market Overview
| Study Period | 2020 - 2031 |
|---|---|
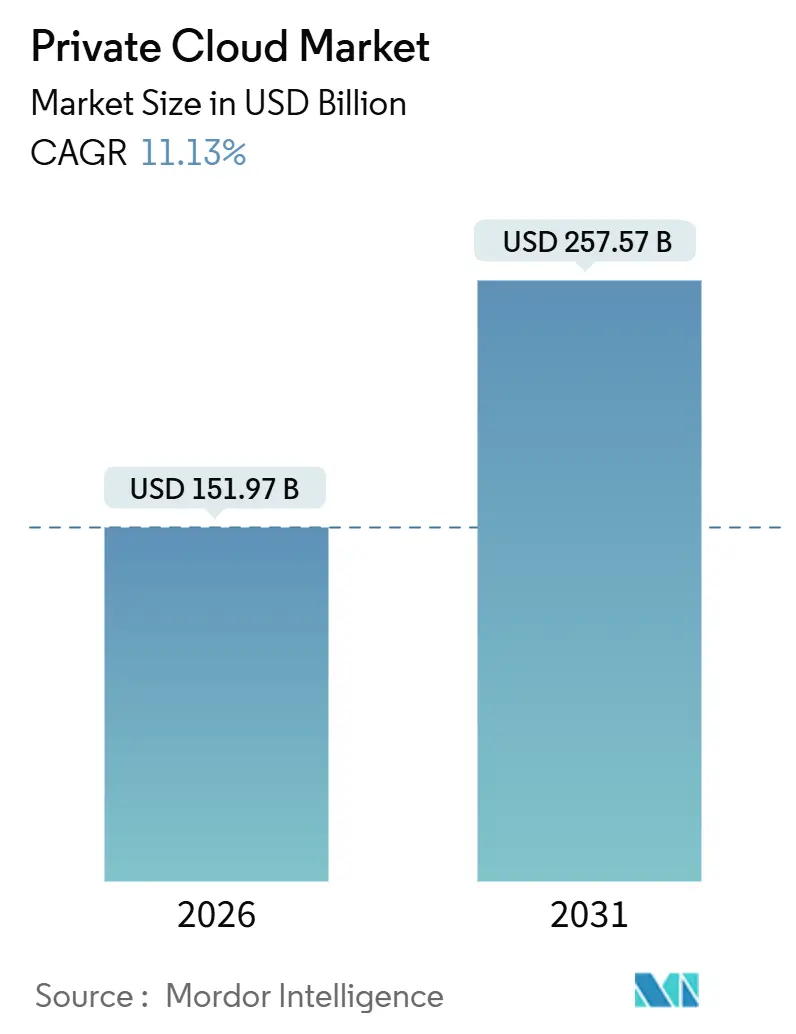
| Market Size (2026) | USD 151.97 Billion |
| Market Size (2031) | USD 257.57 Billion |
| Growth Rate (2026 - 2031) | 11.13% CAGR |
| Fastest Growing Market | Asia Pacific |
| Largest Market | North America |
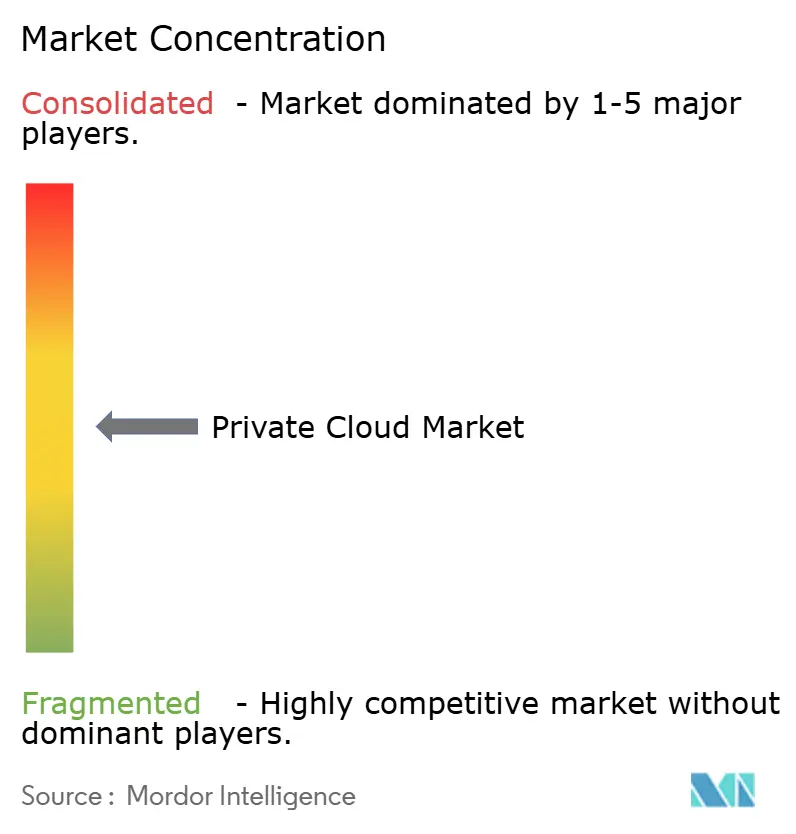
| Market Concentration | Medium |
Major Players
*Disclaimer: Major Players sorted in no particular order Image © Mordor Intelligence. Reuse requires attribution under CC BY 4.0. |
|
Private Cloud Market Analysis by Mordor Intelligence
The private cloud market reached USD 151.97 billion in 2026 and is projected to rise to USD 257.57 billion by 2031, reflecting an 11.13% compound annual growth rate (CAGR). This expansion is propelled by enterprises that want end-to-end control over infrastructure, the economics of artificial-intelligence workloads, mandatory data-residency laws, and the mounting unpredictability of public-cloud egress charges. Growing preference for Infrastructure-as-Code, turnkey Kubernetes stacks, and edge-to-core latency objectives is attracting investment from both hyperscalers and traditional server manufacturers. At the same time, subscription-price hikes for established virtualization software are prompting fresh evaluations of open-source hypervisors and container platforms, sharpening competitive dynamics inside the private cloud market. Both large enterprises and a widening base of small and medium-sized enterprises (SMEs) now view dedicated environments as a strategic hedge against cost overruns, talent shortages, and compliance complexity, setting the stage for steady multi-year growth.
Key Report Takeaways
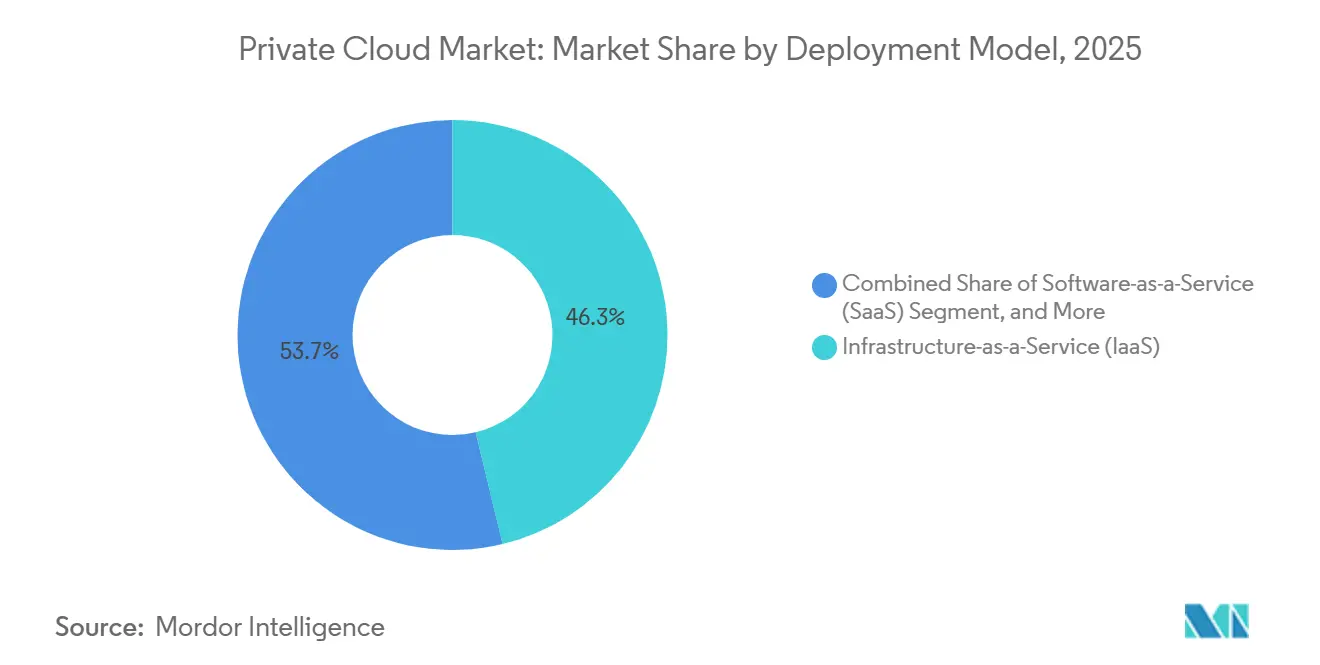
- By deployment model, Infrastructure-as-a-Service captured 46.26% of private cloud market share in 2025, while Platform-as-a-Service is advancing at an 11.64% CAGR through 2031.
- By enterprise size, large enterprises held 61.53% of private cloud market share in 2025, whereas SMEs are expanding at a 12.89% CAGR to 2031.
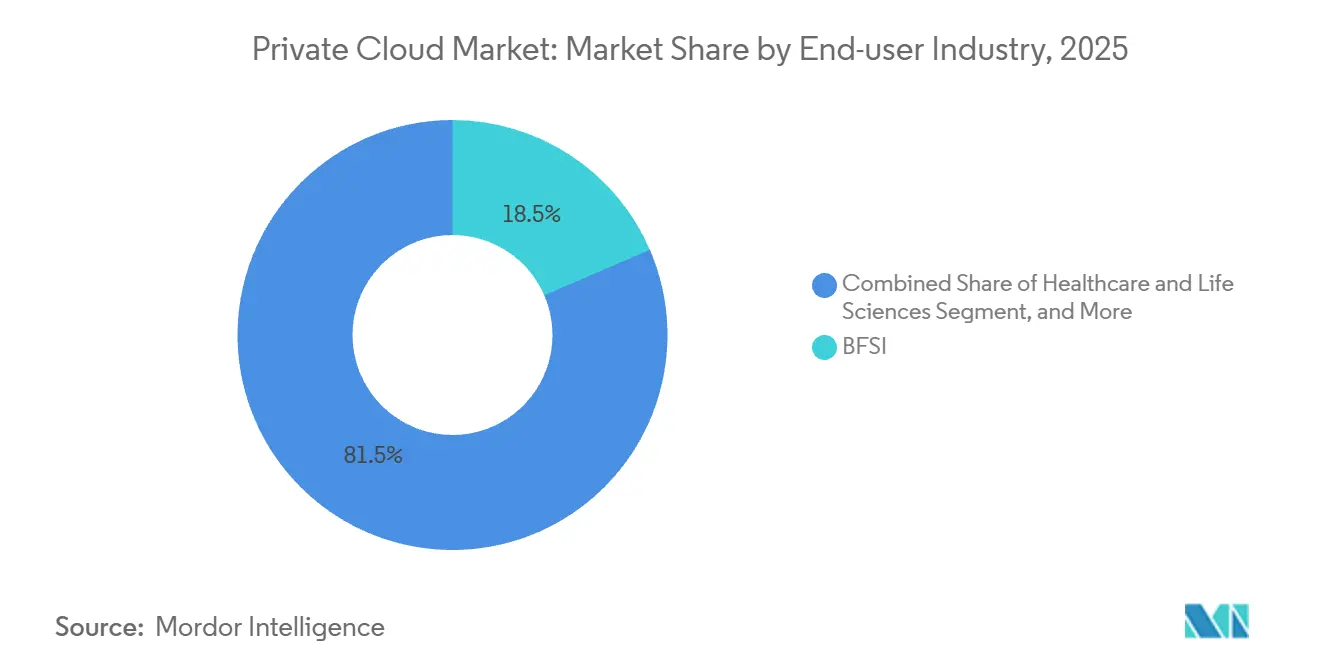
- By end-user industry, banking, financial services, and insurance led with 18.51% revenue share in 2025; healthcare and life sciences is forecast to expand at a 12.19% CAGR through 2031.
- By hosting type, on-premises dedicated infrastructure accounted for 56.73% of the private cloud market size in 2025, and managed or hosted private cloud is growing at a 12.53% CAGR.
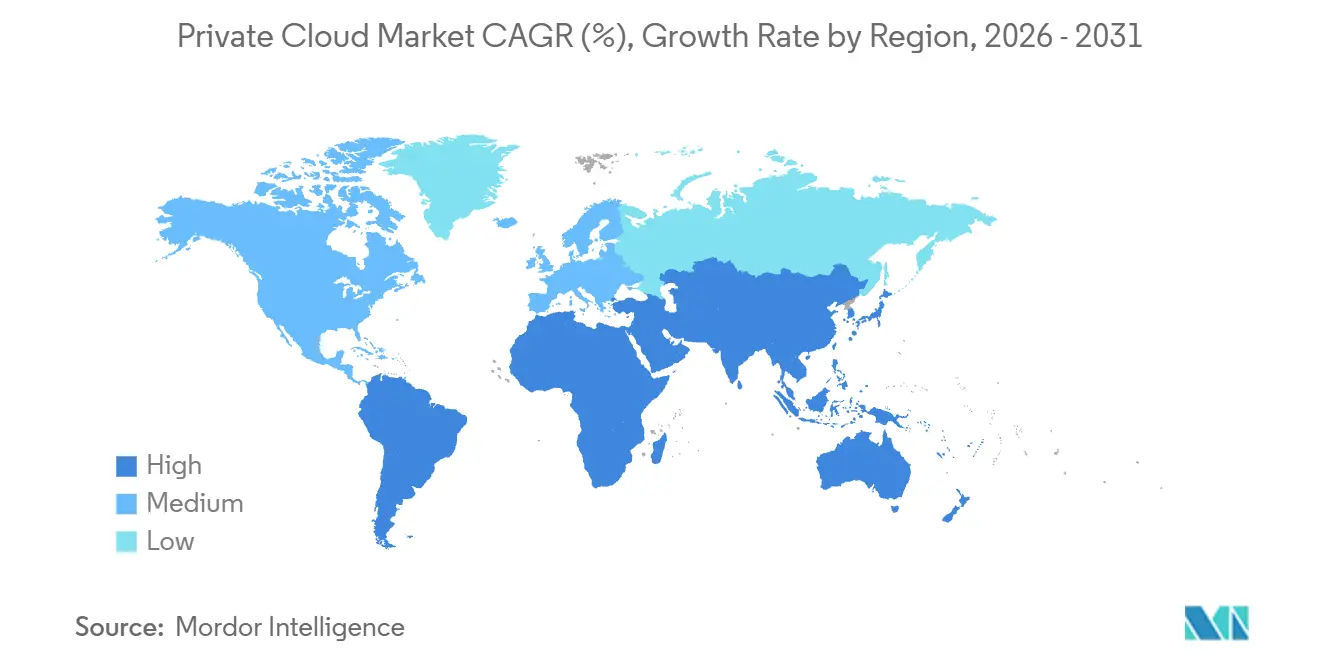
- By geography, North America commanded 38.31% of revenue in 2025, while Asia Pacific is on track for a 12.61% CAGR during the forecast period.
Note: Market size and forecast figures in this report are generated using Mordor Intelligence’s proprietary estimation framework, updated with the latest available data and insights as of January 2026.
Global Private Cloud Market Trends and Insights
Drivers Impact Analysis*
| Driver | (~) % Impact on CAGR Forecast | Geographic Relevance | Impact Timeline |
|---|---|---|---|
| Accelerating AI/Gen-AI workload repatriation to private clouds | +2.8% | North America, Europe, China | Medium term (2-4 years) |
| Mandatory data-sovereignty rules | +2.3% | China, GCC, European Union, India | Long term (≥ 4 years) |
| Edge-to-core latency reduction needs in Industry 4.0 plants | +1.7% | China, Japan, South Korea, Germany, United States | Medium term (2-4 years) |
| Cost predictability versus escalating public-cloud egress fees | +2.1% | Global | Short term (≤ 2 years) |
| Kubernetes-native private PaaS bundles from server OEMs | +1.4% | North America, Western Europe | Medium term (2-4 years) |
| Telco 5G slicing driving on-prem hosted private-cloud demand | +0.9% | South Korea, Japan, Germany, United States | Long term (≥ 4 years) |
| Source: Mordor Intelligence | |||
Accelerating AI/Gen-AI Workload Repatriation
Enterprises are moving large-language-model inference and training tasks from public clouds to dedicated infrastructure in order to eliminate data-transfer fees and to amortize GPU capital costs across longer depreciation schedules. In 2025, many organizations reported 40%-60% savings after shifting inference pipelines to on-premises clusters that co-locate storage and compute resources. Turnkey bundles such as GPT-in-a-Box, which packages H100 GPUs with hyperconverged software, accelerate time-to-production for sensitive models that must stay within national borders. Adoption is particularly strong in jurisdictions that enforce audit trails for model lineage, encouraging private deployments that simplify compliance documentation. These dynamics are creating sustained momentum for the private cloud market across regulated industries and data-intensive research settings.[1]Broadcom, “Cloud Repatriation Survey 2025,” broadcom.com
Mandatory Data-Sovereignty Rules
Data-localization mandates compel personal or sensitive information to remain inside national boundaries, favoring infrastructure that enterprises can physically audit. China’s Data Security Law, Europe’s privacy framework, and emerging legislation in India and the Gulf Cooperation Council are driving region-specific private clouds that avoid cross-border transfer assessments. State-owned banks, healthcare networks, and public agencies are procuring sovereign facilities that offer complete operational oversight. As a result, the private cloud market is seeing strong multi-year contracts that bundle hardware, software, and managed services, especially in countries that treat critical data as a strategic asset.
Cost Predictability Versus Egress Fees
Public-cloud providers often charge USD 0.09-USD 0.12 per gigabyte to move data out of their regions, creating substantial bills for video streaming, genomics analysis, and telemetry pipelines. In 2025, a Harvard Business School case study documented millions of dollars in monthly egress expenses at a single financial-services firm. By relocating storage and compute to private clouds, the same workload eliminated unpredictable charges and reduced exposure to traffic-based pricing models. Consumption-based private offerings now bundle bandwidth into flat per-node or per-container rates, allowing finance teams to forecast unit costs with greater precision and bolstering adoption across cost-sensitive verticals.
Edge-to-Core Latency Reduction Needs
Industry 4.0 deployments require sub-10 millisecond round-trip times for autonomous robots, vision-based quality control, and predictive maintenance. Public-cloud regions are typically hundreds of kilometers away from factory floors, adding unacceptable jitter. Edge private clouds place ruggedized servers within or near production sites, bringing analytics, control loops, and digital-twin simulations closer to operational technology systems. Alliances between global carriers and industrial-automation vendors are rolling out hardened clusters that meet temperature, vibration, and dust-resilience standards, further widening the addressable private cloud market in manufacturing hubs.
Restraints Impact Analysis*
| Restraint | (~) % Impact on CAGR Forecast | Geographic Relevance | Impact Timeline |
|---|---|---|---|
| Scarcity of multi-cloud FinOps and SRE talent | -1.2% | North America, Western Europe | Short term (≤ 2 years) |
| Rising software subscription costs after virtualization-licensing changes | -1.5% | Global VMware installed base | Short term (≤ 2 years) |
| Vendor lock-in risk in single-stack private-cloud appliances | -0.8% | Global | Medium term (2-4 years) |
| Complex regulatory overlap across PCI-DSS, HIPAA, and GDPR | -0.7% | Multi-jurisdiction enterprises | Long term (≥ 4 years) |
| Source: Mordor Intelligence | |||
Rising Software Subscription Costs
The shift from perpetual licenses to subscription bundles in 2024-2025 raised annual invoices for many virtualization customers by anywhere from 150% to 600%. Sudden true-up audits penalized workloads that exceeded core entitlements, forcing IT departments to freeze expansion projects until budget cycles stabilize. These unplanned increases slow near-term hardware refreshes and encourage evaluations of KVM-based platforms, Red Hat OpenShift Virtualization, and other open-source stacks. However, migration risk limits immediate defection, tempering the overall pace at which the private cloud market can absorb new workloads.
Scarcity of FinOps and SRE Talent
Cloud-infrastructure architect postings outnumber qualified applicants by more than three to one in North America, and demand for site-reliability engineers with multi-cloud cost-optimization expertise outstrips supply across Europe. Median salaries above USD 180,000 place such roles beyond many mid-market budgets. As a result, deployments often lack staff who can manage infrastructure-as-code pipelines, Kubernetes lifecycle automation, and detailed chargeback reporting. Enterprises therefore turn to managed-service providers, yet many remain reluctant to offload critical systems, prolonging hiring gaps that slow the rollout of new private environments.
*Our forecasts treat driver/restraint impacts as directional, not additive. The impact forecasts reflect baseline growth, mix effects, and variable interactions.
Segment Analysis
By Deployment Model: PaaS Bundles Reshape Private Infrastructure
Platform-as-a-Service workloads are expanding at an 11.64% CAGR through 2031, outpacing the infrastructure-centric 46.26% share held by IaaS in 2025. The private cloud market size for PaaS is rising as Red Hat OpenShift, VMware Tanzu, and similar offerings package Kubernetes orchestration, CI/CD pipelines, and observability tools into unified control planes that span on-premises and public regions.[2]Red Hat, "OpenShift Private Cloud Deployments," redhat.com Early adopters highlight the ability to port declarative manifests across virtual-machine clusters and bare-metal nodes without rewriting application code, cutting deployment times for microservices architectures.
IaaS remains foundational because legacy three-tier databases and message queues still depend on virtual machines to satisfy regulatory audits such as PCI-DSS and HIPAA. Enterprises frequently run hybrid environments where stateful data stores sit on VMs while stateless services execute in containers, allowing gradual refactoring over multiple budget cycles. Server manufacturers now bundle hypervisor and Kubernetes management consoles into single racks, letting operations teams shift workloads between VMs and containers as application maturity advances, an approach that stabilizes the private cloud market during modernization projects.


By Enterprise Size: SMEs Embrace Consumption Models
Large enterprises controlled 61.53% of spending in 2025, but SMEs are growing nearly three times faster at 12.89% annually as consumption-based offerings remove capital-expense barriers. Subscription models such as HPE GreenLake and Dell APEX invoice monthly for actual CPU, memory, and storage utilization, including automated hardware refresh cycles. For midsize organizations, this predictability compresses procurement lead times and frees up cash for software innovation rather than facilities upgrades.
The private cloud market size in large enterprises remains dominant because multinational footprints, regional compliance obligations, and complex application portfolios require dedicated infrastructure. Typical Fortune 500 organizations operate more than three private environments, segmented by geography or business unit. These firms increasingly federate on-premises clusters with Outposts or Azure Stack instances, orchestrating placement through centralized dashboards that balance latency, cost, and regulatory policies.
By End-User Industry: Healthcare Accelerates Compliance-Driven Adoption
Banking, financial services, and insurance captured 18.51% of revenue in 2025, yet healthcare and life sciences is the fastest mover with a 12.19% CAGR through 2031. Hospitals migrating electronic health records prefer hardware they can physically audit to meet HIPAA physical-safeguard rules. Genomics labs also lean toward on-premises clusters to avoid egress fees tied to petabyte-scale sequencing archives. Private clouds therefore allow laboratories to comply with strict disclosure requirements while retaining low-latency access to sensitive datasets.
Financial institutions continue to prioritize private clouds for low-latency trading systems and card-data environments that demand audited network segmentation. A leading global bank disclosed more than 200,000 virtual machines across a dozen facilities dedicated to payment processing. Elsewhere, manufacturing, telecommunications, and logistics companies adopt edge private clouds to satisfy real-time control loops and 5G core requirements, collectively diversifying the private cloud market across verticals.
By Hosting Type: Managed Services Gain Traction
On-premises dedicated infrastructure accounted for 56.73% of hosting-type revenue in 2025, yet managed and hosted private clouds are advancing at a 12.53% CAGR as organizations look to offload day-two operations. Partnerships between colocation providers and software vendors now offer turnkey racks that come pre-provisioned with Nutanix AHV or VMware vSphere and include monitoring, patching, and capacity scaling. The model lets customers retain single-tenant hardware while outsourcing routine maintenance.
Virtual private clouds within public-hyperscaler regions grow more slowly due to limited audit transparency. Conversely, consumption-based racks located at carrier-neutral facilities bridge the gap by keeping data physically isolated while providing elastic burst capacity during seasonal peaks. As software-defined networking overlays mature, enterprises can extend layer-2 adjacency across on-premises cores and managed sites, blending control with operational efficiency and sustaining momentum in the private cloud market.
Geography Analysis
North America accounted for the 38.31% share of private cloud market revenue in 2025, reflecting advanced enterprise IT maturity and a regulatory environment that favors infrastructure segregation for high-sensitivity workloads. Federal agencies now require FedRAMP High environments for sensitive-but-unclassified data, channeling multi-year spending toward audited private clouds that meet stringent access-control benchmarks.[3]Cybersecurity and Infrastructure Security Agency, "Federal Cloud Migration Directive 2024," cisa.gov Financial institutions add momentum by deploying latency-critical trading applications inside dedicated racks located a few kilometers from exchange matching engines.
Asia Pacific shows the strongest growth potential through 2031, expanding at a 12.61% CAGR during the forecast period, buoyed by data-residency requirements and ambitious digital-transformation programs. China’s data-security laws restrict cloud providers that cannot guarantee in-country data storage, while India’s forthcoming privacy legislation is encouraging domestic implementations within local data centers. Server makers in the region are responding with sovereign-certified appliances that integrate national cryptography standards and support local languages, lowering adoption barriers for state-owned banks and healthcare providers.
Europe’s outlook remains steady as the region reconciles cross-border data flows with privacy obligations under evolving regulations. Many enterprises deploy geographically segmented private clouds to limit exposure to complex transfer-impact assessments. Initiatives such as Gaia-X advocate federated frameworks that prioritize open APIs and transparent governance, further stimulating demand for hardware and software ecosystems that align with European legal traditions. The Middle East and Africa, while smaller in absolute revenue, are seeing accelerated uptake thanks to government-backed sovereign-cloud policies designed to localize digital infrastructure and to bolster national cyber-resilience.

Competitive Landscape
The top five vendors (AWS, Microsoft, Dell, HPE, and Nutanix) accounted for roughly 45%-50% of infrastructure revenue in 2025. Hyperscalers aim to expand on-premises footprints by subsidizing appliances such as Outposts and Azure Stack in exchange for multi-year usage commitments, knitting private workloads into broader public cloud ecosystems. Traditional equipment manufacturers counter with multi-hypervisor platforms that emphasize portability and avoid single-vendor lock-in, appealing to customers wary of escalating subscription costs.
Edge computing creates white-space opportunities for specialized integrators that design ruggedized enclosures and components for the industrial-temperature range. New entrants, including vertically integrated rack vendors, offer cloud-in-a-rack systems that eliminate the need for organizations to assemble their own stacks, compressing deployment timelines from months to weeks. AI infrastructure remains a key differentiator: suppliers race to bundle high-performance GPUs, vector databases, and model-serving frameworks into turnkey solutions that comply with strict data-governance mandates.
Sustainability also influences buying decisions, especially in regions preparing for carbon-reporting regulations. Vendors tout liquid-cooled server designs and power-usage-effectiveness figures below 1.2 to secure procurement in new and retrofitted facilities. Compliance pedigrees ranging from HIPAA attestations to PCI-DSS certifications continue to tip the scales in heavily regulated verticals, underscoring the linkage between audit readiness and long-term share in the private cloud market.
Private Cloud Industry Leaders
-
Amazon Web Services
-
Microsoft Corporation
-
IBM Corporation
-
Broadcom Inc.
-
Dell Technologies Inc.
- *Disclaimer: Major Players sorted in no particular order

Recent Industry Developments
- December 2025: Microsoft announced general availability of Azure Stack HCI 24H2, adding Arc-enabled Kubernetes and NVIDIA H200 GPU support for on-premises generative-AI workloads in New York and London financial institutions.
- November 2025: Hewlett Packard Enterprise expanded GreenLake with AI Essentials, bundling NVIDIA A100 and H100 clusters and securing three Fortune 100 manufacturing deployments in Germany, Japan, and Texas.
- October 2025: Alibaba Cloud launched Apsara Stack 2.0, featuring quantum-safe encryption and compliance modules for China’s Multi-Level Protection Scheme 2.0 with USD 300 million in initial orders.
- September 2025: Dell Technologies introduced APEX Cloud Platform for Red Hat OpenShift, delivering 99.99% uptime SLAs aimed at 5G core networks.


Research Methodology Framework and Report Scope
Market Definitions and Key Coverage
The study defines the private cloud market as all revenue generated from software, infrastructure, and managed services that are provisioned for the exclusive use of one enterprise, whether hosted on-premises or in a dedicated third-party facility, and delivered through virtualization or container platforms.
Scope Exclusion: public multi-tenant clouds and pure colocation contracts fall outside this boundary.
Segmentation Overview
-
By Deployment Model
- Software-as-a-Service (SaaS)
- Platform-as-a-Service (PaaS)
- Infrastructure-as-a-Service (IaaS)
-
By End-user Enterprise Size
- Small and Medium-sized Enterprises (SMEs)
- Large Enterprises
-
By End-user Industry
- BFSI
- Healthcare and Life Sciences
- Government and Public Sector
- Manufacturing and Industrial
- IT and Telecommunications
- Retail and E-commerce
-
By Hosting Type
- On-premises Dedicated Private Cloud
- Virtual Private Cloud (VPC)
- Managed/Hosted Private Cloud
-
By Geography
-
North America
- United States
- Canada
- Mexico
-
South America
- Brazil
- Argentina
- Rest of South America
-
Europe
- Germany
- United Kingdom
- France
- Italy
- Spain
- Russia
- Rest of Europe
-
Asia-Pacific
- China
- Japan
- India
- South Korea
- Australia and New Zealand
- Rest of Asia-Pacific
-
Middle East and Africa
-
Middle East
- Saudi Arabia
- United Arab Emirates
- Turkey
- Rest of Middle East
-
Africa
- South Africa
- Nigeria
- Egypt
- Rest of Africa
-
Middle East
-
North America
Detailed Research Methodology and Data Validation
Primary Research
Mordor Intelligence interview teams spoke with cloud architects, procurement heads, and managed-service partners across North America, Europe, Asia-Pacific, and the Middle East to verify workload migration rates, price-performance thresholds, and regulatory triggers shaping private cloud adoption. These conversations helped us bridge data gaps around hybrid deployment mixes and refine the adoption curves surfaced during desk work.
Desk Research
Our analysts extracted baseline demand indicators from publicly available tier-1 sources such as the US National Institute of Standards and Technology (NIST) for cloud standards, International Telecommunication Union data on enterprise connectivity, Eurostat structural business statistics, the Uptime Institute's annual data-center survey, and regional trade association filings on IT spending patterns. Company 10-Ks, earnings transcripts, and technology vendor price lists were mined to gauge average selling prices, margin trends, and shipment volumes.
Subscription resources from D&B Hoovers and Dow Jones Factiva supplied historical revenue splits and strategic moves of major suppliers, while Questel patent records highlighted innovation pacing in hyper-converged nodes. The sources cited here are illustrative; many additional open datasets and archival materials support validation and context building.
Market-Sizing & Forecasting
A top-down construct starts with enterprise IT hardware and service expenditure, which is then filtered through workload virtualization ratios and private-cloud penetration by industry. Select bottom-up roll-ups, sampled rack shipments, hypervisor licence counts, and managed-hosting contract values are used to corroborate and adjust totals. Key variables modeled include x86 rack server ASPs, average core density, software-defined storage attach rates, sector-specific compliance spending, and regional electricity costs that influence TCO. Multivariate regression coupled with scenario analysis projects these drivers through 2030, while any residual data gaps are smoothed using weighted averages from primary interviews.
Data Validation & Update Cycle
Model outputs undergo multi-step variance checks versus external spend trackers and capacity-utilization polls. Senior analysts review anomalies before sign-off. We refresh every twelve months, and an interim sweep is triggered when sizable M&A, regulatory, or macro events occur, ensuring clients receive a living dataset.
Why Mordor's Private Cloud Baseline Commands Confidence
Published estimates often diverge because firms pick different deployment mixes, currency bases, or refresh cadences. Buyers can be left puzzled when numbers do not align.
Key gap drivers include whether hosted managed environments are pooled with on-premises builds, how aggressively future ASP erosion is baked in, and if shadow IT budgets are excluded. Our disciplined scoping, annual refresh rhythm, and dual-path validation keep Mordor's figure centered and reproducible, whereas others may lean on single-path extrapolations or wider workload umbrellas.
Benchmark comparison
| Market Size | Anonymized source | Primary gap driver |
|---|---|---|
| USD 136.51 B (2025) | Mordor Intelligence | - |
| USD 124.80 B (2024) | Global Consultancy A | Merges virtual private cloud with colocation, uses five-year-old price deck |
| USD 134.00 B (2025) | Research Firm B | Excludes managed-hosted offerings and applies flat regional growth factor |
| USD 107.28 B (2024) | Trade Journal C | Limits scope to infrastructure services, omits software and support layers |
In short, Mordor Intelligence delivers a balanced baseline grounded in transparent variables, cross-checked by industry voices and refreshed on a predictable cycle, letting decision-makers act with higher conviction.


Key Questions Answered in the Report
What is the projected value of the private cloud market by 2031?
The market is expected to reach USD 257.57 billion by 2031.
Which deployment model is growing fastest in private clouds?
Platform-as-a-Service workloads are expanding at an annual 11.64% CAGR thanks to turnkey Kubernetes bundles.
Why are SMEs adopting private clouds more rapidly than large enterprises?
Consumption-based pricing eliminates upfront capital expense, letting SMEs pay monthly for actual usage.
How do data-sovereignty laws impact private cloud adoption in Asia Pacific?
Regulations that restrict cross-border data flows compel enterprises to deploy infrastructure located within national borders, boosting regional demand.
What restraint most affects near-term private cloud expansion?
Rising subscription costs for virtualization software are delaying some hardware refresh cycles as organizations evaluate alternatives.
Which industry vertical is projected to grow fastest through 2031?
Healthcare and life sciences will expand at a 12.19% CAGR as electronic health records and genomics workloads require compliant, low-latency infrastructure.
Page last updated on:


