Public Cloud Market Size and Share
Market Overview
| Study Period | 2020 - 2031 |
|---|---|
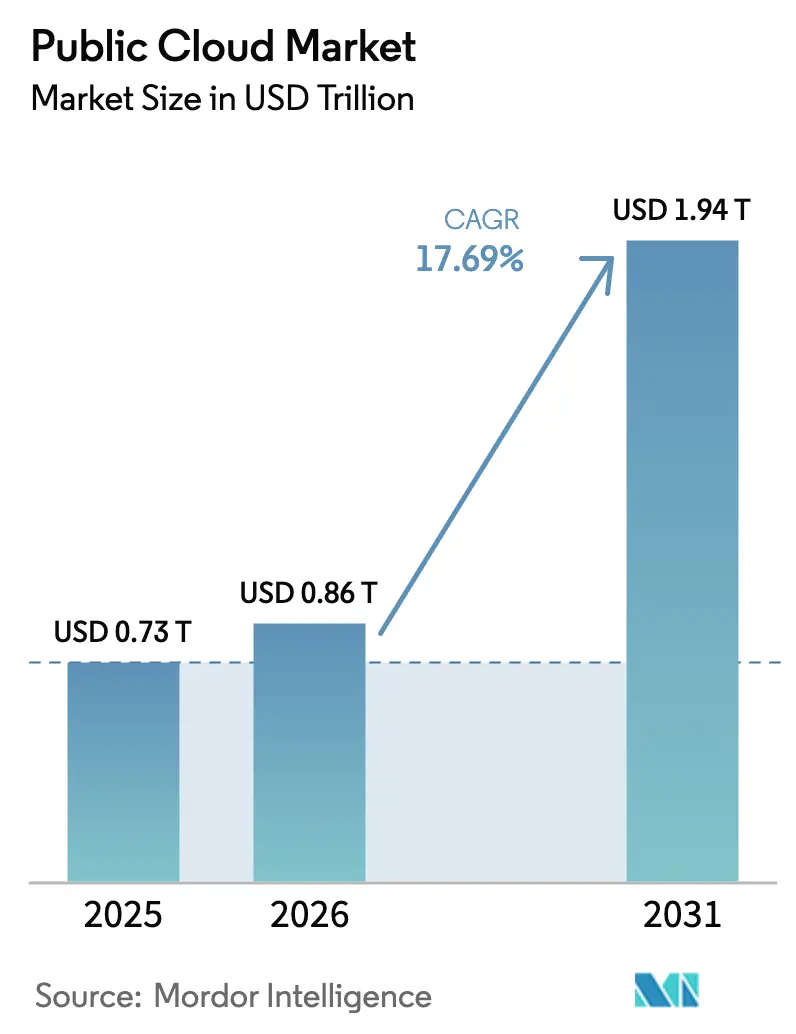
| Market Size (2026) | USD 0.86 Trillion |
| Market Size (2031) | USD 1.94 Trillion |
| Growth Rate (2026 - 2031) | 17.69% CAGR |
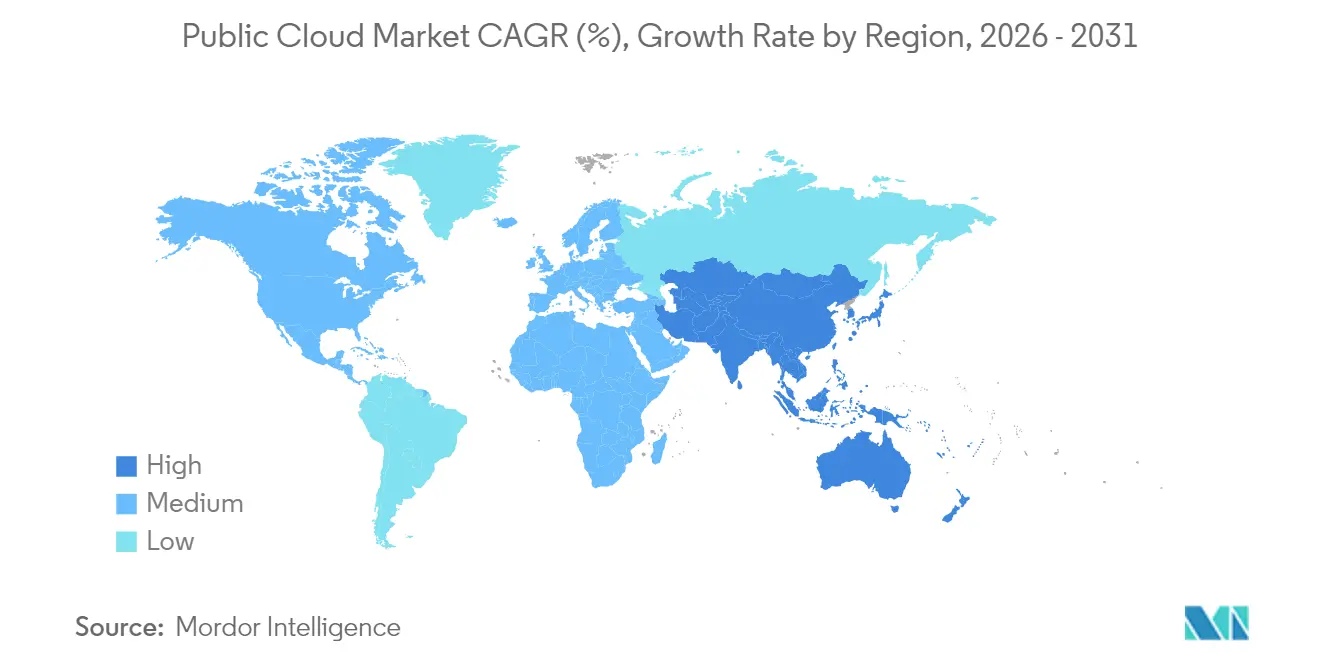
| Fastest Growing Market | Asia Pacific |
| Largest Market | North America |
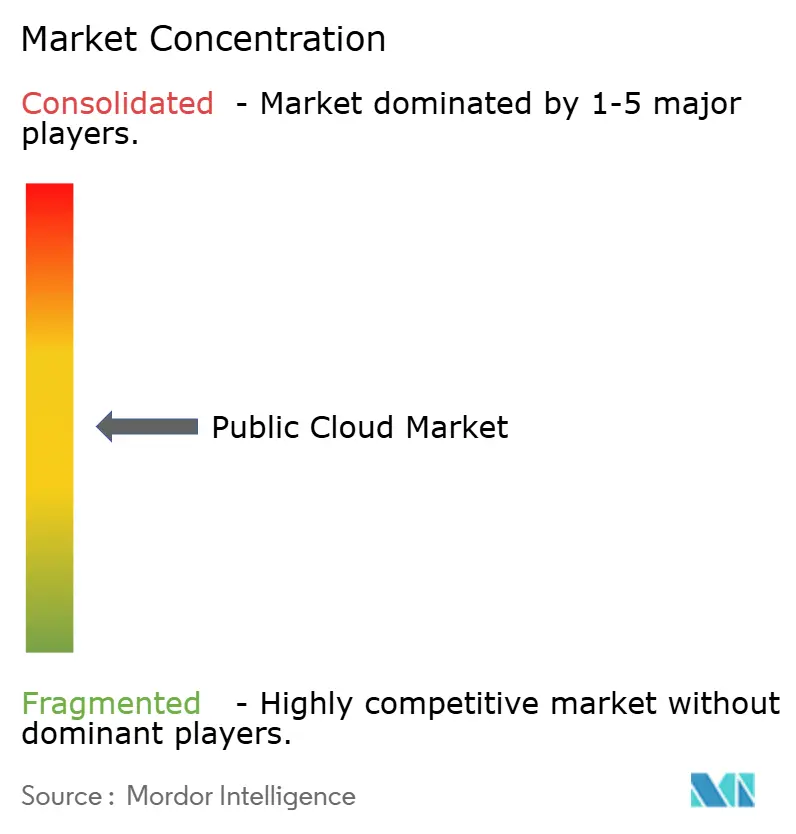
| Market Concentration | Medium |
Major Players *Disclaimer: Major Players sorted in no particular order Image © Mordor Intelligence. Reuse requires attribution under CC BY 4.0. | |
Public Cloud Market Analysis by Mordor Intelligence
Public Cloud Market size in 2026 is estimated at USD 0.86 trillion, growing from 2025 value of USD 0.73 trillion with 2031 projections showing USD 1.94 trillion, growing at 17.69% CAGR over 2026-2031. This expansion reflects enterprises’ wholesale transition from legacy IT stacks to AI-ready infrastructure that treats the cloud as a competitive differentiator rather than a cost-saving utility. Intensifying demand for generative-AI workloads, green-datacenter incentives, and sovereign-cloud mandates underpin the sector’s growth. Hyperscale providers are investing in localized availability zones to satisfy regulatory requirements, while chip manufacturers ramp up supply to ease bottlenecks that constrained 2024 capacity. Competitive dynamics are shifting toward ecosystem partnerships that bundle infrastructure, platforms, and application-layer intelligence, allowing enterprises to accelerate time-to-value and de-risk AI adoption.
Key Report Takeaways
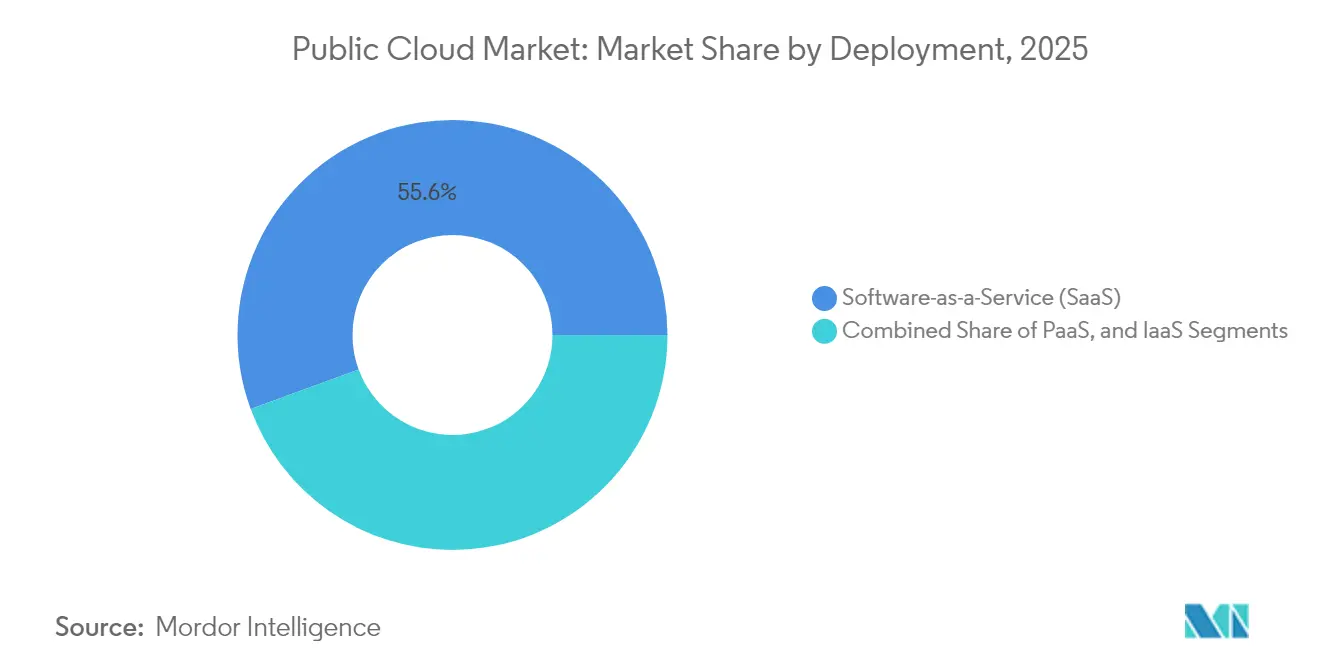
- By deployment model, Software-as-a-Service (SaaS) led with 55.60% of the public cloud market share in 2025, whereas Platform-as-a-Service (PaaS) is on track to post a 19.08% CAGR through 2031.
- By organization size, large enterprises held 67.40% of the public cloud market share in 2025; small and medium enterprises (SMEs) represent the fastest trajectory at a 17.92% CAGR.
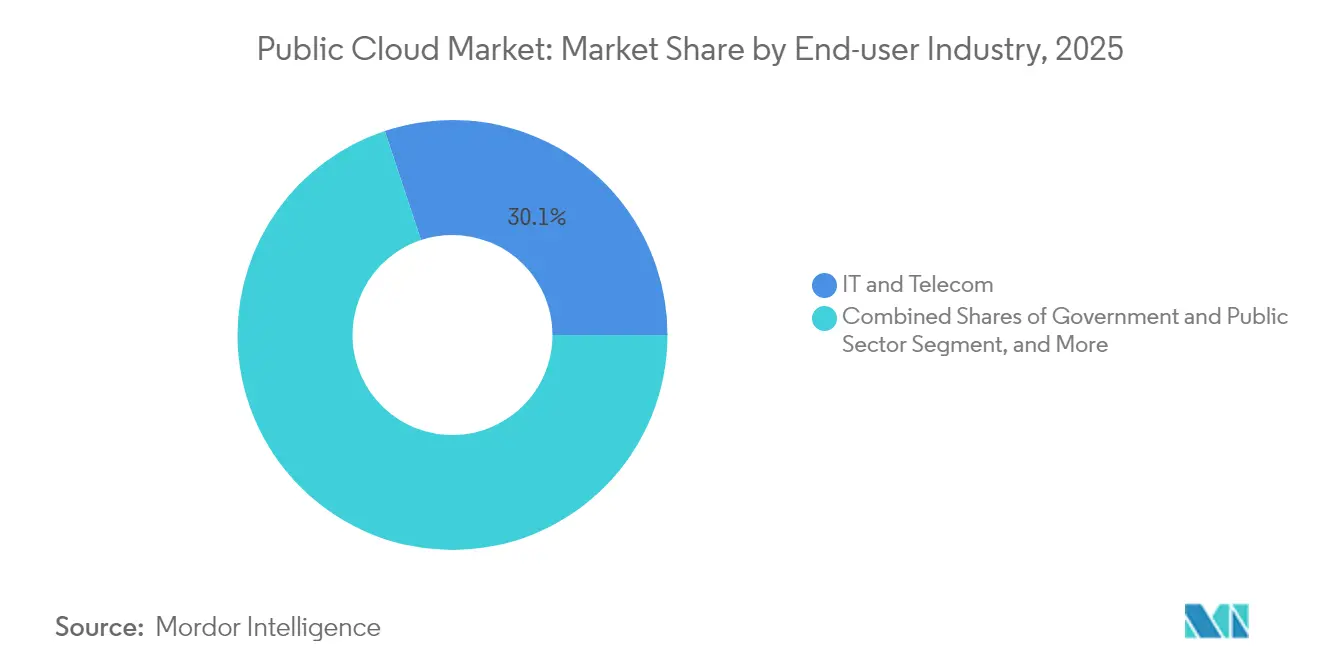
- By end-user industry, IT and Telecom commanded 30.10% revenue share of the public cloud market size in 2025, while manufacturing is projected to grow at 20.94% CAGR between 2026-2031.
- By geography, North America retained 43.75% of the public cloud market in 2025; Asia-Pacific is projected to expand at 18.12% CAGR through 2031.
Note: Market size and forecast figures in this report are generated using Mordor Intelligence’s proprietary estimation framework, updated with the latest available data and insights as of 2026.
Global Public Cloud Market Trends and Insights
Drivers Impact Analysis*
| Driver | (~) % Impact on CAGR Forecast | Geographic Relevance | Impact Timeline |
|---|---|---|---|
| AI-led workload migration boom | +4.2% | Global; strong in North America and APAC | Medium term (2-4 years) |
| GenAI-optimized chip supply ramp-up | +3.1% | Global; led by North America and Europe | Short term (≤ 2 years) |
| Hyperscale price-performance wars | +2.8% | Global | Short term (≤ 2 years) |
| Sovereign-cloud mandates | +2.4% | APAC core; spill-over to Europe and MEA | Long term (≥ 4 years) |
| Green datacenter tax credits | +1.7% | North America and Europe; emerging in APAC | Medium term (2-4 years) |
| Cloud-adjacent AI accelerators demand | +1.3% | Global; developed markets | Medium term (2-4 years) |
| Source: Mordor Intelligence | |||
AI-led workload migration boom
Manufacturing, banking, and healthcare organizations have moved beyond pilots to production-scale AI, propelling wholesale shifts into the public cloud market. BMW migrated 6,000 applications to SAP S/4HANA on cloud infrastructure,[1]“BMW Moves 6,000 Apps to SAP S/4HANA,” sap.com and JPMorgan Chase transferred 1 exabyte of data to AWS under a USD 17 billion annual technology budget. Ninety-three percent of manufacturers launched fresh AI projects in 2024, confirming that cloud-hosted AI is now a strategic imperative rather than an experiment.
GenAI-optimized chip supply ramp-up
NVIDIA, SoftBank, and the Japanese government are co-funding domestic AI datacenters to counter global component shortages, while U.S. hyperscale’s commit double-digit-billion capital to secure motherboard and processor supply. AWS acknowledged chip scarcity as a drag on Q4 2024 revenue yet expects new fabs and packaging facilities to ease constraints by 2026.[2]“AWS Faces Component Constraints,” cnbc.com
Hyperscale price-performance wars
Google Cloud recorded 28-30% YoY growth in 2024-2025 and now markets “training-hour cost” rather than raw compute, signaling a pivot from commodity pricing to AI-specific value metrics crn.com. Microsoft’s integration of Azure OpenAI services into core SaaS offerings lifted Q1 2025 cloud revenue 21%. Strategic Collaboration Agreements such as AWS–NetApp bundle storage efficiency with inference optimization, illustrating that ecosystem integration has become the battlefield for wallet share.
Sovereign-cloud mandates
One-third of governments will adopt sovereign cloud services by 2026, incentivizing regional providers to tailor compliance-ready solutions. Japan’s “Sakura Cloud” and the EU’s Digital Operational Resilience Act channel demand to localized zones that meet stringent residency and audit provisions.
Restraints Impact Analysis*
| Restraint | (~) % Impact on CAGR Forecast | Geographic Relevance | Impact Timeline |
|---|---|---|---|
| Data-sovereignty patchwork | -2.1% | Global; acute in APAC and Europe | Long term (≥ 4 years) |
| GPU/optics supply bottlenecks | -1.8% | Global; AI workloads | Short term (≤ 2 years) |
| Tariff-driven cost inflation | -1.5% | North America; spill-over to global buildouts | Short term (≤ 2 years) |
| Evolving compliance complexity | -1.2% | Europe and APAC | Medium term (2-4 years) |
| Source: Mordor Intelligence | |||
Data-sovereignty patchwork
Conflicting statutes such as the EU GDPR and U.S. CLOUD Act force multinationals to duplicate storage across regions, hiking operational costs and slowing cross-border analytics pipelines. China’s Cybersecurity Law similarly raises compliance friction for foreign firms that must isolate “important data” locally.
GPU/optics supply bottlenecks
Motherboard, transceiver, and advanced GPU shortages delay capacity ramps; Microsoft paused several datacenter builds after tariffs threatened to lift project costs by 25-34% on steel, aluminum, and electronics.[3]“Tariffs Raise Datacenter Costs,” costar.com Operators respond by optimizing chip utilization and adopting composable architectures that stretch scarce accelerators.
*Our forecasts treat driver/restraint impacts as directional, not additive. The impact forecasts reflect baseline growth, mix effects, and variable interactions.
Segment Analysis
By Deployment: Platform-as-a-Service accelerates AI application creation
PaaS will grow at 19.08% CAGR through 2031, even as SaaS held 55.60% public cloud market share in 2025. Enterprises graduate from a SaaS-first phase into PaaS to build proprietary AI services without managing underlying infrastructure. In Europe, developer demand for integrated environments has pushed PaaS ahead of Infrastructure-as-a-Service. Siemens’ pairing of Teamcenter PLM with Microsoft Azure underscores PaaS’s role in embedding AI into manufacturing workflows. The public cloud market size for PaaS is expected to surge as low-code platforms shrink development cycles, while SaaS continues to experience expansive albeit slower growth through domain-specific applications.
Infrastructure-as-a-Service retains steady relevance for lift-and-shift migrations, serving legacy workloads that cannot yet be containerized. Over the forecast, PaaS may erode SaaS’ share where firms favor custom ML models over packaged software. Yet SaaS’ ubiquity in CRM, HCM, and collaboration ensures it remains the revenue anchor of the public cloud market.


By Organization Size: SMEs democratize advanced capabilities
Large enterprises captured 67.40% public cloud market share in 2025, benefiting from deep IT budgets and early cloud adoption curves. However, SMEs exhibit the briskest 17.92% CAGR as simplified onboarding and consumption-based pricing dismantle entry barriers. Research covering 99% of U.S. businesses shows cloud adoption boosts SME productivity and innovation.
The public cloud market size attached to SME demand is poised to climb because GenAI APIs now abstract away the need for data-science teams. Conversely, large enterprises will continue to unlock value via complex multi-cloud strategies, exemplified by JPMorgan’s migration of 1 exabyte.to AWS. The twin-speed expansion underscores a convergence in which firm size no longer dictates access to cutting-edge computing.
By End-user Industry: Manufacturing overtakes pilot phase
Manufacturing represented the fastest-growing vertical at 20.94% CAGR, even though IT and Telecom retained 30.10% share of public cloud revenues in 2025. Predictive maintenance, digital twins, and AI-backed quality control are propelling plant-floor workloads into the public cloud market. Yet firms exploit less than half of their prepaid capacity, suggesting headroom for optimization.
Financial services continue migrating core banking stacks, as seen in the Federal Home Loan Bank of Chicago’s 30% infrastructure cost reduction post-migration. Healthcare cloud spending accelerates under telehealth adoption, while government demand is set to triple to USD 70 billion by 2025, signaling that public sector digitalization complements commercial uptake
Geography Analysis
North America remains the largest region with 43.75% share in 2025, anchored by hyperscale headquarters, venture ecosystems, and mature enterprise spending patterns. However, pending tariffs of up to 34% on electronics risk inflating build costs, pushing operators like Microsoft to delay expansion talks. Federal cloud budgets are climbing, USD 8.3 billion earmarked for FY 2025, offsetting some inflationary drag. Treasury alone lifted its cloud allocation fourfold year-over-year, underscoring unwavering public-sector appetite.
Asia-Pacific is the velocity story, projected to grow 18.12% CAGR through 2031. AWS pledged JPY 2.26 trillion (USD 15.1 billion) for Japanese buildouts, while Microsoft is spending USD 2.9 billion on AI datacenters. Tokyo’s Economic Security Promotion Act subsidizes half of a USD 100 million GenAI supercomputer, reflecting sovereign determination to secure compute. The Asian Development Bank finds cloud contributes up to 2.23% of GDP, with policy reform able to add 0.7 percentage-point growth by 2028.
Europe navigates stricter data-residency statutes such as DORA, complicating multinational rollouts but offering clarity for regional players adept at compliance. Despite regulation, continental cloud services are set for 23.1% CAGR to reach EUR 110.4 billion by 2028, although U.S. vendors still hold 72% share. South America, the Middle East, and Africa remain nascent yet strategic, attracting first-mover builds to capture unmet digital transformation demand.

Competitive Landscape
AWS, Microsoft Azure, and Google Cloud controlled 63% public cloud market share in Q1 2025. AWS keeps a 29% slice despite three quarters of revenue softness, while Microsoft lifts share to 22% via embedded AI in every layer of its stack. Google maintains 12% after sustaining 28-30% growth. The battlefront has migrated toward ecosystem alliances: AWS inked multi-year agreements with NetApp, CrowdStrike, Rackspace, Hitachi, and Lumen to deliver end-to-end solutions that keep workloads sticky.
Regional challengers leverage sovereign compliance know-how to win government and public-sector workloads. Patent filings show Meta building VR-centric cloud ecosystems and Sony designing platforms for game streaming, hinting at fresh consumer revenue pools. M&A persists: IBM agreed to acquire HashiCorp at a 43% premium to fortify hybrid-cloud automation, while CDW bought Mission Cloud Services to target mid-market managed services.
Public Cloud Industry Leaders
Amazon Web Services Inc. (AMAZON.COM, Inc.)
Alibaba Cloud (Alibaba Group Holding Limited)
Google LLC (Alphabet Inc.)
Microsoft Corporation
Oracle Corporation
- *Disclaimer: Major Players sorted in no particular order

Recent Industry Developments
- February 2025: IBM to acquire HashiCorp for USD 35 per share, bundling automation tooling with IBM Cloud offerings.
- February 2025: NetApp and AWS signed a Strategic Collaboration Agreement to accelerate generative-AI data services on Amazon FSx for NetApp ONTAP.
- January 2025: Panasonic adopted Siemens Teamcenter X to streamline cloud-based product lifecycle management.
- December 2024: Red Hat and AWS expanded hybrid-cloud collaboration to streamline VM migration and AI workload deployment.


Global Public Cloud Market Report Scope
A public cloud is a type of computing where resources are offered by a third-party provider through the Internet and shared by businesses and individuals who want to use or purchase them. Some public cloud computing resources are free, while customers may pay for other resources through subscription or pay-per-usage pricing models.
The public cloud market is segmented by deployment (software-as-a-service (SaaS), platform-as-a-service (PaaS), infrastructure-as-a-service (IaaS)), by organization size (SME's organization, large organization), by end-user industry (BFSI, healthcare, government, manufacturing, IT and telecom), and by geography (North America, Europe, Asia Pacific, Latin America, Middle East and Africa). The market sizes and forecasts are provided in terms of value in USD for all the above segments.
The market sizes and forecasts are provided in terms of value USD for all the above segments.
| Software-as-a-Service (SaaS) |
| Platform-as-a-Service (PaaS) |
| Infrastructure-as-a-Service (IaaS) |
| Small and Medium Enterprises (SMEs) |
| Large Enterprises |
| BFSI |
| Healthcare and Life Sciences |
| Government and Public Sector |
| Manufacturing |
| IT and Telecom |
| Other End-user Industries |
| North America |
| South America |
| Europe |
| Asia-Pacific |
| Middle East |
| Africa |
| By Deployment | Software-as-a-Service (SaaS) |
| Platform-as-a-Service (PaaS) | |
| Infrastructure-as-a-Service (IaaS) | |
| By Organisation Size | Small and Medium Enterprises (SMEs) |
| Large Enterprises | |
| By End-user Industry | BFSI |
| Healthcare and Life Sciences | |
| Government and Public Sector | |
| Manufacturing | |
| IT and Telecom | |
| Other End-user Industries | |
| By Geography | North America |
| South America | |
| Europe | |
| Asia-Pacific | |
| Middle East | |
| Africa |


Key Questions Answered in the Report
What is the current size of the public cloud market?
The public cloud market is worth USD 859.26 billion in 2026 and is projected to reach USD 1,936.23 billion by 2031 at a 17.69% CAGR.
Which deployment model grows fastest through 2031?
Platform-as-a-Service leads growth at 19.08% CAGR, reflecting rising demand for AI-ready development environments.
Why are sovereign-cloud mandates significant?
They add +2.4 percentage points to forecast CAGR by forcing hyperscalers to build localized zones and by opening space for compliant regional providers.
How do GPU shortages affect cloud expansion?
Asia Pacific is estimComponent bottlenecks trim 1.8 percentage points from projected CAGR and delay datacenter buildouts, prompting providers to optimize existing hardware.ated to grow at the highest CAGR over the forecast period (2026-2031).
How do GPU shortages affect cloud expansion?
Manufacturing tops vertical growth at 20.94% CAGR as factories deploy AI for predictive maintenance and digital twins.
Who dominates the competitive public cloud landscape
AWS, Microsoft Azure, and Google Cloud jointly hold 63% market share, but specialized regional vendors are gaining traction with sovereign-cloud solutions.
Page last updated on:


