Cloud Database And DBaaS Market Size and Share
Market Overview
| Study Period | 2020 - 2031 |
|---|---|
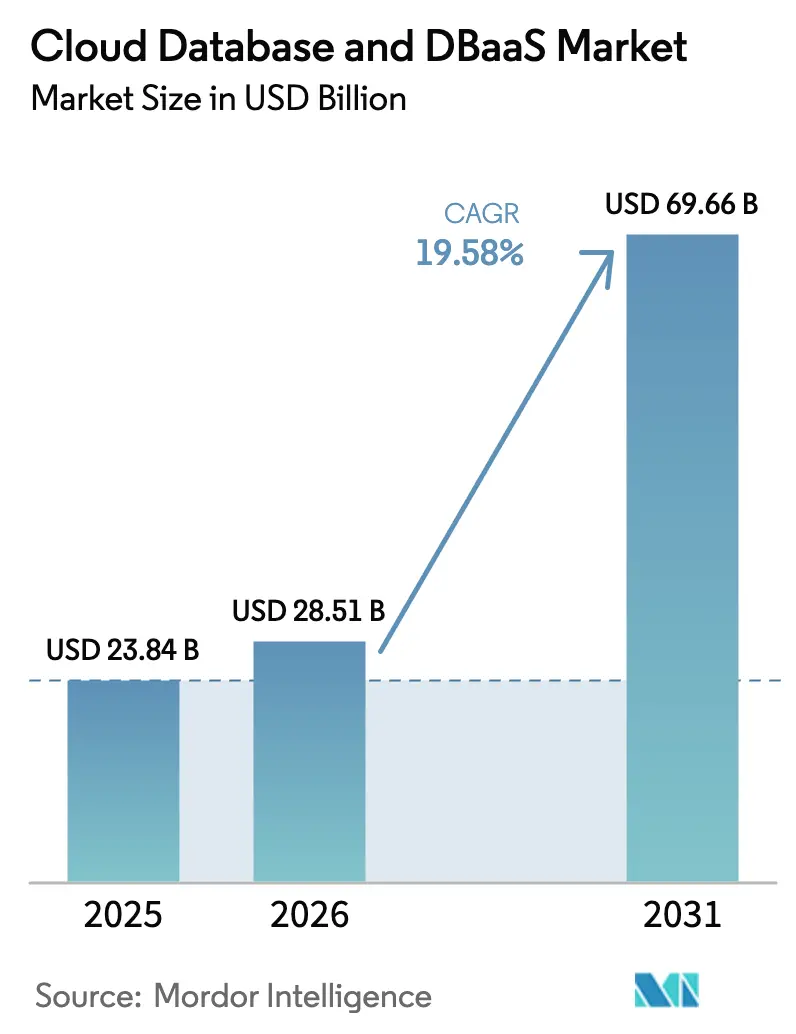
| Market Size (2026) | USD 28.51 Billion |
| Market Size (2031) | USD 69.66 Billion |
| Growth Rate (2026 - 2031) | 19.58% CAGR |
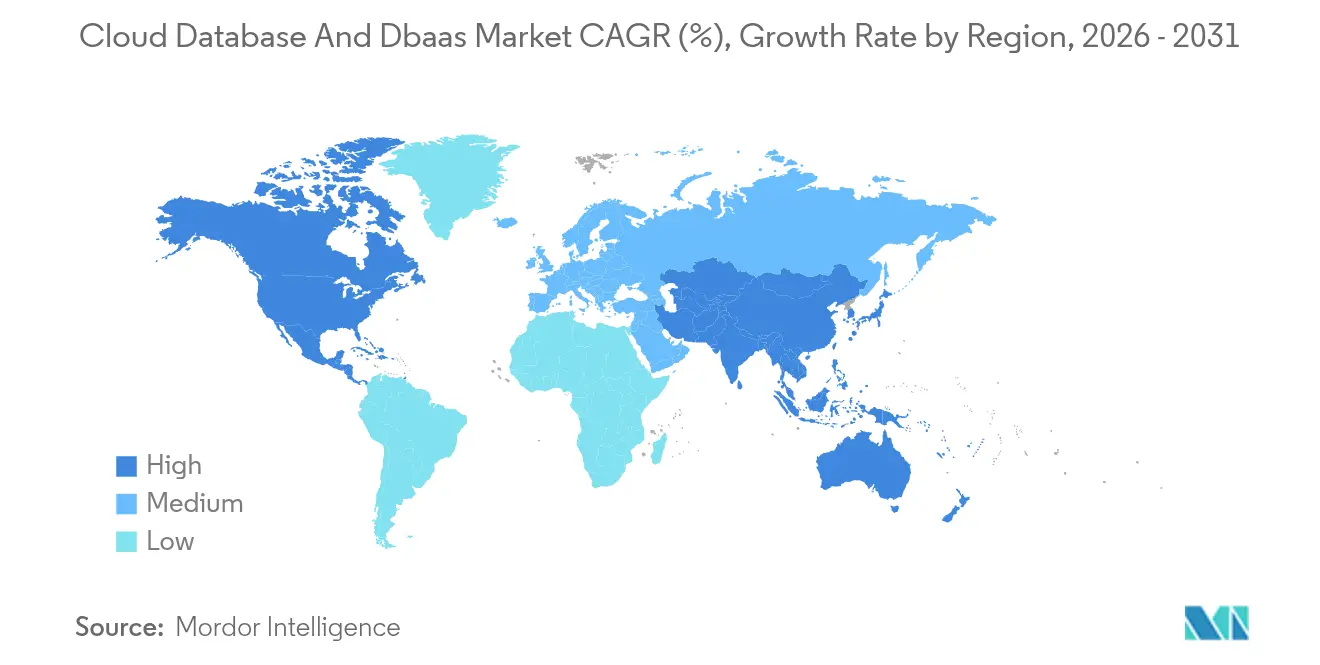
| Fastest Growing Market | Asia Pacific |
| Largest Market | North America |
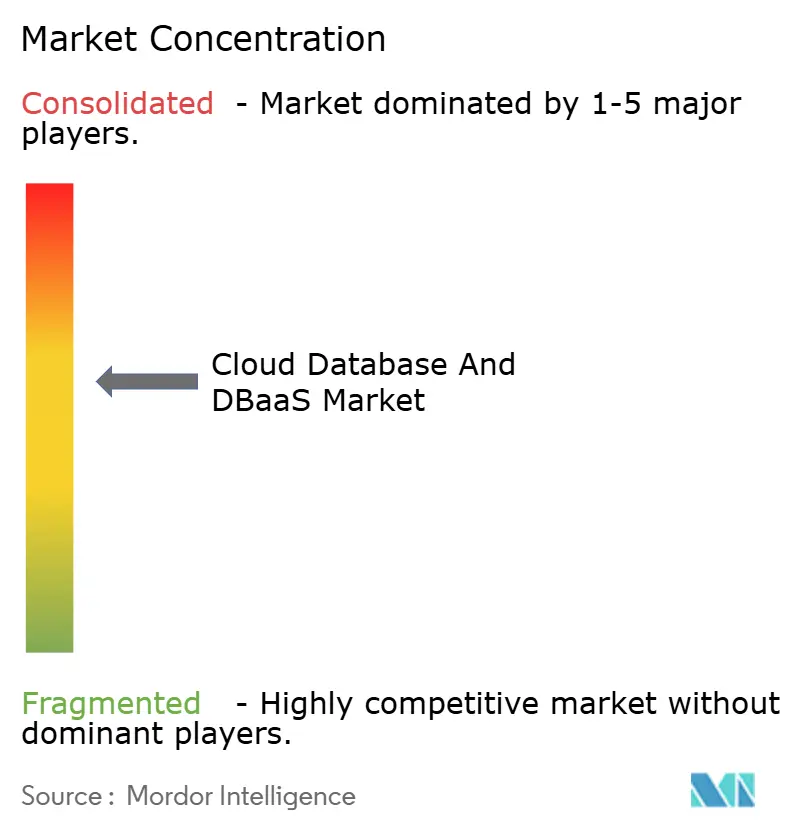
| Market Concentration | Medium |
Major Players *Disclaimer: Major Players sorted in no particular order Image © Mordor Intelligence. Reuse requires attribution under CC BY 4.0. | |
Cloud Database And DBaaS Market Analysis by Mordor Intelligence
The cloud database and DBaaS market size is expected to grow from USD 23.84 billion in 2025 to USD 28.51 billion in 2026 and is forecast to reach USD 69.66 billion by 2031 at 19.58% CAGR over 2026-2031. Strong momentum stems from enterprises shifting to cloud-native architectures, surging AI and IoT data volumes, and the growing preference for globally distributed, low-latency data services. Vendor consolidation, illustrated by Snowflake’s USD 250 million purchase of Crunchy Data, intensifies competition while broadening product portfolios. Asia-Pacific’s 23.8% CAGR underscores how data-sovereignty rules and hyperscale investments accelerate adoption, whereas North America maintains scale advantages through mature FinOps practices and early cloud uptake. Across all regions, SMEs embrace DBaaS to cut total cost of ownership by up to 75% and to access managed operations that free limited internal resources.
Key Report Takeaways
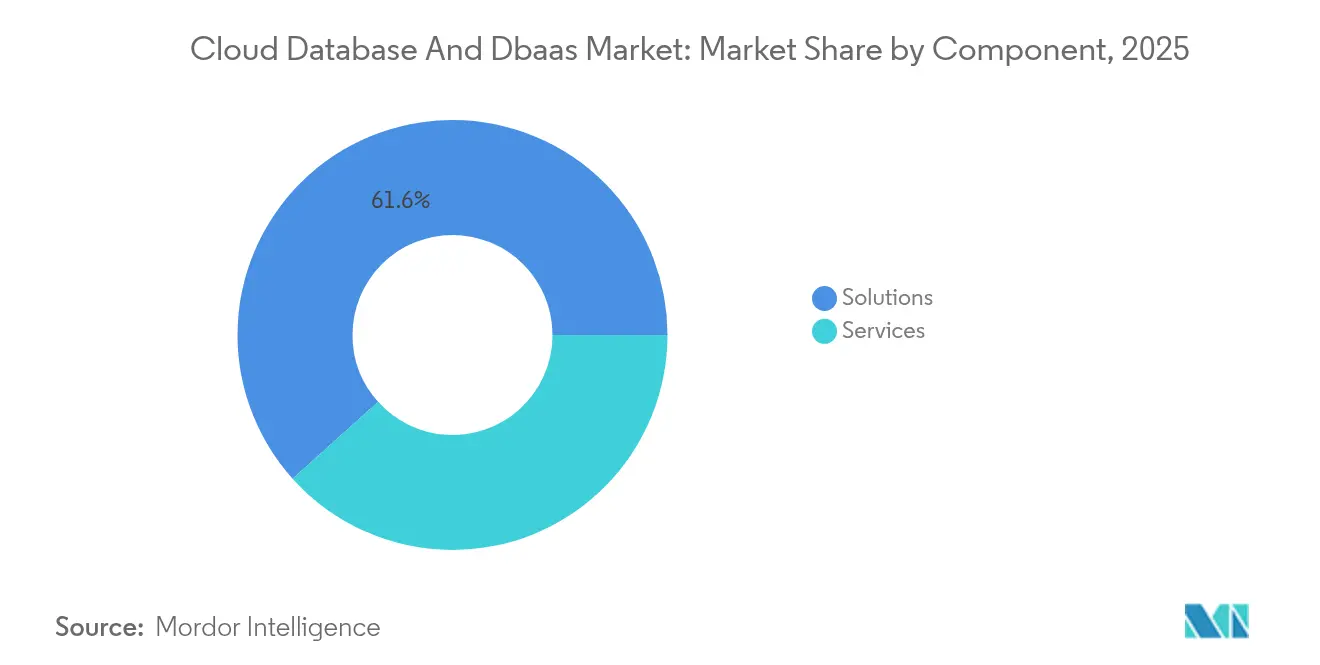
- By component, solutions held 61.65% of the cloud database and DBaaS market share in 2025; services are projected to grow at a 25.6% CAGR through 2031.
- By database type, relational databases commanded 53.40% share of the cloud database and DBaaS market size in 2025, whereas NoSQL databases are forecast to advance at a 29.1% CAGR to 2031.
- By deployment model, public cloud accounted for 70.92% revenue share in 2025, while hybrid and multi-cloud is set to expand at a 23.1% CAGR through 2031.
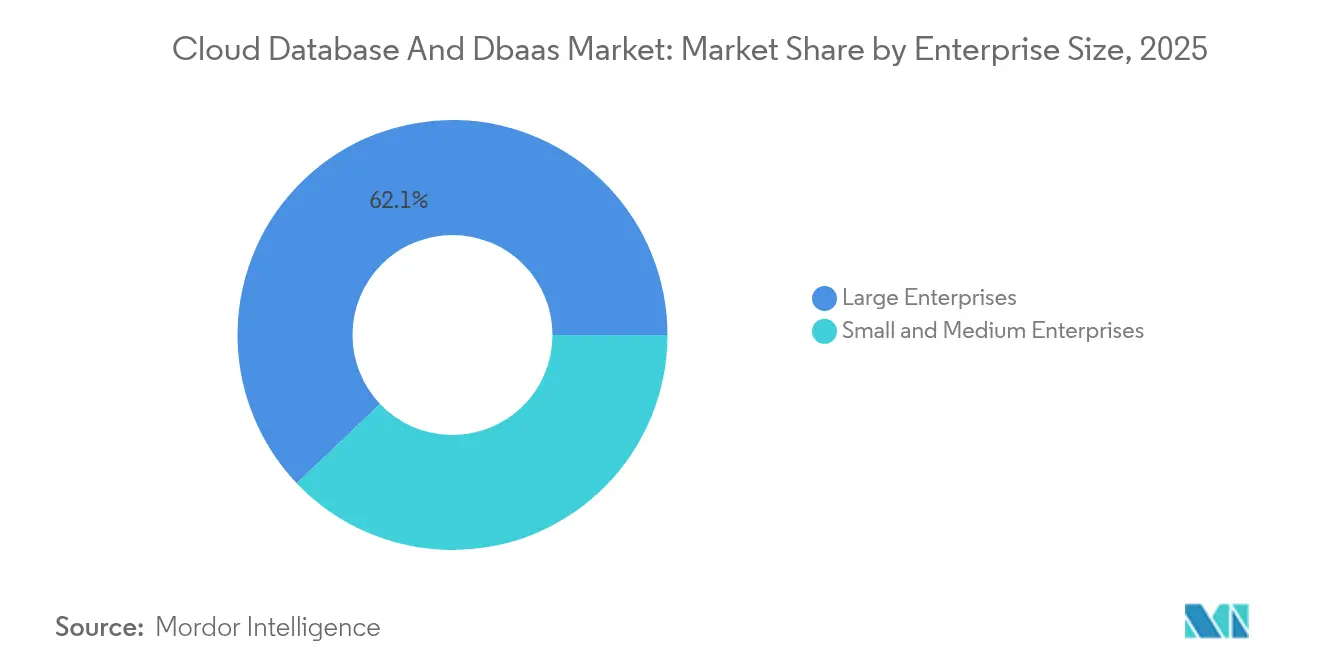
- By enterprise size, large enterprises captured 62.10% of cloud database and DBaaS market share in 2025, yet SMEs are registering the highest growth at 22.8% CAGR through 2031.
- By end-user vertical, BFSI led with 25.20% share of the cloud database and DBaaS market size in 2025; healthcare and life sciences is poised to grow at a 24.7% CAGR to 2031.
- By Geography, North America accounted for 41.10% revenue share of cloud database and DBaaS market share in the 2025, while Asia-Pacific is set to expand at a 24.05% CAGR through 2031.
Note: Market size and forecast figures in this report are generated using Mordor Intelligence’s proprietary estimation framework, updated with the latest available data and insights as of 2026.
Global Cloud Database And DBaaS Market Trends and Insights
Drivers Impact Analysis*
| Driver | (~) % Impact on CAGR Forecast | Geographic Relevance | Impact Timeline |
|---|---|---|---|
| Exponential data growth from AI, IoT and analytics workloads | +6.2% | Global, with Asia-Pacific leading adoption | Medium term (2-4 years) |
| Cloud-native application modernisation wave among enterprises | +4.8% | North America and EU, expanding to Asia-Pacific | Short term (≤ 2 years) |
| Demand for globally distributed, low-latency data architectures | +3.5% | Global, driven by regulatory requirements | Long term (≥ 4 years) |
| SME shift to DBaaS to cut total cost of ownership | +2.9% | Asia-Pacific core, spill-over to MEA | Medium term (2-4 years) |
| AI-driven autonomous databases reducing admin burden | +2.1% | North America and EU early adoption | Long term (≥ 4 years) |
| "Regionless" data architecture to address sovereignty laws | +1.7% | EU, Asia-Pacific, with national implementations | Long term (≥ 4 years) |
| Source: Mordor Intelligence | |||
Exponential data growth from AI, IoT and analytics workloads
AI inference, IoT telemetry, and real-time analytics create continuous streams of high-volume, high-velocity data that legacy architectures struggle to process. Vector databases purpose-built for AI gain traction; Pinecone’s serverless model removes infrastructure management while scaling to billions of embeddings. Humata’s migration from Pinecone to Supabase’s integrated vectors cut costs by four times while supporting millions of users, illustrating value in consolidated platforms. Autonomous database tools are increasingly adopted, reflecting a market-wide push to simplify operations as data complexity rises.
Cloud-native application modernisation wave among enterprises
Organizations replace monolithic systems with microservices on Kubernetes, enabling continuous delivery and elastic scaling. Japan Airlines transitioned mainframe COBOL to Java on AWS in eight months, while Acoustic migrated 6,300 servers to AWS in ten months and improved analytics using DynamoDB and Glue. SMEs mirror the shift: India’s MyBillBook leverages MongoDB Atlas to improve transaction speed by 90% and reduce CPU drain by 50%. Such projects highlight how modernisation reduces technical debt and fosters real-time analytics, sustaining growth in the cloud database and DBaaS market[2]MongoDB Inc., “MongoDB Atlas Now Available as Azure Native ISV Service,” mongodb.com.
Demand for globally distributed, low-latency data architectures
Regulators and consumers expect data residency and instant responsiveness. Hard Rock Digital deploys CockroachDB on AWS Outposts to comply with local rules without sacrificing performance. In APAC, 75% of countries enforce localisation laws, spurring multi-region deployments. MongoDB Atlas enables simultaneous data placement across AWS, Azure, and Google Cloud, letting enterprises meet residency mandates while maintaining a unified operational model. Distributed SQL and peer-to-peer replication become critical, fortifying adoption across the cloud database and DBaaS market.
SME shift to DBaaS to cut total cost of ownership
Small firms avoid large capital outlays and scarce DBA talent by selecting fully managed services. Custella’s move to Oracle MySQL Database Service slashed response time by 20% and improved security. QBS System reported 20% operational savings after shifting IoT applications to the same service. Cost-optimization case studies, including DataViz’s 90% spend reduction on AWS, prove that right-sizing and reserved capacity strategies deliver tangible ROI, drawing more SMEs into the cloud database and DBaaS market.
Restraint Impact Analysis*
| Restraint | (~) % Impact on CAGR Forecast | Geographic Relevance | Impact Timeline |
|---|---|---|---|
| Persistent security and privacy compliance hurdles | -3.2% | Global, with EU and Asia-Pacific most stringent | Short term (≤ 2 years) |
| Vendor lock-in and migration complexity | -2.8% | Global, affecting enterprise decisions | Medium term (2-4 years) |
| FinOps scrutiny over unpredictable DBaaS spend | -1.9% | North America and EU enterprise focus | Short term (≤ 2 years) |
| Scarcity of multi-model distributed-DB skills | -1.5% | Global, with emerging markets most affected | Long term (≥ 4 years) |
| Source: Mordor Intelligence | |||
Persistent security and privacy compliance hurdles
Enterprises host sensitive data in the cloud, yet only 38% regard provider controls as highly effective. New mandates such as the UK’s Secure-by-Default and the EU’s AI-focused GDPR+ intensify due-diligence requirements. Healthcare firms rely on Oracle Autonomous Database features such as always-on encryption and automated patching to maintain HIPAA compliance. Nevertheless, rising threat vectors and fines for non-compliance create hesitation, tempering broader cloud database and DBaaS market expansion.
Vendor lock-in and migration complexity
Moving petabyte-scale workloads remains risky and expensive. Broadcom’s 10 TB MySQL relocation to Google Cloud SQL demanded phased replication and custom tooling. Faire’s migration of 5,000 Redshift tables to Snowflake required Datafold validation to avoid data drift. Such high-effort projects discourage rapid provider changes and motivate enterprises to adopt multi-cloud abstractions and open-source standards, slightly curbing near-term growth in the cloud database and DBaaS market.
*Our forecasts treat driver/restraint impacts as directional, not additive. The impact forecasts reflect baseline growth, mix effects, and variable interactions.
Segment Analysis
By Component: Services Acceleration Outpaces Solutions Growth
Solutions accounted for 61.65% revenue in 2025, anchoring the cloud database and DBaaS market through software PaaS offerings, automated backups, and AI-enabled monitoring. Yet the services segment is forecast to expand at 25.6% CAGR, signalling that enterprises increasingly outsource complex database operations to trusted partners. Professional services appeal to large modernization projects, evidenced by Ispirer’s 95% automated Oracle-to-PostgreSQL conversions that cut migration costs for financial institutions. Managed services resonate with firms seeking uptime guarantees; Solocal cut database spend from 30% to 4% of its budget by moving 40 clusters to MongoDB Atlas and now reports 99.995% availability.
Demand for advisory, migration, and 24×7 managed support keeps fueling service-led growth inside the cloud database and DBaaS market. AI-assisted features such as Oracle Select AI automatically translate natural language into SQL and optimize queries, blending traditional solutions with value-added services. This convergence encourages enterprises to engage end-to-end providers that bundle platform licensing, operational governance, and continuous optimization.


By Database Type: NoSQL Surge Driven by AI and Real-Time Applications
Relational platforms retained 53.40% revenue in 2025, underpinned by ACID compliance needs and mature SQL ecosystems. However, the accelerating AI wave propels NoSQL databases at a 29.1% CAGR through 2031. MongoDB leads with 45.82% NoSQL share, capitalizing on flexible schemas that shorten build cycles for dynamic microservices. Graph technologies grow fivefold in two years, supporting fraud analytics and social graph computation, while vector engines like Milvus handle billion-scale embeddings for recommendation and semantic search.
This diverse toolbox reflects developer reality: 49% now combine RDBMS and NoSQL systems. The cloud database and DBaaS market size for NoSQL segments is rising as teams prioritize agility and real-time performance over strict relational structure. Yet relational vendors respond with distributed SQL, integrating vector functions and JSON columns to remain relevant, ensuring coexistence rather than replacement.
By Deployment Model: Hybrid Multi-Cloud Strategies Gain Momentum
Public cloud captured 70.92% of 2025 revenue, leveraging hyperscalers’ constant price-performance gains. Nevertheless, hybrid and multi-cloud models are projected to post a 23.1% CAGR, reflecting enterprise intent to avoid lock-in and to meet regional governance. MongoDB Atlas allows single-pane administration across AWS, Azure, and Google Cloud, a capability embraced by regulated financial institutions in the United Kingdom. Oracle’s new program with Google Cloud permits low-latency access to Oracle Database services without egress fees, supporting global rollouts.
Edge nodes add another deployment vector as devices require millisecond responses. CockroachDB’s geo-partitioning synchronizes data across racks, regions, and continents, keeping user latency low while honoring data-sovereignty clauses. This orchestration complexity favours platform vendors that abstract network topology and let architects map data governance policies to infrastructure footprints across the cloud database and DBaaS market.
By Enterprise Size: SME Acceleration Outpaces Large Enterprise Growth
Large organizations held 62.10% revenue in 2025, operating multi-model estates that underpin core banking, telecom mediation, and supply-chain analytics. They steer product innovation, as seen in Oracle Database 23ai introducing vector search and natural language query, and Mitsubishi UFJ Bank adopting Databricks Lakehouse to harmonize AI workloads. Still, SMEs will grow faster at 22.8% CAGR, drawn by predictable pricing and turnkey compliance.
For Indian retailers, MyBillBook’s adoption of MongoDB Atlas produced 90% higher transaction speed and 50% lower CPU consumption, enabling digital invoicing at scale. Tessell demonstrated 250% ROI in three years by halving Oracle license fees and trimming compute spend by 70% through reserved instances. Such performance-per-dollar gains encourage wider SME participation in the cloud database and DBaaS market, boosting overall consumption.
By End-User Vertical: Healthcare Leads Growth Amid Digital Transformation
BFSI remained the top spender with 25.20% share in 2025, driven by real-time fraud monitoring, risk modeling, and stringent resilience mandates. AXA’s collaboration with AWS showcases how insurers integrate geospatial data and generative AI to tailor commercial risk products. Q2 Holdings likewise broadens its AWS engagement, embedding ML-driven fraud detection into digital-banking platforms.
Healthcare and life sciences stand out for speed: a 24.7% CAGR through 2031 makes it the fastest-growing contributor to the cloud database and DBaaS industry. Mendel uses Databricks Mosaic AI to compress clinical-trial model training from three months to one while staying HIPAA-compliant. Google Cloud’s Healthcare Data Engine merges FHIR-formatted records with Vertex AI, enabling patient-centric decision support. AK Systems processes 10–12 TB trial datasets on Oracle MySQL HeatWave without ETL, removing near-line latency and reducing risk. Such breakthroughs reinforce the sector’s appetite for scalable, compliant data platforms.
Geography Analysis
North America retained 41.10% of 2025 revenue thanks to mature enterprise adoption, robust capital budgets, and strong hyperscaler presence. Grab’s use of AWS to handle over 100 transactions per second across Southeast Asian operations illustrates how North American infrastructure supports global digital platforms despite regional user bases. Consolidation often starts here; Snowflake and Databricks announced multi-hundred-million-dollar acquisitions that reshape competitive boundaries inside the cloud database and DBaaS market.
Asia-Pacific posted the fastest pace, growing at 24.05% CAGR, fuelled by USD 8 billion Oracle investment in Japan and AWS’s 2.26 trillion-yen expansion plan by 2027. India is on track to add 850 MW of capacity by 2026, nearly doubling its footprint. Local data-residency rules compel providers to launch in-country regions, while domestic cloud services from Alibaba, Huawei, and Tencent ramp up AI-centric products. The outcome is heightened adoption among SMEs and governments, accelerating cloud database and DBaaS market penetration.
Europe grows steadily while balancing GDPR, AI governance, and sovereignty. Enterprises gravitate toward multi-cloud so they can keep workloads within EU borders yet draw on best-in-class analytics. MongoDB Atlas enables European data residency, and Oracle Cloud’s Madrid region extends compliance-ready infrastructure to Iberian customers. This regulatory-savvy stance supports gradual but resilient demand across the continent.

Competitive Landscape
Competition blends hyperscale breadth and specialist depth. Amazon Web Services, Microsoft, Oracle, and Google Cloud bundle databases with compute and AI accelerators. Snowflake, MongoDB, and Databricks differentiate through developer experience and advanced lakehouse or document capabilities. Market share shifts as incumbents add vector search, graph extensions, and serverless consumption pricing.
Consolidation accelerates capability expansion. Snowflake spent USD 250 million on Crunchy Data to embed PostgreSQL, while Databricks invested USD 1 billion to acquire Neon and Tabular to reinforce open-source lakehouse components. Oracle’s cross-cloud alliance with Google Cloud highlights coopetition: both firms jointly address customer demand for integrated services without data-e-gress penalties.
White-space persists in autonomous operations and edge solutions. Oracle’s self-patching features cut DBA labour. Meanwhile, specialized vector-database vendors like Pinecone, Milvus, and Weaviate aim at AI inference workloads. Distributed SQL players such as Yugabyte and Cockroach Labs chase latency-sensitive verticals by offering geo-partitioned consistency. These niches illustrate the dynamic innovation pace sustaining growth in the cloud database and DBaaS market.
Cloud Database And DBaaS Industry Leaders
IBM Corporation
Amazon Web Services, Inc.
Microsoft Corporation
Oracle Corporation
Alibaba Group Holding Limited
- *Disclaimer: Major Players sorted in no particular order

Recent Industry Developments
- June 2025: Snowflake completed its USD 250 million acquisition of Crunchy Data to integrate enterprise-grade PostgreSQL functionality.
- May 2025: MongoDB launched Atlas as a Microsoft Azure Native integration across more than 40 regions.
- May 2025: Databricks purchased Neon for USD 1 billion, bolstering its serverless PostgreSQL capabilities.
- April 2025: Oracle and Google Cloud unveiled a partner program for Oracle Database on Google Cloud with zero data-transfer fees across multiple regions.


Research Methodology Framework and Report Scope
Market Definitions and Key Coverage
Our study defines the cloud database and DBaaS market as all subscription-based relational or NoSQL engines that are provisioned, operated, and billed through a cloud control plane. Revenue covers platform fees, storage, compute bursts, and embedded monitoring features, but excludes stand-alone professional services.
Scope exclusion: Self-managed databases that are simply hosted on IaaS without provider operation are out of scope.
Segmentation Overview
- By Component
- Solutions
- Database software (PaaS)
- Analytics and monitoring add-ons
- Services
- Professional (consulting, migration)
- Managed/operated DBaaS
- Solutions
- By Database Type
- Relational (RDBMS)
- Cloud-hosted SQL
- Distributed SQL
- NoSQL
- Key-value / Wide-column
- Document
- Graph
- Time-series and Vector
- Relational (RDBMS)
- By Deployment Model
- Public Cloud
- Private Cloud
- Hybrid / Multi-cloud
- By Enterprise Size
- Large Enterprises
- Small and Medium Enterprises
- By End-user Vertical
- BFSI
- IT and Telecom
- Retail and E-commerce
- Healthcare and Life-sciences
- Government and Public Sector
- Manufacturing
- Media and Entertainment
- Others (Energy, Education etc.)
- By Geography
- North America
- United States
- Canada
- Mexico
- South America
- Brazil
- Argentina
- Rest of South America
- Europe
- United Kingdom
- Germany
- France
- Italy
- Spain
- Nordics
- Rest of Europe
- Middle East and Africa
- Middle East
- Saudi Arabia
- United Arab Emirates
- Turkey
- Rest of Middle East
- Africa
- South Africa
- Egypt
- Nigeria
- Rest of Africa
- Middle East
- Asia-Pacific
- China
- India
- Japan
- South Korea
- ASEAN
- Australia
- New Zealand
- Rest of Asia-Pacific
- North America
Detailed Research Methodology and Data Validation
Primary Research
Mordor analysts spoke with hyperscaler product leads, enterprise DBAs across North America, Europe, and Asia, and regional managed service partners. These conversations validated workload migration rates, typical reserved-instance discounts, and the pace of vector-database pilots, tightening early desk estimates.
Desk Research
We mapped demand using public filings (AWS, Microsoft, Oracle 10-Ks), Eurostat cloud-use surveys, US Census ICT indicators, and Japan MIC data. Insights on serverless adoption came from Cloud Native Computing Foundation reports and GitHub Octoverse commit trends. Supplementary company splits drew on D&B Hoovers, Dow Jones Factiva news flow, and Questel patent counts. The sources cited are illustrative, and many additional public and subscription datasets informed data checks and context refinement.
Market-Sizing & Forecasting
A top-down model starts with reported PaaS revenue and applies database share ratios drawn from filings and interviews. Bottom-up spot checks average storage price times active terabytes and managed instance tallies guard against over- or under-statement. Principal drivers include off-premise data migration share, NoSQL deployment ratio, storage dollars per GB, serverless scaling frequency, and regional data sovereignty rules. Multivariate regression plus scenario analysis extends the outlook to 2030, while gaps in sparse bottom-up lines are filled through historical utilization curves and conservative interpolation.
Data Validation & Update Cycle
Outputs undergo variance screens, cross-checks with external indicators, and peer review. We refresh each model annually, with mid-cycle corrections triggered by vendor re-segmentation or major regulatory events, and every report is revalidated just before publication.
Why Mordor's Cloud Database and DBaas Baseline Commands Reliability
Published estimates diverge because analysts choose different boundaries, input signals, and refresh speeds. In this space, numbers swing when firms omit hybrid spend, fold in non-database PaaS, or freeze FX rates. Mordor revisits each variable yearly and aligns them with explicit scope notes.
The comparison confirms that Mordor's disciplined scope, mixed-method modeling, and annual refresh cycle deliver a balanced baseline senior executives can trust.
Benchmark comparison
| Market Size | Anonymized source | Primary gap driver |
|---|---|---|
| USD 23.84 B (2025) | Mordor Intelligence | |
| USD 23.05 B (2025) | Global Consultancy A | Narrower vertical scope. Relies solely on vendor disclosures |
| USD 24.80 B (2025) | Global Consultancy B | Bundles analytics PaaS. Applies flat growth from 2024 numbers |
The comparison confirms that Mordor's disciplined scope, mixed-method modeling, and annual refresh cycle deliver a balanced baseline senior executives can trust.


Key Questions Answered in the Report
What is the projected size of the cloud database and DBaaS market by 2031?
The market is expected to reach USD 69.66 billion by 2031 under a 19.58% CAGR.
Which component segment is growing the fastest?
The services segment is expanding at a 25.6% CAGR as firms seek migration, managed, and optimization services.
Why are NoSQL databases gaining traction?
AI, real-time analytics, and flexible schema needs propel NoSQL at a 29.1% CAGR, with MongoDB holding 45.82% share.
How do data sovereignty rules affect deployment models?
Localization laws push enterprises toward hybrid and multi-cloud strategies, the fastest-growing deployment category at 23.1% CAGR.
Which vertical shows the highest growth potential?
Healthcare and life sciences is set to grow at 24.7% CAGR, driven by AI-enabled drug discovery and patient analytics.
What risks slow market adoption?
Security compliance gaps and migration complexity remain the largest restraints, shaving an estimated 3.2 percentage points off the forecast CAGR.
Page last updated on:


