
Mobile Learning Market Size and Share
Market Overview
| Study Period | 2020 - 2031 |
|---|---|
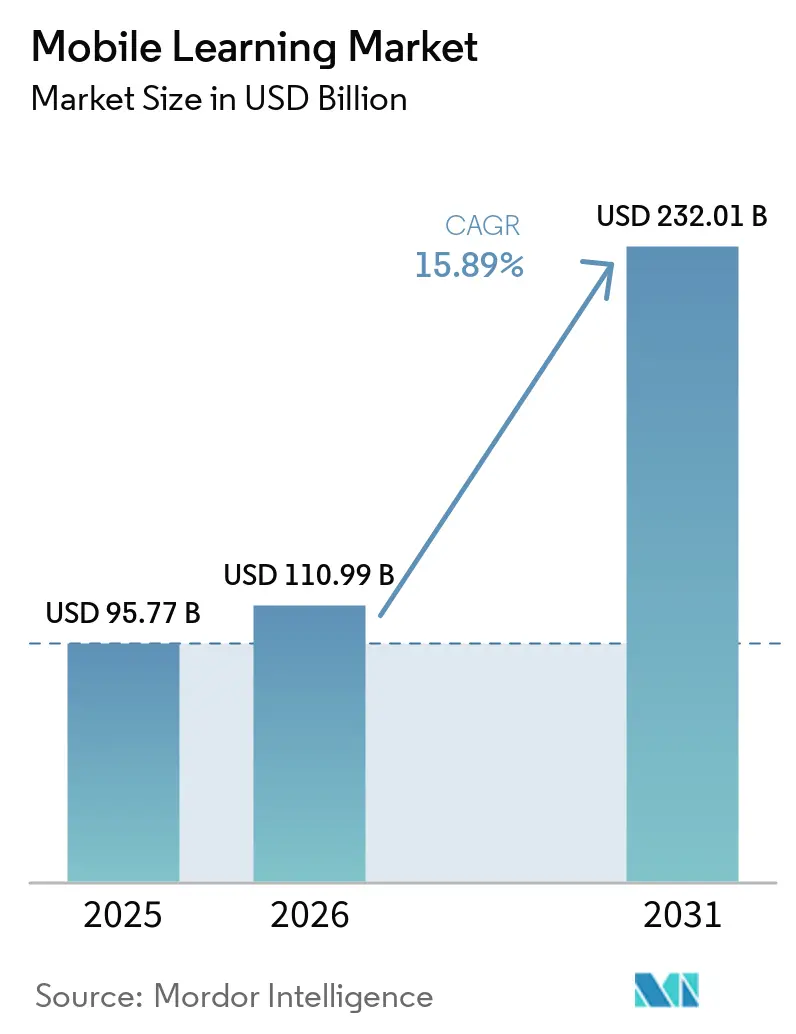
| Market Size (2026) | USD 110.99 Billion |
| Market Size (2031) | USD 232.01 Billion |
| Growth Rate (2026 - 2031) | 15.89 % |
| Fastest Growing Market | Asia Pacific |
| Largest Market | North America |
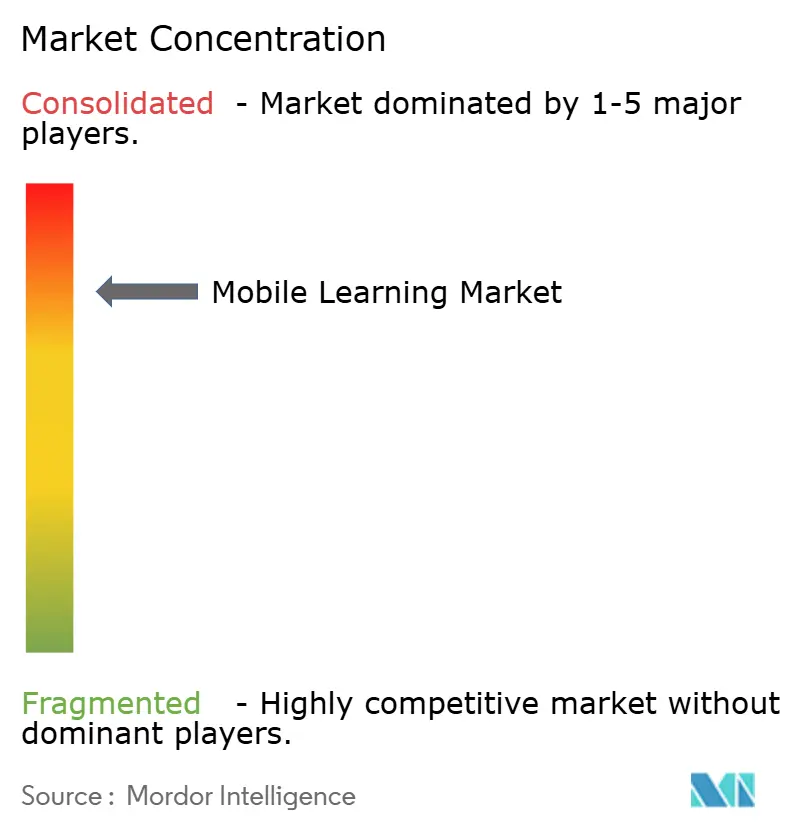
| Market Concentration | High |
Major Players *Disclaimer: Major Players sorted in no particular order Image © Mordor Intelligence. Reuse requires attribution under CC BY 4.0. | |
Mobile Learning Market Analysis by Mordor Intelligence
The Mobile Learning Market size is expected to grow from USD 95.77 billion in 2025 to USD 110.99 billion in 2026, and is forecast to reach USD 232.01 billion by 2031, at a 15.89% CAGR over 2026-2031. This strong trajectory is supported by broad 5G coverage, rapid smartphone adoption, and enterprise-wide bring-your-own-device mandates that reduce hardware expenditures while maintaining security compliance. Generative AI now tailors micro-modules to each learner, raising completion rates and shortening time-to-proficiency, while portable stackable credentials appeal to gig-economy workers who need employer-agnostic proof of skill. Content retrofitting, rather than green-field development, attracts the bulk of near-term capital, as converting existing desktop courses into responsive formats reduces deployment cycles from months to weeks. Vendors that bundle curation, delivery, and analytics into a single subscription have started to gain market share, yet the addressable pool remains fragmented, leaving ample room for niche specialists across highly regulated verticals. Advances in adaptive-bitrate streaming and offline synchronization further widen the audience, reaching learners in bandwidth-constrained regions and ensuring the mobile learning market continues to outpace legacy e-learning alternatives.
Key Report Takeaways
- By solution, e-books led with 30.46% revenue share in 2025, whereas m-enablement is set to grow at a 16.82% CAGR through 2031.
- By application, in-class learning accounted for 36.67% of spending in 2025, while simulation-based learning is forecast to expand at 17.33% CAGR to 2031.
- By end-user, academic institutes held 42.27% of 2025 outlays, whereas corporate enterprises are advancing at a 16.02% CAGR over the forecast horizon.
- By provider type, content providers commanded 36.59% revenue in 2025 and are projected to increase at 17.83% CAGR to 2031.
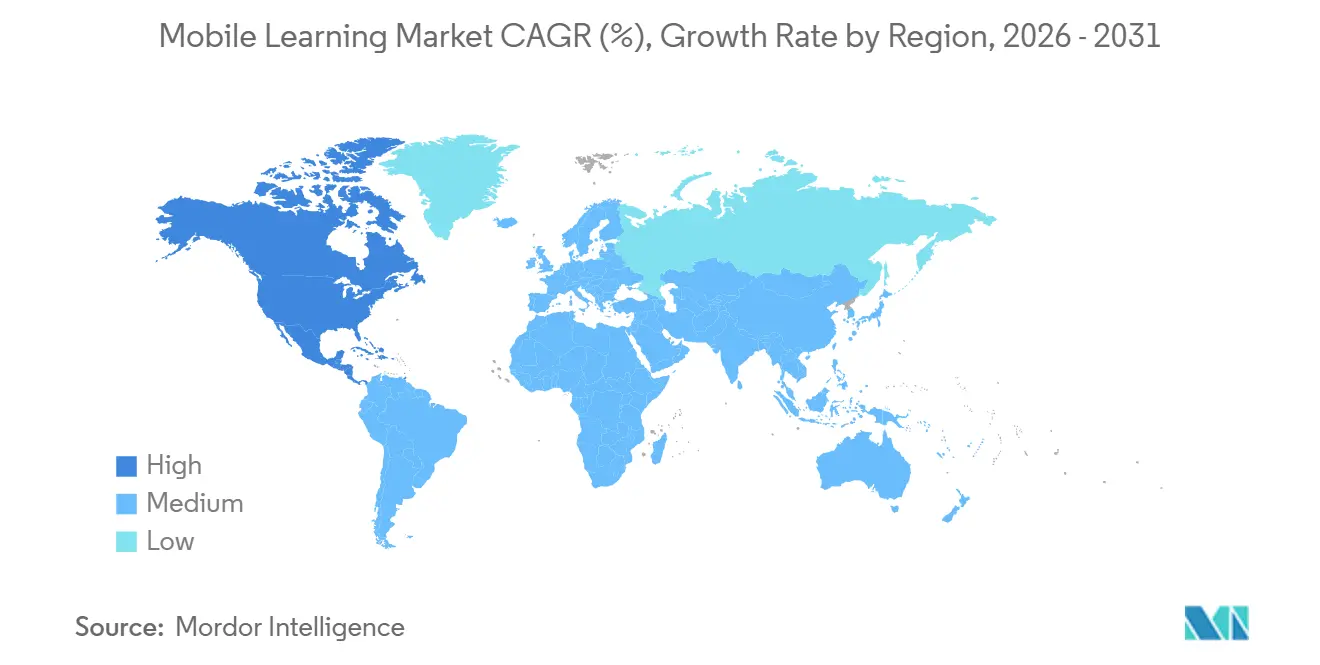
- By geography, North America held 31.36% of 2025 revenue share, yet Asia Pacific is pacing the field with a 18.15% regional CAGR through 2031.
Note: Market size and forecast figures in this report are generated using Mordor Intelligence’s proprietary estimation framework, updated with the latest available data and insights as of January 2026.
Market Trends and Insights
Drivers Impact Analysis of Mobile Learning Market*
| Driver | (~)% Impact on CAGR Forecast | Geographic Relevance | Impact Timeline |
|---|---|---|---|
| Rapid Adoption of Digital Learning Solutions in Corporate L&D | +5.2% | Global, with concentration in North America and Europe | Medium term (2-4 years) |
| Bring-Your-Own-Device (BYOD) Policies Across Enterprises | +4.1% | North America and Europe, expanding to APAC | Short term (≤ 2 years) |
| Rising Global Penetration of Smartphones, Tablets and Laptops | +6.3% | Global, with fastest growth in APAC and Middle East | Long term (≥ 4 years) |
| Global 5G Roll-Out Enabling High-Definition Video and AR Mobile Courses | +4.8% | APAC core, North America, selective Middle East markets | Medium term (2-4 years) |
| AI-driven Hyper-Personalised Micro-Learning Analytics Boosting ROI | +3.7% | Global, led by North America and Europe early adopters | Short term (≤ 2 years) |
| Gig-economy Credential Portability Catalysing Mobile Micro-credentials | +2.9% | Global, with highest uptake in North America and Europe | Medium term (2-4 years) |
| Source: Mordor Intelligence | |||
Rapid Adoption of Digital Learning Solutions in Corporate L&D
Corporate budgets pivoted toward mobile-first channels after hybrid work took hold in 2024. Fortune 500 firms now direct most training spend to smartphone-ready modules, a stance validated when LinkedIn Learning registered 78% corporate usage in 2024. Mobile-first programs consistently post higher completion and proficiency metrics than desktop-only equivalents, delivering measurable productivity dividends. Just-in-time learning embedded inside workflow tools drives quota attainment, and the marginal cost of adding each learner approaches zero once the platform is live, letting scale redefine competitive advantage.
Bring-Your-Own-Device Policies Across Enterprises
BYOD acceptance accelerated in 2024 when NIST issued step-by-step security guidelines, reducing chief information officer hesitation. Workers prefer using personal phones on commutes, and enterprises reap 40%-60% hardware savings. Yet, risk shifts to cybersecurity; endpoint vulnerability counts climb, forcing investments in mobile threat defense licenses that average USD 15-25 per user annually. Even with added security spend, the economics remain favorable, supporting wider adoption.
Rising Global Penetration of Smartphones, Tablets and Laptops
The International Telecommunication Union tallied 5.4 billion unique mobile-internet users in 2024, sharply lifting the total reachable learner base.[1] Rural learners in India, Nigeria, and Indonesia gained first-time access to structured curricula without desktop infrastructure. Content providers that enable offline downloads thrive in bandwidth-limited regions, broadening the mobile learning market while mitigating cost-of-data headwinds that still curb usage in some low-income territories.
Global 5G Roll-Out Enabling High-Definition Video and AR Mobile Courses
Almost 1.9 billion 5G connections were active at the end of 2024, two-thirds in Asia Pacific. High-bandwidth, low-latency links unlock augmented-reality simulations for complex tasks such as aircraft maintenance and surgical practice. Standard-setting by ETSI ensures cross-vendor compatibility, while enterprise surveys signal mainstream rollouts by 2027 in manufacturing and healthcare. Documented gains, such as Boeing cutting assembly errors by 90% using VR drills, solidify investment cases and push the mobile learning market toward immersive formats.
Restraints Impact Analysis of Mobile Learning Market*
| Restraint | (~)% Impact on CAGR Forecast | Geographic Relevance | Impact Timeline |
|---|---|---|---|
| High Upfront Investment in Mobile-ready Infrastructure | -3.4% | Global, acute in emerging markets and SMEs | Short term (≤ 2 years) |
| Data-security and Privacy Compliance Risks on Personal Devices | -2.8% | Europe (GDPR), North America (CCPA, FERPA), expanding globally | Medium term (2-4 years) |
| Device/OS Fragmentation Inflating Content-maintenance Costs | -2.1% | Global, most severe in APAC with diverse Android versions | Long term (≥ 4 years) |
| Smartphone Tariff Volatility and Supply-chain Constraints Raising TCO | -1.6% | Global, with acute impact in import-dependent markets | Medium term (2-4 years) |
| Source: Mordor Intelligence | |||
High Upfront Investment in Mobile-Ready Infrastructure
Mid-sized enterprises spend USD 1.2-2.8 million integrating mobile learning management systems with existing HR and authentication stacks. Nearly half of that total funds legacy-system connectors rather than the learning platform itself. Although cloud-native vendors offer pre-built APIs, customization still averages six to nine months, slowing time-to-value. Smaller companies often postpone adoption or rely on consumer-grade tools, deepening skill gaps versus larger peers.
Data-Security and Privacy Compliance Risks on Personal Devices
GDPR and related regimes amplified compliance overhead when regulators imposed EUR 1.8 billion (USD 2 billion) in fines across sectors in 2024 - 7% targeting education and training providers.[2] California and China layer additional rules, forcing multinationals to juggle varied data-residency demands. Zero-knowledge encryption is emerging as the default safeguard, yet it adds up to USD 0.50 per user each month in hosting costs. The reputational stakes of a breach keep compliance at the forefront of procurement criteria.
*Our forecasts treat driver/restraint impacts as directional, not additive. The impact forecasts reflect baseline growth, mix effects, and variable interactions.
Mobile Learning Market Segment Analysis
By Solution:
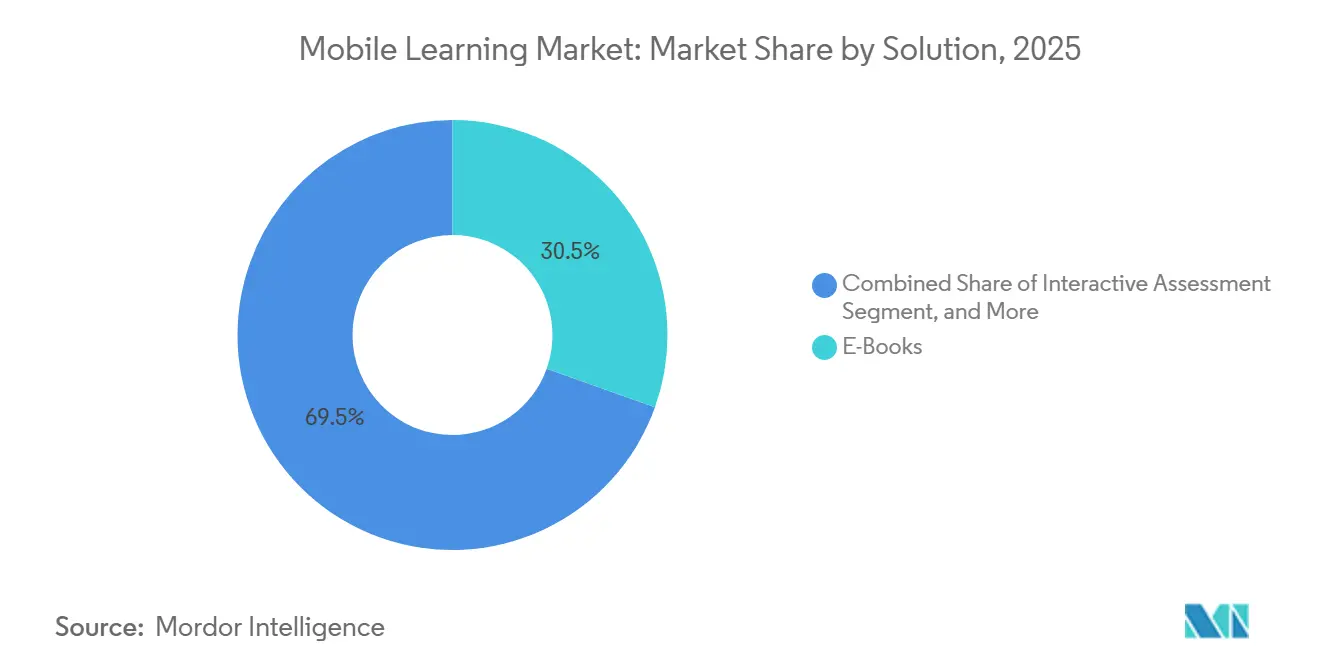
Retrofitting Content Outpaces E-Book DominanceM-enablement is growing at 16.82% CAGR through 2031 as enterprises fast-track desktop-course conversions rather than commission expensive net-new productions. The mobile learning market size attributed to e-books represented 30.46% of overall revenue in 2025, confirming the format’s cost-effectiveness for foundational content. Retrofits slash delivery cycles from 12 months to 3 months, a decisive edge when tech skills now expire in half a decade. E-books, however, remain vital in low-bandwidth settings because learners can download once and study offline, keeping the mobile learning market accessible in data-cost-sensitive geographies.
Interactive assessments, gamified quizzes, and AI-driven adaptive testing supplement core formats. IBM’s Watson-powered formative tools cut grading workloads by 60%, freeing faculty to coach rather than mark. Vendors that support open data standards like xAPI hold an advantage because buyers can mix and match e-books, interactive video, and simulations without vendor lock-in. Platforms forcing proprietary containers risk churn as enterprises favor openness to future-proof their digital libraries.

By Application:
Simulations Accelerate Where Errors Are CostlyIn-class learning still held 36.67% revenue share in 2025 due to entrenched K-12 and degree programs, yet simulation-based learning is tracking a 17.33% CAGR because it mitigates high-stakes mistakes in healthcare, aviation, and energy. The mobile learning market share of simulations is expected to rise as AR and VR modules become mainstream on 5G networks. Corporate L&D teams value the measurable drop in errors and downtime, and ed-tech vendors now bundle simulation libraries with analytics dashboards, proving ROI in months rather than years.
Mobile homework extensions blur the classroom boundary, turning evenings into continuous learning windows. Retail and hospitality chains deploy bite-sized scenario training that new hires consume within 48 hours, halving ramp-up time. Gig-workers and freelancers meanwhile drive independent learning, often self-funding portable credentials that cross employers, a trend reinforcing mobile platforms over desktop portals.
By End-User:
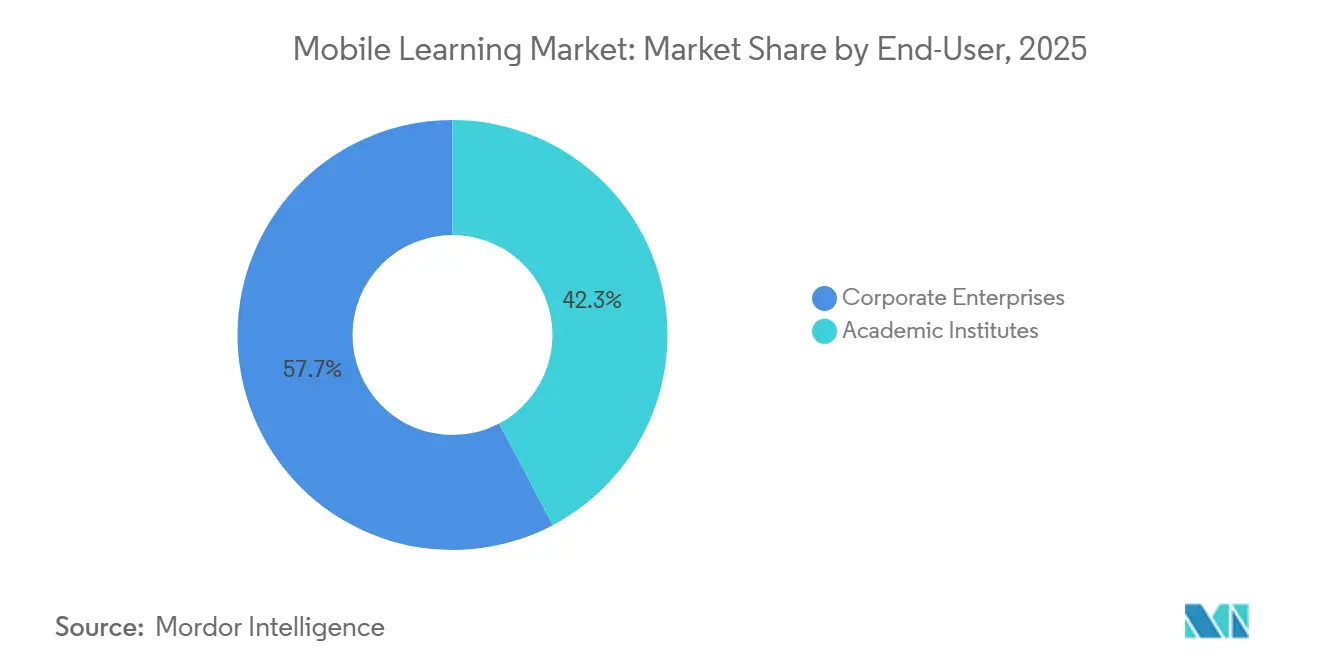
Enterprises Narrow the Spend GapAcademic institutes accounted for 42.27% of 2025 outlays, supported by government mandates in India and China that require curricula to be mobile‑accessible. These policies have accelerated universities’ adoption of mobile learning platforms to meet compliance standards and broaden access. At the same time, institutions are recognizing that building proprietary systems is costly and slow to scale. As a result, many are partnering with established platform providers to remain relevant, offering degree credits that wrap around modular, stackable micro‑learning units rather than relying on traditional, standalone digital solutions.
Meanwhile, corporate enterprises, projected to grow at a 16.02% CAGR, are positioned to overtake academia by 2031. This shift is driven by organizations embedding skills-oriented micro‑badges directly into promotion criteria and talent‑development frameworks, making mobile learning a strategic component of workforce advancement. Growth is further amplified by HR‑tech integrations, which automate employee enrollment whenever new systems launch or regulatory requirements change. These automations help companies maintain compliance while lowering administrative overhead, strengthening the corporate segment’s momentum in the mobile learning market.
By Provider Type:
Content Specialists Hold Share amid Margin CompressionContent providers held 36.59% of mobile learning revenue in 2025 and are projected to grow at a 17.83% CAGR through 2031, but their margins face pressure as generative AI enables enterprises to create internal learning materials at dramatically lower cost. Despite this shift, content curators continue to retain leadership where specialized domain expertise, such as pharmaceutical regulation or nuclear safety, cannot be easily commoditized. Their defensibility rests on deep, compliance‑intensive knowledge that organizations cannot replicate with general-purpose AI models.
Platform suppliers, in turn, are responding to this dynamic by acquiring niche content studios and integrating proprietary libraries with delivery, analytics, and administration features to secure multi‑year bundled contracts. As integration work becomes increasingly automated, service providers are moving up‑market as well, expanding into strategy, measurement, and advisory offerings rather than relying on traditional implementation hours. This repositioning across the ecosystem reflects broader shifts in how mobile learning value is created and captured.
Geography Analysis
North America Mobile Learning Market
North America commanded 31.36% of 2025 global revenue, supported by clear FERPA guidance that eased data-sharing concerns for institutional deployments. Fortune 500 companies spend USD 1,200 per employee annually on mobile L&D, and Canada’s federal directive to migrate all civil-service training to mobile platforms by 2027 adds USD 330 million in incremental procurement. Mexico’s automotive clusters follow suit, rolling out Spanish-language apps for shift workers.
APAC Mobile Learning Market
Asia Pacific is the fastest-growing arena at 18.15% CAGR to 2031, powered by India’s DIKSHA platform’s 6 billion sessions in 2024 and China’s upcoming 2027 deadline for mobile-ready K-12 content.[3] Japan earmarked JPY 240 billion (USD 1.6 billion) to retrofit public schools, and South Korea leverages domestic OEM strength - Samsung cut new-hire training costs 35% using internal mobile tools. Uneven infrastructure tempers gains in Indonesia and the Philippines, though offline-sync capabilities partly offset network gaps.
EMEA and South America Mobile Learning Market
Europe trails at mid-teens growth due to GDPR compliance costs that average EUR 2.3 million (USD 2.6 million) per rollout. Germany’s apprenticeship system integrates mobile modules, and the United Kingdom’s visa points regime tied to digital credentials drove a 40% increase in micro-badge enrollments. South America, Middle East, and Africa remain longer-term plays yet reveal pilot momentum: Brazil equips 5,000 rural schools, Saudi Arabia allocates SAR 18 billion (USD 4.8 billion) under Vision 2030, and Nigeria mandates mobile content across 170 universities.
Regulatory Landscape
Mobile learning deployments face overlapping privacy, security, and platform-governance rules because learner data and third-party content often move through consumer devices and cloud services. In the United States, education-sector implementations are shaped by FERPA and PPRA expectations alongside federal procurement security baselines, including NIST SP 800-53 controls and FIPS 199 impact-level categorization. The U.S. Department of Education published department-wide security and privacy requirements (2024) and acquisition standards (2025), which influence how vendors are assessed for institutional use.
In Europe, the Digital Services Act (Regulation (EU) 2022/2065) adds obligations for certain intermediary services, including learning platforms that host or moderate third-party content. This increases requirements around transparency and accountability for platform operations in the EU. At the intergovernmental level, UNESCO, UNICEF, and the ITU issued the Charter for Public Digital Learning Platforms in March 2026, pointing toward publicly governed digital learning ecosystems and interoperability with national digital public infrastructure. That policy direction is likely to affect vendor selection criteria for public-sector rollouts.
Value Chain Analysis
The mobile learning value chain covers content creation and licensing (publishers, universities, training studios), platform software (LMS/LXP and mobile authoring), device and OS ecosystems (smartphones and tablets), connectivity and cloud delivery (telcos, CDNs, cloud and data centers), and integration and services (identity, HRIS, analytics, cybersecurity, implementation partners). Distribution typically follows enterprise procurement and academic or public tenders, with channel partners and systems integrators packaging deployment, single sign-on, and data governance to meet buyer requirements.
Standards and public programs are increasing the weight of compliance and interoperability work inside the chain. China formalized technical expectations through GB/T 46348-2025 (mobile learning terminal functional requirements) and GB/T 21644-2025 (general requirements for network distance learning platforms), both effective May 1, 2026, pushing vendors and device partners toward standardized capabilities. Public-sector funding and guidance also shape downstream delivery models, including Australia’s March 2026 Mobile TAFE guidelines and Hong Kong’s 2026/27 Quality Education Fund e-Learning Funding Programme, which emphasize equitable access, device provisioning, and partnerships for remote and underserved communities.
Competitive Landscape
The top ten players, including SAP, Microsoft, Adobe, Coursera, Skillsoft, Cisco, Udemy, Blackboard, Docebo, and Cornerstone OnDemand, hold roughly 40% of revenue, signaling moderate concentration. Platform consolidation intensifies as suites bundle authoring, delivery, and analytics into single subscriptions, curbing churn by raising switching costs. Microsoft embedded Copilot into Viva Learning in 2024, curating courses based on calendar slots, while Coursera’s real-time adaptive micro-courses illustrate a pivot toward active career navigation.
Geographic expansion defines another axis: North American incumbents partner with Asia Pacific distributors to localize content and comply with data residency laws. Technology differentiation now hinges on offline modes and adaptive streaming that sustain the mobile learning market in low-bandwidth regions. Meanwhile, device OEMs such as Apple are patenting context-aware notifications, which threaten to make course delivery a native operating-system feature, potentially commoditizing standalone LMS front-ends.[4] To hedge, vendors focus on content curation, compliance analytics, and vertical domain depth that hardware makers cannot replicate easily. Standardization around xAPI shrinks vendor lock-in but widens data-analytics opportunities for providers that turn granular learning records into workforce insights.
Mobile Learning Industry Leaders
-
SAP SE
-
Microsoft Corporation
-
Adobe Inc.
-
Skillsoft Corporation
-
Cisco Systems, Inc.
- *Disclaimer: Major Players sorted in no particular order
Mobile Learning Market Companies Covered in this Report
- SAP SE
- Microsoft Corporation
- Adobe Inc.
- Skillsoft Corporation
- Cisco Systems, Inc.
- Citrix Systems, Inc.
- Dell Technologies Inc.
- International Business Machines Corporation
- AT&T Inc.
- Upside Learning Solutions Pvt. Ltd.
- Learning Technologies Group plc
- Coursera Inc.
- Udemy, Inc.
- D2L Corporation
- Blackboard Inc.
- Docebo Inc.
- Cornerstone OnDemand, Inc.
- Pluralsight, Inc.
- 360Learning SA
- Allen Interactions Inc.
- Instructure Holdings, Inc.
- Google LLC
- Apple Inc.
- Oracle Corporation
- Promethean Limited
- NetDimensions Limited
Market Opportunities and Future Outlook
A key whitespace is public-sector and donor-backed digitization where mobile delivery is tied to equity and infrastructure upgrades rather than standalone software purchases. In June 2026, the Asian Development Bank signed a USD 10 million financing package with Schoolnet India Limited to scale digital learning infrastructure across 30,000 government schools in India. This creates near-term demand for mobile-ready content, device-management, offline synchronization, and administrator analytics that need to operate under public procurement and student privacy constraints. Hong Kong’s Education Bureau Circular Memorandum No. 73/2026 for the Quality Education Fund e-Learning Funding Programme also reinforces device access and internet support as procurement triggers for blended and mobile learning in public-sector schools.
Another opportunity is in the compute and delivery layer needed for AI-assisted learning experiences, particularly where organizations prioritize low-latency personalization, study assistance, and content generation at scale while maintaining security controls. In July 2026, Nxtra (Bharti Airtel) announced plans to expand AI-ready data center capacity to 1 GW across major Indian metros, strengthening local hosting and performance options for platforms serving large learner bases and data residency-sensitive deployments. As generative AI becomes embedded into learning suites, vendors that combine mobile delivery with identity, governance, and analytics integration have a clearer path to win bundled platform deals, especially for enterprise BYOD environments where security and data handling remain core selection criteria.
Recent Industry Developments in Mobile Learning Market
- May 2026: SAP integrated Google Cloud’s NotebookLM into SAP Learning Hub to generate study guides and podcasts from course materials. This integration strengthens AI-assisted learning workflows inside a major enterprise training ecosystem, and it raises the benchmark for personalization and content consumption on mobile devices.
- January 2025: Pearson and Microsoft announced a multiyear partnership to apply AI to learning and work experiences. The collaboration links productivity and learning environments more tightly, supporting mobile-first delivery where training is consumed inside daily workflow tools.
- December 2024: Skillsoft expanded its partnership with SAP to support skills-based workforce planning and talent development. The deeper integration between content, skills data, and enterprise HR processes supports bundled mobile learning deployments that prioritize measurable skills outcomes over standalone course libraries.
Mobile Learning Market Report Scope and Research Methodology
Market Definition and Coverage
For this study, the mobile learning market covers revenues earned from learning content and learning services that are designed to be accessed mainly through smartphones and tablets for academic and workplace training.
Scope exclusions: We exclude general-purpose device hardware sales and telecom connectivity charges that are not priced as part of a learning offering.
Segments Covered in This Report
- By Solution
- E-Books
- Interactive Assessment
- Mobile and Video-Based Courseware
- M-Enablement
- Other Solutions
- By Application
- In-Class Learning
- Corporate Learning
- Simulation-Based Learning
- Online On-the-Job Training
- Independent Learning
- By End-User
- Academic Institutes
- Corporate Enterprises
- By Provider Type
- Content Providers
- Service Providers
- By Geography
- North America
- United States
- Canada
- Mexico
- South America
- Brazil
- Argentina
- Rest of South America
- Europe
- Germany
- United Kingdom
- France
- Italy
- Spain
- Rest of Europe
- Asia-Pacific
- China
- Japan
- India
- South Korea
- ASEAN
- Rest of Asia-Pacific
- Middle East
- Saudi Arabia
- United Arab Emirates
- Rest of Middle East
- Africa
- South Africa
- Nigeria
- Rest of Africa
- North America
Data Sources, Market Sizing, and Validation
Desk Research
Desk work starts with public signals that help us size the demand pool and keep definitions consistent across regions. We use sources such as ITU connectivity indicators, UNESCO education statistics, World Bank macro series, and OECD education and skills releases to understand learner access, digital readiness, and spend capacity.
We also refer to company filings, investor presentations, and credible press coverage to ground revenue mix, subscription behavior, and regional exposure for major providers. Where needed, paid subscriptions that compile company financials, news, and patent activity are used to speed up cross-checks, especially when disclosures vary by geography. The sources listed here are illustrative, and many other public documents and datasets were also used for data collection, validation, and clarification.
Primary Interviews and Surveys
Primary work is used to pressure-test pricing logic and adoption assumptions that are not always visible in public releases. We spoke with a mix of content providers, service providers, and buyers across education and corporate learning, then checked how those assumptions play out across APAC, EMEA, and the Americas, where purchasing cycles and mobile usage patterns differ. The goal was to make sure the model reflects how renewal timing and mobile-first adoption affect realized revenue.
Distribution of primary research fieldwork respondents
| Company type | Respondent position | Region |
|---|---|---|
| Top tier: 34% | CXOs: 21% | APAC: 39% |
| Mid tier: 45% | Functional/Unit leaders: 24% | EMEA: 35% |
| Smaller Players: 21% | Managers: 55% | Americas: 26% |
Market-Sizing & Forecasting
Our market model starts with a top-down demand build using the addressable learner base and training demand, then filters through mobile access and willingness to pay for paid learning formats. That structure is corroborated with selective bottom-up checks, mainly through sampled vendor revenues, channel checks, and volume times ASP sanity checks to adjust totals where the top-down view looks too loose.
Key inputs include smartphone penetration and mobile broadband use, participation in corporate training and formal education, subscription versus license pricing patterns, typical courseware and assessment attach rates, and regional digital learning policy momentum. Forecasts are built using scenario analysis, where adoption pace and price progression assumptions are aligned with what interviewees expect for renewals, new cohort additions, and freemium-to-paid conversion. When company-level disclosures are incomplete, gaps are handled through peer benchmarking by region and use case, followed by a reconciliation pass so the summed pieces do not overstate the total market.
Data Validation & Update Cycle
Validation is done through multiple checks that compare the model outputs against independent signals, including direction of learning software spend, mobile usage intensity, and vendor revenue exposure described in public filings. Outliers are reviewed, assumptions are revisited, and follow-up calls are triggered when a regional split or an implied ASP change sits outside a reasonable range.
Before sign-off, results go through a multi-step internal review so definitions, math, and units stay consistent across years. Reports are refreshed annually, with interim updates made when material changes could shift adoption or pricing assumptions, followed by a final pre-delivery review to ensure clients receive the latest view.
Mordor Intelligence's Mobile Learning Market Estimate Compared With Other Published Estimates
Published market values for mobile learning can look far apart because the update timing, the currency conversion window, and the way recurring subscriptions are annualized are not handled in the same way by every publisher. Differences also show up when one estimate leans heavily on rapid-growth assumptions without enough checks on what buyers actually renew and pay.
A common gap driver is how providers treat pricing, where some estimates push ASP increases uniformly even when renewal discounts and freemium usage reduce realized revenue. Another frequent reason is scope alignment, since a few figures blend adjacent digital learning categories or apply broad adoption rates without tying them back to mobile access and paid learner cohorts.
Benchmark comparison
| Source | Market Size | Gaps in Research Methodology |
|---|---|---|
| Mordor Intelligence | USD 95.77 B (2026) | |
| Trade Journal A | USD 57.46 B (2024) | Uses an earlier-year snapshot with different currency timing and a shorter forecast window, and the scope and pricing treatment for subscriptions versus licenses are not clearly reconciled to paid learner cohorts. |
| Industry Brief B | USD 68.36 B (2023) | Often reported from press-style summaries that emphasize high near-term growth, with limited visibility into how ASP is annualized and whether freemium usage is separated from paid revenues across regions. |
The spread is mainly explained by refresh cadence and revenue normalization choices, especially around subscription annualization and the currency window used for conversion, which are handled with explicit checks in Mordor Intelligence. With assumptions tied back to mobile access, paid adoption, and realistic pricing behavior, the resulting number stays traceable to inputs that can be reviewed and repeated.
Key Questions Answered in the Report
What is the mobile learning market size in 2026 and its projected value by 2031?
Spending reached USD 110.99 billion in 2026 and is forecast to scale to USD 232.01 billion by 2031, reflecting a 15.89% CAGR.
Which region is expanding fastest in mobile learning between 2026 and 2031?
Asia Pacific is pacing the field with an 18.15% CAGR, led by large-scale national programs in India and China.
How fast is simulation-based learning projected to grow within mobile learning?
Simulation-based use cases are expected to advance at a 17.33% CAGR through 2031, the highest rate among application segments.
What share did e-books hold in the solution category in 2025?
E-books accounted for 30.46% of solution revenue in 2025, remaining the largest single format due to low production and offline-reading benefits.
Who are the leading companies accounting for roughly 40% of mobile learning revenue?
SAP, Microsoft, Adobe, Coursera, Skillsoft, Cisco, Udemy, Blackboard, Docebo, and Cornerstone OnDemand collectively hold about 40% of global revenue.
How does a bring-your-own-device policy influence corporate learning budgets?
BYOD trims hardware outlays by 40%-60%, shifting spend toward mobile threat-defense tools yet still delivering a net cost advantage that accelerates mobile learning adoption.