Mobile Application Market Size and Share
Market Overview
| Study Period | 2020 - 2031 |
|---|---|
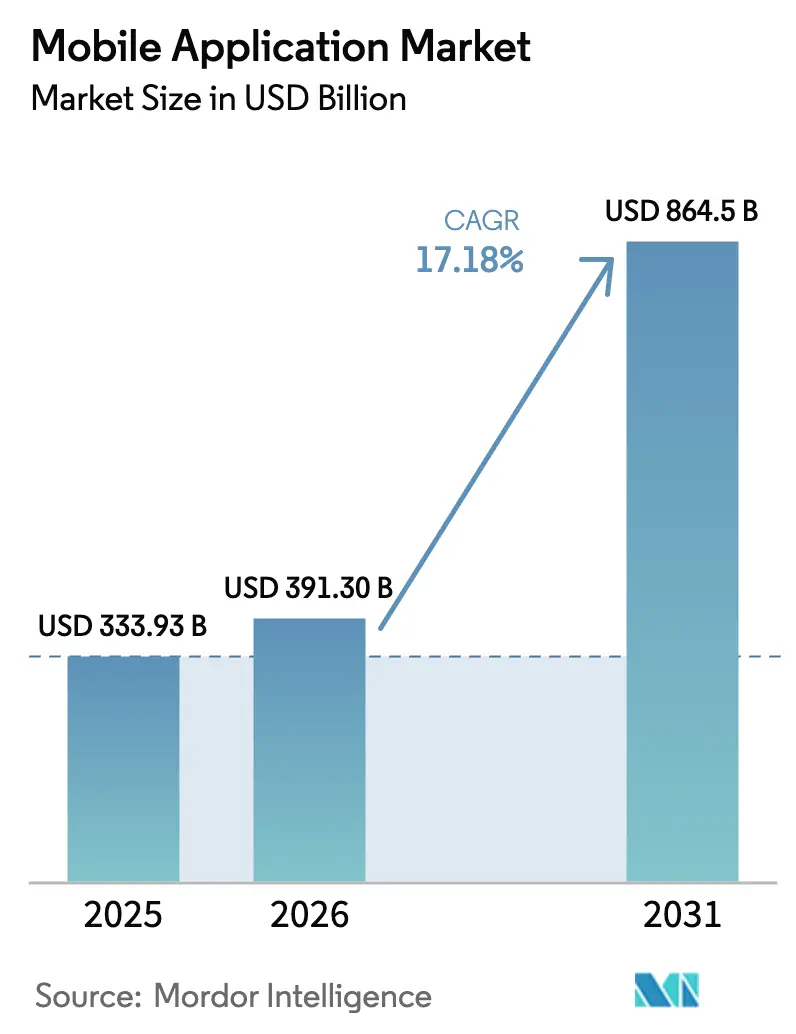
| Market Size (2026) | USD 391.3 Billion |
| Market Size (2031) | USD 864.5 Billion |
| Growth Rate (2026 - 2031) | 17.18% CAGR |
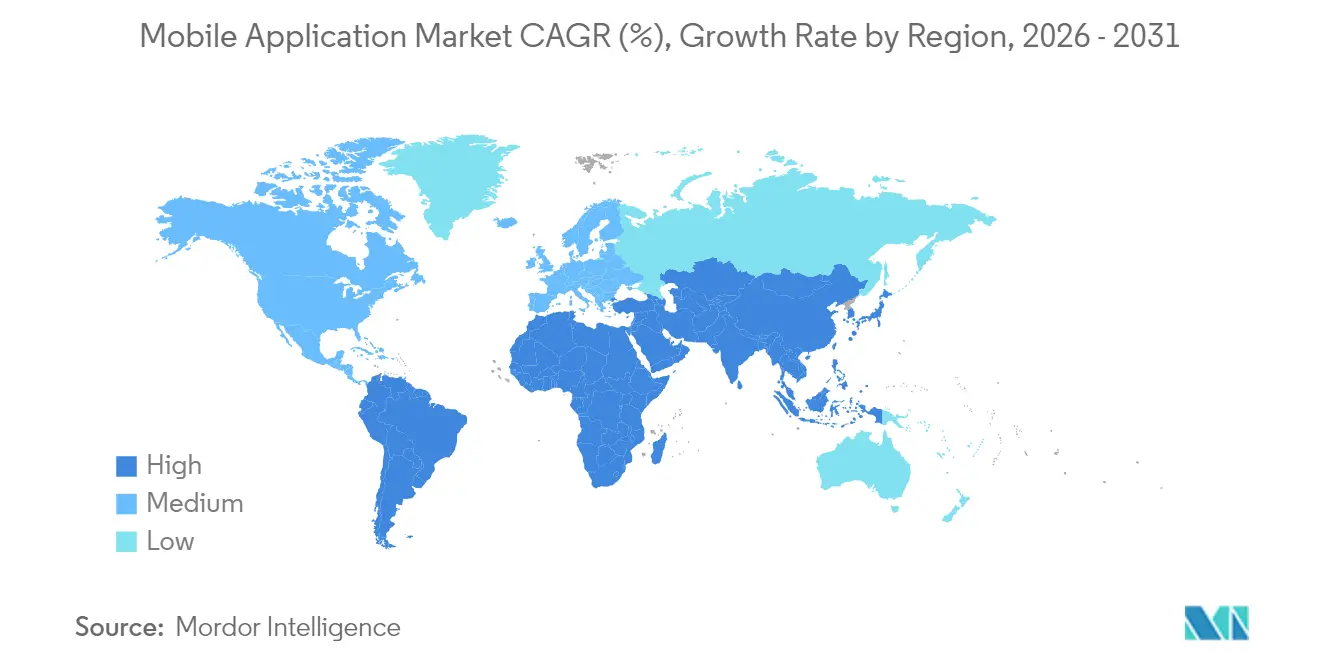
| Fastest Growing Market | South America |
| Largest Market | Asia Pacific |
| Market Concentration | Medium |
Major Players *Disclaimer: Major Players sorted in no particular order Image © Mordor Intelligence. Reuse requires attribution under CC BY 4.0. | |
Mobile Application Market Analysis by Mordor Intelligence
The mobile application market size is expected to grow from USD 333.93 billion in 2025 to USD 391.3 billion in 2026 and is forecast to reach USD 864.5 billion by 2031 at 17.18% CAGR over 2026-2031. Demand shifts toward AI-embedded functionality, platform diversification, and frictionless payment experiences are strengthening revenue opportunities even as mature markets approach download saturation. Commercial 5G rollouts are fostering high-fidelity streaming, low-latency gaming, and extended-reality use cases, while generative-AI software development kits (SDKs) enable real-time personalisation that raises lifetime value per user. Asia-Pacific remains the primary growth engine thanks to super-app ecosystems, whereas Latin America is gaining momentum through digital financial-inclusion initiatives. Monetisation strategies are also evolving: in-app purchases still lead, yet subscriptions and hybrid models are scaling quickly as developers seek predictable cash flows and lower user-acquisition costs
Key Report Takeaways
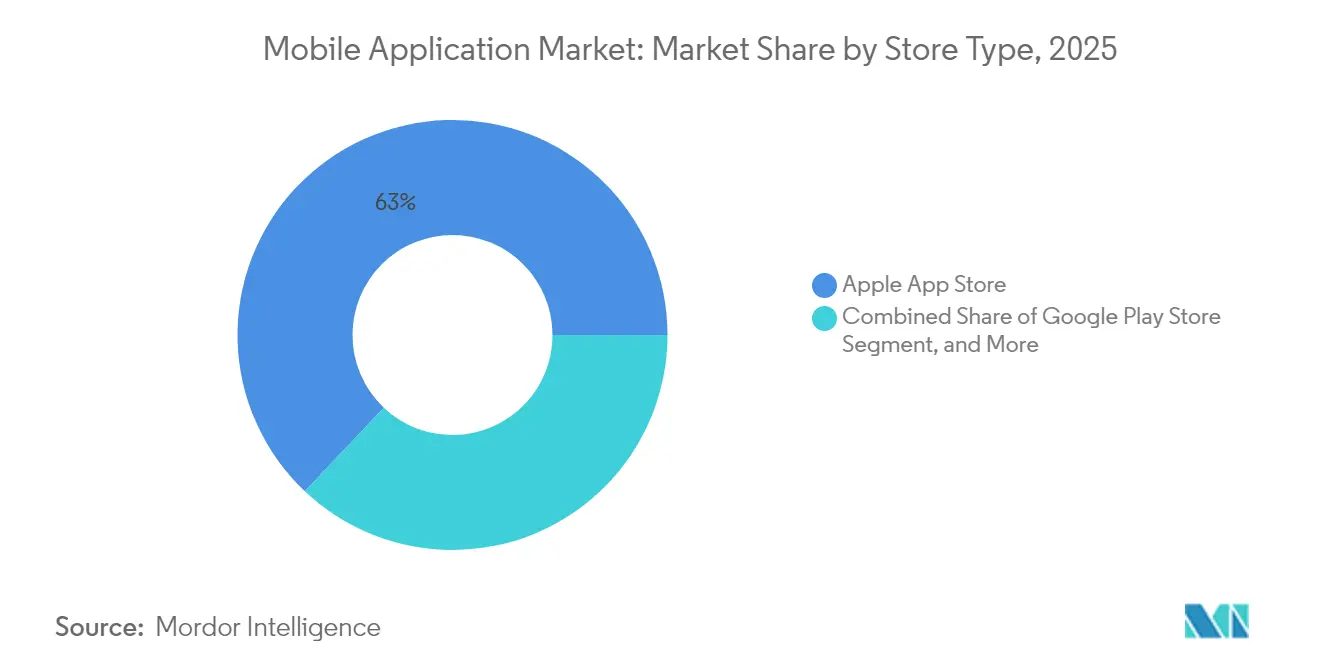
- By store type, Apple App Store led with 62.95% of mobile application market share in 2025; third-party Android stores are projected to expand at a 12.18% CAGR during 2026-2031.
- By application category, gaming retained 43.00% revenue share in 2025; health and fitness is forecast to soar at a 15.05% CAGR through 2031.
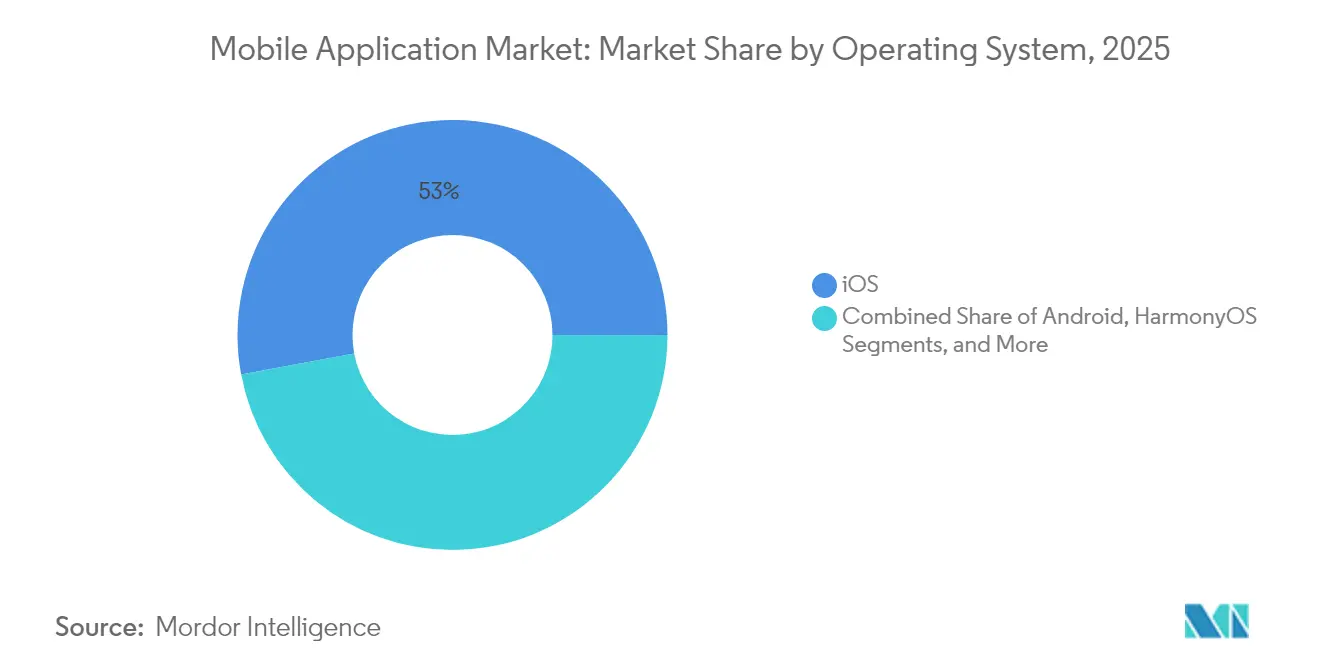
- By operating system, iOS held 52.95% of the mobile application market size in 2025, while HarmonyOS is set to grow at 17.08% CAGR between 2026-2031.
- By monetisation model, in-app purchases accounted for 48.85% of the mobile application market size in 2025; subscriptions show the fastest growth at a 16.22% CAGR to 2031.
- By geography, Asia-Pacific captured 39.35% of mobile application market share in 2025; South America is the quickest-expanding region at 12.07% CAGR for 2026-2031.
Note: Market size and forecast figures in this report are generated using Mordor Intelligence’s proprietary estimation framework, updated with the latest available data and insights as of 2026.
Global Mobile Application Market Trends and Insights
Driver Impact Analyis*
| Driver | (~) % Impact on CAGR Forecast | Geographic Relevance | Impact Timeline |
|---|---|---|---|
| Mass-market 5G rollouts lift high-fidelity app usage | +3.2% | Global, with Asia-Pacific and North America leading adoption | Medium term (2-4 years) |
| Generative-AI SDK integrations accelerate app monetisation | +4.1% | Global, concentrated in developed markets initially | Short term (≤ 2 years) |
| Super-app and mini-program adoption in emerging Asia | +2.8% | Asia-Pacific core, spill-over to Latin America and Africa | Long term (≥ 4 years) |
| Cloud gaming subscriptions boost in-app spending | +1.9% | North America, Europe, and urban Asia-Pacific markets | Medium term (2-4 years) |
| Privacy-preserving ad-tech raises CPMs for quality apps | +2.3% | Global, with EU and North America regulatory focus | Short term (≤ 2 years) |
| Low-code/no-code platforms widen long-tail developer base | +1.5% | Global, with enterprise adoption in developed markets | Long term (≥ 4 years) |
| Source: Mordor Intelligence | |||
Mass-market 5G Rollouts Lift High-Fidelity App Usage
Commercial 5G networks deliver sub-10 millisecond latency and gigabit throughput, allowing real-time augmented-reality navigation, remote industrial control, and high-definition cloud gaming that were previously impractical on mobile devices [1]Verizon Business, “5G Edge and Network Slicing Use Cases,” verizon.com. Mobile operators report a 25% uplift in session length when load times fall below two seconds, and device densification of up to 1 million connections per square kilometre widens the addressable base to IoT endpoints. Developers that optimise for 5G experience up to 50% faster rendering versus 4G, translating into superior user retention and monetisation.
Generative-AI SDK Integrations Accelerate App Monetisation
AI-enabled features drove in-app consumer spend to USD 150 billion in 2024, with real-time recommendation engines boosting conversion and average revenue per daily active user. Accessible SDKs mean mid-tier studios can embed language or image synthesis without maintaining costly models, facilitating premium tiers and personalised upsells. The global AI software economy is expected to exceed USD 826 billion by 2030, and mobile channels are on track to absorb a substantial slice of that value creation.
Super-App and Mini-Program Adoption in Emerging Asia
Platforms like WeChat illustrate the power of embedded services: over 1.3 billion monthly users can move from chat to payment to ride-hailing without downloading extra apps, lowering both data usage and discovery friction. Forty-eight percent of Asia-Pacific enterprises already develop for super-apps, compared with 33% in the West, showing a clear regional preference for integrated mobile journeys. Mini-programs further compress distribution costs by providing instant-use experiences inside the parent super-app.
Cloud Gaming Subscriptions Boost In-App Spending
Cloud gaming revenues are projected to jump from USD 2.4 billion in 2024 to USD 8.2 billion in 2025, raised by advancing 5G and edge compute footprints [2]Ericsson Mobility Report, “Cloud Gaming Primed for Growth,” ericsson.com. Remote rendering eliminates device-spec limitations, inviting mainstream users into premium content via subscription bundles such as Xbox Cloud Gaming. Subscriber counts may reach 87 million next year, with operators crafting experience-based data plans to monetise surging bandwidth demand.
Restraint Impact Analysis*
| Restraint | (~) % Impact on CAGR Forecast | Geographic Relevance | Impact Timeline |
|---|---|---|---|
| App-store commission backlash and alternative billing | -2.1% | Global, with regulatory focus in EU, US, and South Korea | Short term (≤ 2 years) |
| Saturation in mature markets curbs download growth | -1.8% | North America, Western Europe, developed Asia-Pacific markets | Medium term (2-4 years) |
| Regulatory scrutiny of kids' data and addictive design | -1.2% | Global, with stricter enforcement in EU and US | Long term (≥ 4 years) |
| Persistent network gaps in frontier economies | -0.9% | Sub-Saharan Africa, rural Latin America, remote Asia | Long term (≥ 4 years) |
| Source: Mordor Intelligence | |||
App-Store Commission Backlash and Alternative Billing
Legislators are challenging 30% commission norms: South Korea mandates outside payment options, Google agreed to a USD 700 million US settlement, and the Epic-Apple ruling permits steering users to external gateways. Developers welcome larger revenue retention but face added compliance complexity. Platforms must therefore justify fees through enhanced discovery tools, security vetting, and workflow automation or risk revenue erosion.
Saturation in Mature Markets Curbs Download Growth
Install volumes are plateauing in North America and Western Europe where device penetration nears 90% and users exhibit “app fatigue.” Revenue now relies on retention and deeper engagement rather than raw download acquisition. This dynamic shifts marketing budgets to loyalty features, pushes publishers to explore untapped demographics, and elevates emerging regions as primary engines of user-base expansion.
*Our forecasts treat driver/restraint impacts as directional, not additive. The impact forecasts reflect baseline growth, mix effects, and variable interactions.
Segment Analysis
By Store Type: Platform Diversification Accelerates
Apple App Store captured 62.95% of mobile application market share in 2025, making it the single largest distribution channel. The store’s strict review guidelines and strong spending power among iOS users translate into higher average revenue per user, sustaining its primacy in the mobile application market. Yet regulatory scrutiny and antitrust cases have weakened the historic gatekeeping advantage, encouraging developers to experiment with multi-channel strategies.
Third-party Android stores are scaling at a 12.18% CAGR for 2026-2031, notably in China, India, and parts of Southeast Asia where OEM-backed storefronts or regional champions offer preferential rates. Progressive Web Applications (PWAs) further dilute dependence on native stores by providing app-like experiences accessible directly via mobile browsers. Collectively, these channels lower commission outflows for publishers while widening geographical reach, thereby expanding the mobile application market size available to long-tail developers.


By Application Category: Health Apps Surge Past Gaming
Gaming retained a dominant 43.00% revenue slice of the mobile application market in 2025 as AAA publishers, casual studios, and hyper-casual innovators continued to monetise through layered in-app purchases. Cloud streaming extensions promise to extend lifecycle value by delivering console-grade visuals over 5G. In contrast, health and fitness applications are projected to grow at 15.05% CAGR through 2031, reflecting post-pandemic prioritisation of wellness and the integration of wearable biosensors that feed personalised coaching.
Subscription-based mindfulness programs, telehealth consultations, and AI-powered nutrition plans are helping wellness apps close the monetisation gap with gaming. As a result, the mobile application market size attributed to digital health is forecast to rise markedly, positioning the category as a new revenue pillar. The shift forces incumbents in lifestyle segments to differentiate through clinical partnerships, regulatory compliance, and data security credentials while gaming studios double down on community, competitive events, and cross-platform continuity.
By Operating System: HarmonyOS Disrupts Duopoly
iOS accounted for 52.95% of the mobile application market size in 2025, underpinned by higher per-capita spending and a robust device upgrade cycle. Android still dominates device unit share globally but faces fragmentation that complicates optimisation for the exploding range of chipsets and screen formats. Huawei’s HarmonyOS is altering competitive dynamics, registering 17% national share and expanding at 17.08% CAGR on policy support and seamless cross-device experiences.
HarmonyOS’s microkernel design runs efficiently on smartphones, tablets, and IoT appliances, reducing porting overhead for developers seeking multi-device presence. As it surpasses iOS inside China, international expansion plans could erode the traditional two-horse race and further fragment the mobile application market. Developers must therefore embrace adaptive frameworks and automated testing to ensure smooth performance across a multiplying list of operating systems.
By Monetisation Model: Subscriptions Gain Momentum
In-app purchases secured 48.85% of the mobile application market size in 2025, benefiting from proven pricing psychology and impulse-driven microtransactions. However, subscriptions are growing the fastest at 16.22% CAGR as studios and enterprises chase predictable monthly recurring revenue. Cross-vertical successes—from streaming media to flash-learning apps—validate the model’s resilience even when user growth slows.
Retention remains the core challenge: only 10% of subscribers typically stay beyond twelve months, nudging publishers toward personalised content, gamified loyalty perks, and granular billing tiers. Hybrid models combining subscriptions with à-la-carte in-app purchases or contextual ads are gaining favour, allowing price-sensitive cohorts to engage while high-value users upgrade to premium bundles. The evolution reinforces the broader trend of revenue diversification within the mobile application market.
Geography Analysis
Asia-Pacific generated 39.35% of mobile application market revenue in 2025, accelerated by super-app ecosystems that weave payments, mobility, and commerce into single interfaces. Rapid smartphone adoption, favourable demographics, and pragmatic regulatory postures underpin multi-layered monetisation. Super-app leaders such as Grab and Gojek illustrate how payments confer network effects, keeping users in-app longer and fuelling cross-sell opportunities .
South America is the fastest-growing region at 12.07% CAGR between 2026 and 2031. Brazil alone contributed USD 520 billion to regional gross domestic product through its mobile economy in 2024 while mobile-internet availability reached 65% of citizens GSMA. Fintech apps, particularly instant-payment solutions like PIX, lower cash reliance and drive first-time digital engagement, enlarging the mobile application market. Argentina, Colombia, and Chile follow a similar trajectory, aided by proliferating affordable 4G handsets and accelerating 5G launches.
North America sustains revenue leadership due to high consumer spending and sophisticated ad-tech. Yet growth rates are moderating because of app-store saturation and privacy-first operating-system policies that raise acquisition costs. Europe grapples with Digital Markets Act enforcement, forcing platforms to open APIs and permit sideloading, yet remains an attractive premium-content market thanks to robust digital-payments penetration. The Middle East and Africa are earlier in the adoption curve: mobile technologies added USD 310 billion or 5.5% of GDP in 2024, but patchy rural coverage still suppresses the region’s full mobile application market potential. Infrastructure investment and localisation strategies will determine whether these frontier economies can unlock the next wave of user growth.
Mordor Intelligence provides coverage of the mobile application market across other key regional markets. Detailed country-level analysis extends to United States incorporating local coverage and market participation, as required.

Competitive Landscape
Competition in the mobile application market is tightening as the lines blur between storefronts, cloud hosts, payment gateways, and content publishers. Apple and Google are under regulatory scrutiny regarding commissions, spurring them to double down on value-added developer services such as advanced analytics and privacy-preserving ad networks. Huawei is moving fast with HarmonyOS and its AppGallery, benefiting from domestic device dominance and favourable policy, yet needs international developer mindshare to sustain momentum.
Meanwhile, Meta generated USD 164.50 billion in 2024 largely via mobile advertising, underscoring the scalability of data-driven ad models even as tracking restrictions stiffen. The proliferation of low-code/no-code platforms-forecast to approach USD 65 billion revenue by 2027—lowers the barrier for non-technical creators, crowding app stores with niche utilities and specialized business tools. Strategic partnerships around AI inference engines, telco billing, and edge compute are emerging as contenders search for defensible niches.
White-space opportunities are materializing in in-vehicle infotainment, privacy-first social platforms, and rural-oriented fintech. Cross-platform tool chains have become critical as publishers target iOS, Android, HarmonyOS, and PWAs concurrently. Overall, sustained investment in AI, network optimisation, and creative monetisation differentiates leaders from the long tail in the competitive mobile application market.
Mobile Application Industry Leaders
Apple Inc.
Google LLC
Tencent Holdings Ltd.
ByteDance Ltd.
Meta Platforms, Inc.
- *Disclaimer: Major Players sorted in no particular order


Recent Industry Developments
- June 2025: Apple announced App Store supported USD 1.3 trillion in billings and sales during 2024, with the majority generated outside commissionable digital goods.
- June 2025: Korean game publishers filed a USD 7.4 billion class-action lawsuit against Google in the US over in-app payment fees, escalating global regulatory pressure.
- May 2025: Phunware reported a 40% year-over-year increase in software-subscription revenue, launched an AI Concierge for hospitality, and secured a USD 0.5 million booking with a healthcare facility.
- April 2025: The US Federal Trade Commission finalised COPPA amendments adding biometric identifiers to the definition of personal information, expanding compliance obligations for child-directed apps.


Research Methodology Framework and Report Scope
Market Definitions and Key Coverage
Our study, according to Mordor Intelligence, classifies the mobile application market as all revenue captured from paid downloads, in-app purchases, subscription fees, and advertising tied to consumer and enterprise native apps running on mobile operating systems such as Android, iOS, and HarmonyOS. The market is valued at USD 228.98 billion in 2024 and is forecast to reach USD 352.28 billion by 2029.
Scope Exclusions: We do not include mobile-optimized web pages, pre-installed OEM widgets, or revenue derived from device hardware.
Segmentation Overview
- By Store Type
- Google Play Store
- Apple App Store
- Third-Party Android Stores
- Progressive Web Apps (PWAs)
- By Application Category
- Gaming
- Social Networking and Communication
- Entertainment and Media
- Health and Fitness
- Retail and E-Commerce
- Travel and Hospitality
- Education and Learning
- Financial Services and FinTech
- Other Categories
- By Operating System
- Android
- iOS
- HarmonyOS
- Others
- By Monetization Model
- Paid Apps
- In-App Purchase (IAP)
- Subscription-Based
- Advertising-Supported
- By Geography
- North America
- United States
- Canada
- Mexico
- South America
- Brazil
- Argentina
- Rest of South America
- Europe
- Germany
- United Kingdom
- France
- Italy
- Spain
- Russia
- Rest of Europe
- Asia-Pacific
- China
- Japan
- India
- South Korea
- Australia and New Zealand
- Rest of Asia-Pacific
- Middle East and Africa
- Middle East
- Saudi Arabia
- UAE
- Turkey
- Rest of Middle East
- Africa
- South Africa
- Nigeria
- Kenya
- Rest of Africa
- Middle East
- North America
Detailed Research Methodology and Data Validation
Primary Research
Analysts held structured calls with independent developers, mobile-ad network executives, and enterprise mobility buyers across North America, Europe, and Asia-Pacific. Their insights refined blended selling prices, validated freemium uptake ratios, and tested adoption drivers that secondary data could not fully surface.
Desk Research
We began by mapping demand indicators from open datasets such as the IMF ICT expenditure tables, ITU mobile-broadband penetration files, and GSMA subscription trackers. Trade bodies like the Mobile Marketing Association, patent clusters retrieved through Questel, and FTC disclosures on app-store billing patterns highlighted emerging revenue levers. Company 10-Ks, developer presentations, and Dow Jones Factiva newsfeeds supplied historical financials for leading publishers. These sources are illustrative; many additional materials informed data collection, validation, and clarification.
Market-Sizing & Forecasting
We reconstructed 2024 value through a top-down reconciliation of global mobile media spend, allocating shares to paid downloads, subscriptions, and ad-supported impressions before cross-checking results against sampled publisher revenues. Supplier roll-ups of SDK deployments and channel checks on aggregator payouts offered a selective bottom-up sense check. Key variables like active smartphone base, average revenue per user, session length, regulatory fee shifts, and enterprise mobility budgets feed a multivariate regression that projects quarterly totals to 2029. Regional gaps in survey depth were bridged with smartphone penetration deltas.
Data Validation & Update Cycle
Every quarter, Mordor analysts rerun variance screens, benchmark outputs against GSMA traffic tallies, and re-contact experts if deviations cross preset thresholds. Reports refresh annually, with interim flashes issued for material platform or policy events.
Why Mordor's Mobile Application Market Baseline Commands Confidence
Published estimates often diverge because firms define revenue pools, base years, and refresh cadences differently. One external consultancy pegged 2022 revenue at USD 206.85 billion. A trade journal placed 2024 sales at USD 240.94 billion after counting gross in-app commerce flows. Our team discloses scope boundaries, aligns currency conversions, and updates assumptions whenever platform rules or ad-tech regulations shift.
Key gap drivers include the omission of in-app advertising in some studies, separate treatment of mobile gaming micro-transactions in others, and aggressive ARPU multipliers that ignore store-commission netting. Because we triangulate official store payouts with developer surveys, our 2024 baseline remains balanced and transparent.
Benchmark comparison
| Market Size | Anonymized source | Primary gap driver |
|---|---|---|
| USD 228.98 billion (2024) | Mordor Intelligence | |
| USD 206.85 billion (2022) | Global Consultancy A | excludes ad and enterprise mobility revenue |
| USD 240.94 billion (2024) | Trade Journal B | includes gross in-app commerce before commission |
These contrasts show that Mordor's disciplined scoping and mixed-method validation give decision-makers a dependable, repeatable baseline rooted in verifiable transaction streams.


Key Questions Answered in the Report
How big is the mobile application market today and how fast is it growing?
The mobile application market is valued at USD 391.3 billion in 2026 and is projected to expand to USD 864.5 billion by 2031 at a 17.18% CAGR during 2026-2031, reflecting one of the highest growth rates in consumer-facing digital segments.
How is generative AI changing the mobile application industry?
Generative-AI SDKs are enabling real-time personalisation, smarter content creation, and contextual upselling, which together lifted in-app consumer spend to USD 150 billion in 2024 and are expected to accelerate revenue diversification over the next two years.
What monetisation model is gaining the most momentum among publishers?
Subscription billing is the fastest-advancing monetisation model, rising at a 16.22% CAGR through 2031 as developers seek predictable recurring revenue and deploy AI-driven retention tactics to counter churn.
Why is HarmonyOS significant to mobile-application platform dynamics?
HarmonyOS has achieved 17% domestic share and is expanding at a 17.08% CAGR by offering cross-device compatibility and capitalising on policy support in China, thereby challenging the long-standing iOS-Android duopoly.
What are the main regulatory headwinds facing the mobile application market?
App-store commission caps, stricter privacy laws such as COPPA amendments, and antitrust cases compelling alternative billing are reshaping revenue splits and compliance costs, especially in the United States, European Union, and South Korea.
Page last updated on:


