Smart Learning Systems Market Size and Share
Market Overview
| Study Period | 2019 - 2030 |
|---|---|
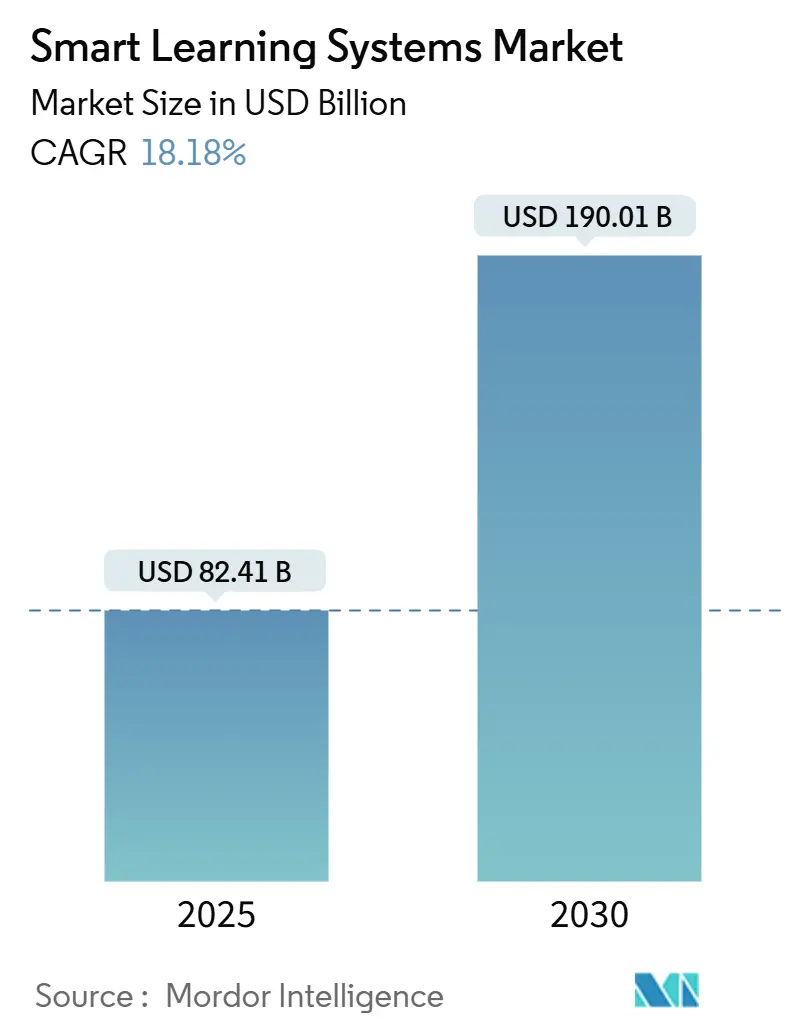
| Market Size (2025) | USD 82.41 Billion |
| Market Size (2030) | USD 190.01 Billion |
| Growth Rate (2025 - 2030) | 18.18% CAGR |
| Fastest Growing Market | Asia Pacific |
| Largest Market | North America |
| Market Concentration | Medium |
Major Players *Disclaimer: Major Players sorted in no particular order Image © Mordor Intelligence. Reuse requires attribution under CC BY 4.0. | |
Smart Learning Systems Market Analysis by Mordor Intelligence
The smart learning systems market size reached USD 82.41 billion in 2025 and is forecast to advance to USD 190.01 billion by 2030, expanding at an 18.18% CAGR. The acceleration reflects a structural pivot from classroom-centric instruction toward AI-curated, cloud-native platforms that personalize content, surface progress analytics, and shorten mastery cycles. Institutions are shifting capital away from large lecture halls and toward virtual classroom subscriptions, adaptive engines, and immersive simulations that scale without geographic limits. Corporate learning and development (L&D) teams are joining the migration, attracted by faster onboarding, measurable compliance tracking, and the possibility of a single skills taxonomy that feeds workforce-planning dashboards. Vendors that can combine low-latency delivery, multilingual interfaces, and modular APIs continue to gain market share among buyers, who now benchmark platforms against data-privacy certifications and accessibility compliance rather than solely on feature count.
Key Report Takeaways
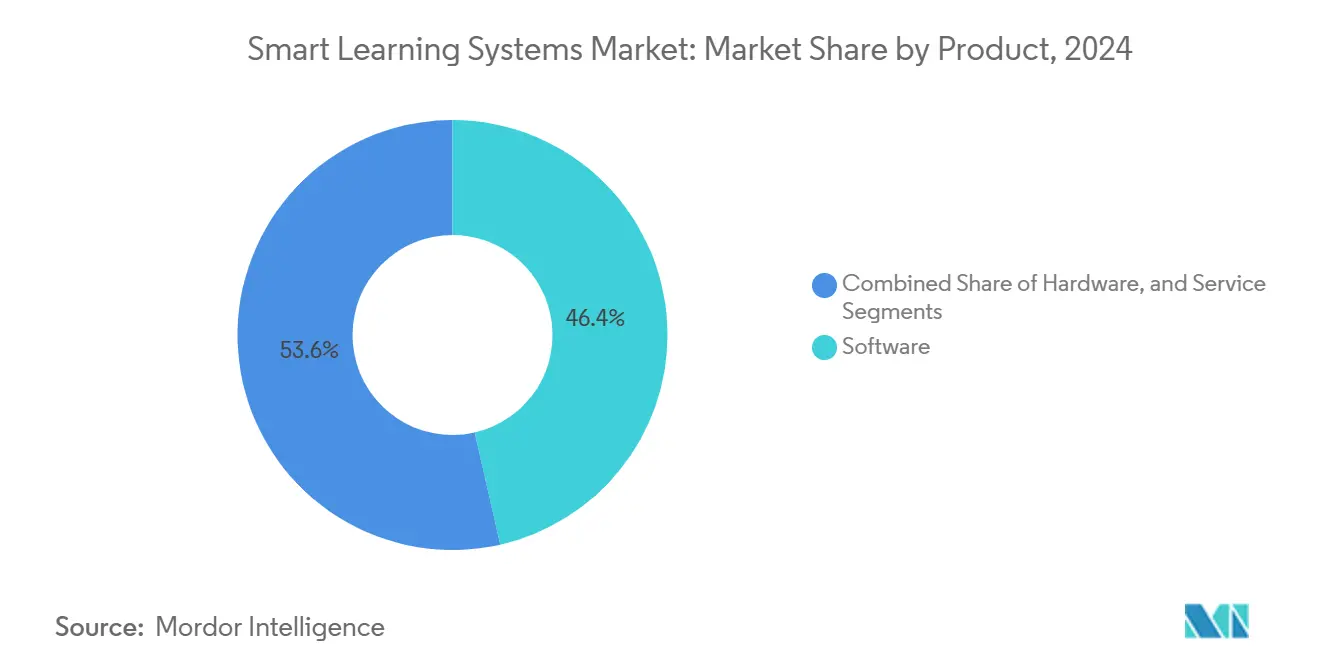
- By product category, software captured 46.44% of the smart learning systems market share in 2024 and is projected to grow at a 20.98% CAGR through 2030.
- By end user, academic institutions accounted for 70.12% of the revenue in 2024. However, the corporate segment is forecast to expand at a 19.67% CAGR through 2030.
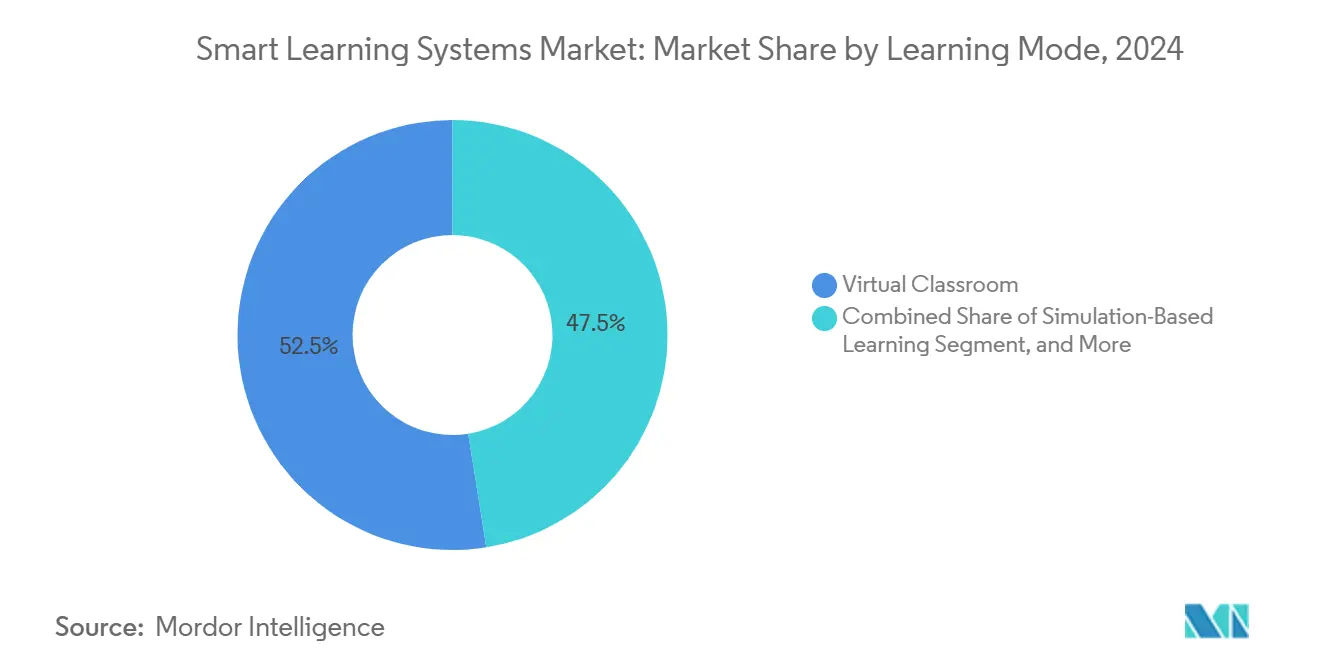
- By learning mode, virtual classrooms accounted for 52.45% of the smart learning systems market size in 2024. In contrast, simulation-based learning is advancing at a 21.78% CAGR through 2030.
- By deployment type, cloud solutions commanded 63.32% of revenue in 2024. However, cloud solutions are set to grow at a 19.98% CAGR through 2030.
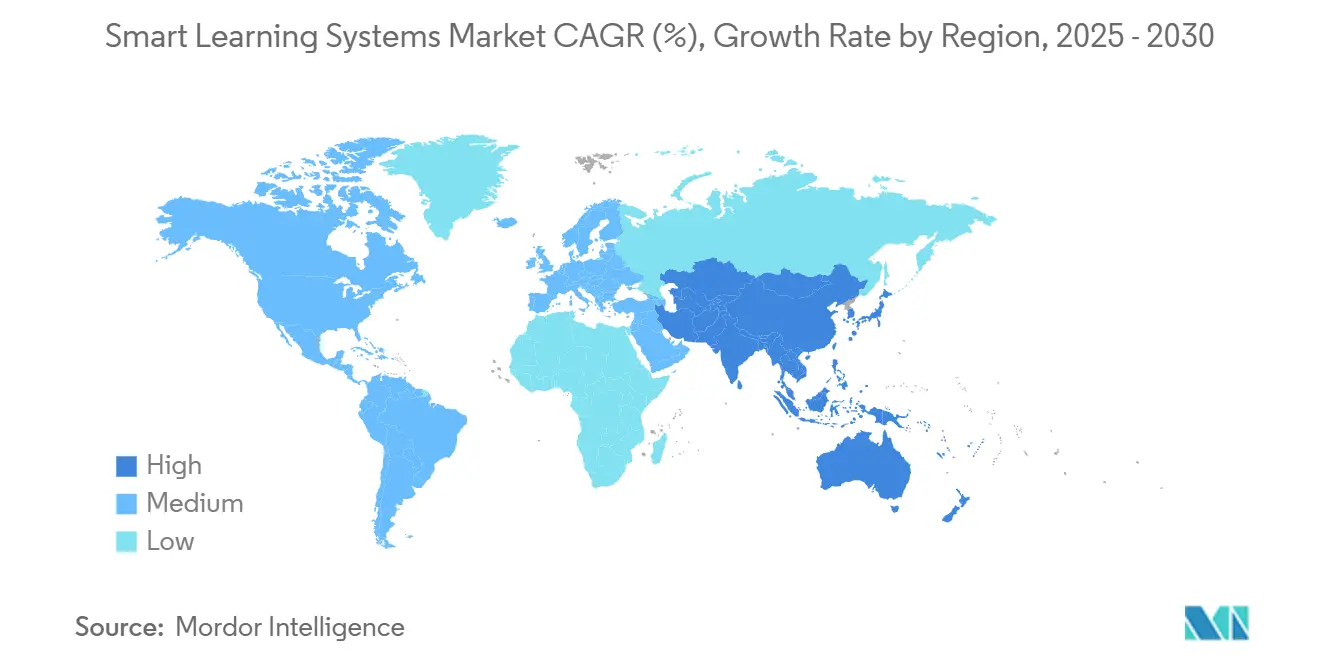
- By geography, North America generated 39.5% of the 2024 revenue, while the Asia-Pacific region is projected to record a 21.34% CAGR between 2025 and 2030.
Global Smart Learning Systems Market Trends and Insights
Drivers Impact Analysis*
| Driver | (~) % Impact on CAGR Forecast | Geographic Relevance | Impact Timeline |
|---|---|---|---|
| Growing Adoption of Digital Learning Solutions | +3.2% | Global, with acceleration in Asia-Pacific and North America | Medium term (2-4 years) |
| Expansion of Bring-Your-Own-Device Policies | +2.1% | North America, Europe, Australia and New Zealand | Short term (≤ 2 years) |
| Government Funding Boosting EdTech Infrastructure | +3.8% | Asia-Pacific core, spillover to Middle East and Africa | Long term (≥ 4 years) |
| AI-Powered Content Curation Enhancing Completion Rates | +2.9% | Global, early adoption in North America and Europe | Medium term (2-4 years) |
| ESG-Driven Capital Flow into Inclusive EdTech | +1.4% | North America and Europe, emerging in Latin America | Long term (≥ 4 years) |
| Low-Orbit Satellite Broadband Enabling Remote Learning | +2.3% | Sub-Saharan Africa, Latin America, rural Asia-Pacific | Medium term (2-4 years) |
| Source: Mordor Intelligence | |||
Growing Adoption of Digital Learning Solutions
Institutions worldwide are repositioning budgets toward scalable digital curricula that offset enrollment volatility and rising cost-per-student ratios. Universities that are trimming their physical infrastructure now deliver fully online degrees, which reduces overhead by up to half, channeling savings into adaptive engines that surface at-risk learners in real-time. K-12 districts utilize centralized course repositories to equalize access between urban and rural schools, while corporate L&D departments replace week-long seminars with microlearning modules that fit within work breaks, reducing travel and venue costs. The policy backdrop is especially favorable in the Asia-Pacific region, where India’s National Education Policy 2020 mandates the implementation of digital infrastructure in every school by 2030. [1]Ministry of Education India, “National Education Policy 2020 Digital Infrastructure Goals,” education.gov.in
Government Funding Boosting EdTech Infrastructure
Sovereign investment has become the single most predictable catalyst for the growth of smart learning systems markets. Germany’s proposed EUR 2.5 billion (USD 2.61 billion) Digital Pact extension would modernize interactive displays and expand teacher training. [2]Federal Ministry of Education and Research Germany, “Digital Pact Extension Proposal,” bmbf.de Japan’s GIGA School Programme allocated JPY 318 billion (USD 2.1 billion) for tablets and broadband, ensuring that every junior high school student receives a device. South Korea allocated KRW 225 billion (USD 167 million) to pilot AI textbook engines that adapt to individual mastery trajectories. Such multi-year line items provide vendors with clearer revenue visibility than discretionary campus purchases and reward platforms certified under local data-residency mandates.
AI-Powered Content Curation Enhancing Completion Rates
Adaptive systems that employ natural language processing and predictive analytics now personalize learning paths by interpreting quiz scores, time on task, and clickstream data. A meta-analysis of 42 randomized controlled trials reported a 23-percentage-point increase in course completion when adaptive feedback was used in place of static modules. [3]Journal of Educational Psychology, “Meta-Analysis of Adaptive Learning Outcomes,” apa.org Coursera, serving 168 million registered learners, applies similar algorithms to map employee skill gaps to catalog offerings, thereby accelerating workforce upskilling. Beyond corporate use, universities integrate AI graders that review open-response essays at scale, shrinking feedback cycles from weeks to minutes and freeing faculty for higher-value mentoring.
Low-Orbit Satellite Broadband Enabling Remote Learning
The arrival of mass-market low-Earth-orbit constellations is erasing last-mile bottlenecks that historically excluded rural regions from smart learning ecosystems. Kazakhstan lit up satellite terminals in 447 schools, delivering 100 Mbps symmetric connectivity, while Jamaica connected 150 rural campuses under a similar scheme. Australian island research stations now stream synchronous lectures, thanks to the same service, allowing marine biology students to remain near field sites. For Sub-Saharan districts lacking fiber or 4G, satellite becomes the fastest path to parity, enabling cloud-hosted adaptive assessments that were previously impossible.
Restraints Impact Analysis*
| Restraint | (~) % Impact on CAGR Forecast | Geographic Relevance | Impact Timeline |
|---|---|---|---|
| Poor Connectivity in Rural Districts | -2.1% | Sub-Saharan Africa, rural Asia-Pacific, Latin America | Medium term (2-4 years) |
| Limited Teacher Digital Competency | -1.6% | Global, acute in emerging markets | Short term (≤ 2 years) |
| Data-Privacy-Driven Procurement Delays | -1.3% | Europe, North America | Short term (≤ 2 years) |
| Rising E-Waste Compliance Costs for EdTech Hardware | -0.9% | Europe, select Asia-Pacific markets | Long term (≥ 4 years) |
| Source: Mordor Intelligence | |||
Poor Connectivity in Rural Districts
Across Sub-Saharan Africa, fewer than 30% of schools possess reliable bandwidth capable of streaming interactive content, a statistic mirrored in mountainous segments of Latin America, where fiber-optic deployment is cost-prohibitive. [4]UNESCO, “Global Education Monitoring Report Connectivity Statistics,” unesco.org Even in the United States, rural counties rely on dated DSL links that drop during peak usage, forcing teachers to revert to static PDFs. Until broadband costs decrease or satellite rollouts reach scale, the smart learning systems market will capture urban demand more readily than remote demand, thereby widening educational inequities that the technology aims to address.
Limited Teacher Digital Competency
A global skills audit revealed that two-thirds of K-12 educators have not received formal instruction in AI-assisted pedagogy, leaving them unsure how to interpret learning analytics dashboards or configure adaptive lesson paths. Budget allocations of under 2% for professional development often lead to underutilization of expensive platforms. Vendors supply tutorial videos and gamified onboarding, yet hands-on coaching remains irreplaceable. Bridging this competency gap is crucial to realizing the full instructional potential of smart learning systems.
*Our forecasts treat driver/restraint impacts as directional, not additive. The impact forecasts reflect baseline growth, mix effects, and variable interactions.
Segment Analysis
By Product: Software Led by AI-Enhanced Platforms
Software held a 46.44% share in 2024 and is forecast to grow at a 20.98% CAGR, outpacing hardware refresh cycles and service engagements. The smart learning systems market size for software subscriptions benefits from annual renewals that stack predictably year over year. Learning-management systems, adaptive tutoring apps, and analytics dashboards form the core of the purchase, while content-authoring suites enable faculty to build interactive modules without coding. Interactive display hardware, refreshed roughly every eight years, now serves mainly as an endpoint for cloud applications. Smartphones and tablets are increasingly acquired through bring-your-own-device policies, shifting procurement to families and reducing district capital expenditures. Managed services covering integration, data migration, and Tier 2 support expand in tandem because in-house IT teams rarely master identity federation, single sign-on, and data privacy mapping on their own. Generative AI add-ons from Microsoft Copilot and Google Gemini automate quiz creation and summary drafting, reinforcing the software moat while raising switching costs.
Institutional buyers evaluate software not only on its features but also on its compliance with standards such as ISO 27001, SOC 2 Type II, and WCAG 2.1 Level AA, especially after high-profile accessibility lawsuits compelled some districts to rebid contracts. Platforms now emphasize zero-trust architectures, regional data residency, and one-click anonymization to meet both GDPR and FERPA. The growing prevalence of micro-credentials drives demand for learner-record portability, nudging vendors toward blockchain-secured transcript layers. As a result, software budgets are rising even faster than the already brisk overall smart learning systems market.


By End User: Corporate Demand Closes the Gap
Academic institutions generated 70.12% of revenue in 2024, yet corporate uptake is advancing at an annual rate of 19.67%, narrowing the divide. Enterprises integrate learning engines with SAP SuccessFactors, Oracle HCM, and Workday, auto-enrolling employees in mandatory training and capturing completion logs for ISO 9001 audits. The smart learning systems market size linked to corporate compliance modules gains from these integrations, especially in regulated verticals such as healthcare, aviation, and financial services. Simulation-based learning resonates with manufacturers and logistics firms seeking safer forklift operation drills or warehouse navigation coaching. Walmart alone has trained over 1 million associates using VR modules that replicate peak-season scenarios without disrupting store operations.
Universities, meanwhile, deploy smart learning systems to accommodate enrollment growth without proportional faculty hires. Hybrid lecture models free auditorium space and allow part-time learners to stream asynchronously. Medical and engineering faculties pilot VR labs for laparoscopic surgery or 3D CAD inspection, bridging the hands-on requirement gap left by online lectures. The blurring of boundaries, corporations offering stackable credentials, and universities entering executive education; force vendors to architect modular platforms capable of serving both campuses and enterprise intranets from a shared code base.
By Learning Mode: Simulations Gain Share
Virtual classrooms dominated with a 52.45% share in 2024, a legacy of pandemic-era video deployments. However, simulation-based learning is advancing at a 21.78% CAGR, the fastest among modes. Simulation growth is driven by falling headset costs and the rising acceptance of experiential learning, which directly translates into improved job performance. The smart learning systems market size allocated to VR modules now covers healthcare residencies, aviation flight hours, and industrial safety drills. Adaptive learning, the third major mode, tailors pacing and difficulty, especially in K-12 math and language curricula. A meta-study estimated its effect size at g = 0.70, equivalent to moving a median student from the 50th percentile to the 76th percentile.
Social learning platforms, primarily Teams and Classroom, maintain high daily active usage by embedding peer discussion, group projects, and mentorship circles. They support campus communities even after in-person activity resumes, pointing toward a durable hybrid future. Over the forecast period, many institutions will combine synchronous classes with simulation labs to meet accreditation bodies' requirements for demonstrable practical skill acquisition.
By Deployment Type: Cloud Accelerates Under Compliance Clarity
Cloud deployments held 63.32% share in 2024 and are on course to post a 19.98% CAGR. SaaS models address pain points related to patching, scalability, and feature velocity; vendors release weekly updates that incorporate AI functionality without requiring reimaging of local servers. North American colleges cite streamlined total cost of ownership, while European buyers prioritize sovereignty, choosing vendors that host learner data in Frankfurt, Dublin, or Amsterdam clusters to remain inside GDPR borders. In China, the Cybersecurity Law prompts multinationals to partner with domestic cloud operators before accessing public school contracts.
On-premise solutions still command niche loyalty in defense, aerospace, and certain financial services settings where air-gapped compliance is non-negotiable. Hybrid architectures are now appearing more frequently, caching video locally to address bandwidth shortages while syncing assessment analytics to the cloud when connections permit. As low-Earth-orbit broadband expands coverage, even remote districts can contemplate cloud learning, further enlarging the addressable smart learning systems market.
Geography Analysis
North America accounted for 39.5% of 2024 revenue, supported by Title IV federal funding and the USD 4.46 billion E-Rate program that subsidizes K-12 connectivity. Large districts exploit these streams to underwrite LMS licenses and device refresh cycles, while corporate campuses leverage mature broadband infrastructure to roll out VR labs at scale. The Asia-Pacific region, advancing at 21.34% through 2030, is the fastest-growing region, thanks to sweeping national mandates. China’s National Smart Education Platform serves 1.05 billion users, integrating K-12, vocational, and adult learning content on a single portal. Japan’s GIGA School Programme invested JPY 318 billion (USD 2.1 billion) in universal one-to-one devices, pairing hardware with cloud content repositories to avoid prior underutilization pitfalls. South Korea’s KRW 225 billion (USD 167 million) AI textbook pilot covers 500 schools, with expansion contingent on measured improvements in student outcomes.
Europe advances more slowly under GDPR compliance overhead, which adds six to nine months to procurement. However, the EUR 99.3 billion (USD 106 billion) European Social Fund Plus earmarks substantial grants for education and skills, cushioning vendor pipelines. Germany’s prospective EUR 2.5 billion Digital Pact extension seeks both hardware upgrades and teacher training, a dual demand that favors integrated cloud-plus-services proposals. The United Kingdom is trialing AI tutoring across 100 schools as part of post-pandemic recovery metrics, with national rollout hinging on cost-per-student comparisons against human tutors.
Middle East and Africa hold the smallest share yet register high growth in Gulf Cooperation Council countries, where sovereign wealth funds deploy EdTech to diversify economies away from hydrocarbons. The United Arab Emirates standardized Microsoft Teams across public schools, guaranteeing platform uniformity that simplifies professional development. Sub-Saharan rollouts depend on low-orbit satellite or mobile-network upgrades to overcome chronic last-mile gaps. Latin America’s fiscal constraints slow large-scale procurements, but targeted pilots in Brazil, Chile, and Colombia showcase adaptive engines that bridge regional inequalities in teacher quality. Australia and New Zealand, already mature, focus on generative AI layers and accessibility compliance refreshes, producing steady but lower-velocity expansion.

Competitive Landscape
The smart learning systems market remains fragmented, with the top five providers collectively holding a roughly 28% share. Anthology’s merger with Blackboard consolidated LMS positions, yielding a user base exceeding 150 million, yet open-source rivals Moodle and Instructure’s Canvas continue to win tenders through plugin ecosystems that interoperate with legacy student-information systems. Microsoft Teams for Education and Google Classroom dominate social learning by capitalizing on existing productivity suite footprints, thereby lowering switching costs for faculty already versed in Office 365 or Workspace workflows. Specialist providers, such as Udemy Business and Coursera, target corporate upskilling and university partnership models, respectively, blending academic and professional credentialing in ways that traditional LMS vendors find harder to replicate.
Technology competition now centers on AI-driven personalization. Vendors race to integrate generative language models that automatically assemble quizzes, summarize lecture transcripts, and generate performance dashboards aligned with ISO 9001 audit trails. SAP and Oracle bundle learning modules within human-capital-management stacks, offering a seamless employee development record from hire to retirement. Cisco and Dell marry video conferencing with ruggedized Chromebook fleets, pitching holistic hardware-software packages to districts lacking deep IT skills. Security certifications; ISO 27001 and SOC 2 Type II are increasingly prerequisites in public tenders, pushing smaller suppliers to invest in costly third-party audits or partner with certified infrastructure providers.
Competitive differentiation is shifting from feature parity to ecosystem lock-in. Market leaders offer API gateways and app marketplaces that encourage third-party development, making it harder for institutions to switch after building custom integrations. This dynamic keeps market concentration moderate yet stable, as leading platforms continue to widen moats through developer incentives and regional data-center build-outs.
Smart Learning Systems Industry Leaders
Microsoft Corporation
Google LLC
Adobe Inc.
Cisco Systems Inc.
Dell Technologies Inc.
- *Disclaimer: Major Players sorted in no particular order

Recent Industry Developments
- October 2025: Google embedded Gemini 2.0 in Workspace for Education, enabling multimodal AI feedback on student video presentations and integrating seamlessly with Google Classroom.
- September 2025: India’s Ministry of Education allocated INR 12,000 crore (USD 1.44 billion) to extend digital infrastructure to 250,000 rural schools by 2027 under the National Education Policy 2020.
- August 2025: Coursera reported Q2 2025 revenue of USD 189.7 million, up 19% year over year, citing enterprise-level AI and cybersecurity upskilling contracts.
- July 2025: The European Commission launched the Digital Education Action Plan 2025-2027, assigning EUR 1.2 billion (USD 1.29 billion) to GDPR-compliant adaptive platforms and teacher digital-competency training.


Global Smart Learning Systems Market Report Scope
A smart learning system refers to an advanced educational platform that utilizes technology, such as artificial intelligence, machine learning, and data analytics, to deliver personalized and efficient learning experiences.
The Smart Learning Systems Market Report Segments the Market by Product (Hardware, Software, Service), End User (Academic, Corporate), Learning Mode (Adaptive Learning, Virtual Classroom, Simulation-Based Learning, Social Learning Platforms), Deployment Type (Cloud-Based, On-Premise), and Geography (North America, South America, Europe, Asia-Pacific, Middle East and Africa). The Market Forecasts are Provided in Terms of Value (USD).
| Hardware | Interactive Displays | |
| Student Response Systems | ||
| Mobile Devices | Smartphones | |
| Tablets | ||
| Software | ||
| Service | ||
| Academic |
| Corporate |
| Adaptive Learning |
| Virtual Classroom |
| Simulation-Based Learning |
| Social Learning Platforms |
| Cloud-Based |
| On-Premise |
| North America | United States | |
| Canada | ||
| Mexico | ||
| South America | Brazil | |
| Argentina | ||
| Chile | ||
| Rest of South America | ||
| Europe | United Kingdom | |
| Germany | ||
| France | ||
| Italy | ||
| Spain | ||
| Rest of Europe | ||
| Asia-Pacific | China | |
| Japan | ||
| India | ||
| South Korea | ||
| Australia and New Zealand | ||
| Rest of Asia-Pacific | ||
| Middle East and Africa | Middle East | United Arab Emirates |
| Saudi Arabia | ||
| Turkey | ||
| Rest of Middle East | ||
| Africa | South Africa | |
| Kenya | ||
| Nigeria | ||
| Rest of Africa | ||
| By Product | Hardware | Interactive Displays | |
| Student Response Systems | |||
| Mobile Devices | Smartphones | ||
| Tablets | |||
| Software | |||
| Service | |||
| By End User | Academic | ||
| Corporate | |||
| By Learning Mode | Adaptive Learning | ||
| Virtual Classroom | |||
| Simulation-Based Learning | |||
| Social Learning Platforms | |||
| By Deployment Type | Cloud-Based | ||
| On-Premise | |||
| By Geography | North America | United States | |
| Canada | |||
| Mexico | |||
| South America | Brazil | ||
| Argentina | |||
| Chile | |||
| Rest of South America | |||
| Europe | United Kingdom | ||
| Germany | |||
| France | |||
| Italy | |||
| Spain | |||
| Rest of Europe | |||
| Asia-Pacific | China | ||
| Japan | |||
| India | |||
| South Korea | |||
| Australia and New Zealand | |||
| Rest of Asia-Pacific | |||
| Middle East and Africa | Middle East | United Arab Emirates | |
| Saudi Arabia | |||
| Turkey | |||
| Rest of Middle East | |||
| Africa | South Africa | ||
| Kenya | |||
| Nigeria | |||
| Rest of Africa | |||


Key Questions Answered in the Report
How large is the smart learning systems market in 2025?
The market reached USD 82.41 billion in 2025 and is projected to grow briskly through 2030.
What is the expected CAGR for smart learning platforms between 2025 and 2030?
The market is forecast to expand at an 18.18% CAGR over the period.
Which product segment is growing fastest?
Software, including adaptive engines and analytics dashboards, is set to rise at a 20.98% CAGR through 2030.
Which region is projected to record the highest growth?
Asia-Pacific is expected to deliver the fastest regional expansion at a 21.34% CAGR.
Why are corporations adopting smart learning systems quickly?
Enterprises integrate platforms with HCM suites to automate compliance training, shorten onboarding, and track skills analytics, fueling a 19.67% CAGR in the corporate segment.
How are data-privacy rules influencing deployment choices?
Institutions in Europe and North America increasingly choose cloud providers offering regional data centers and ISO 27001 certifications to satisfy GDPR and FERPA requirements.
Page last updated on:


