Education Software Market Size and Share
Market Overview
| Study Period | 2020 - 2031 |
|---|---|
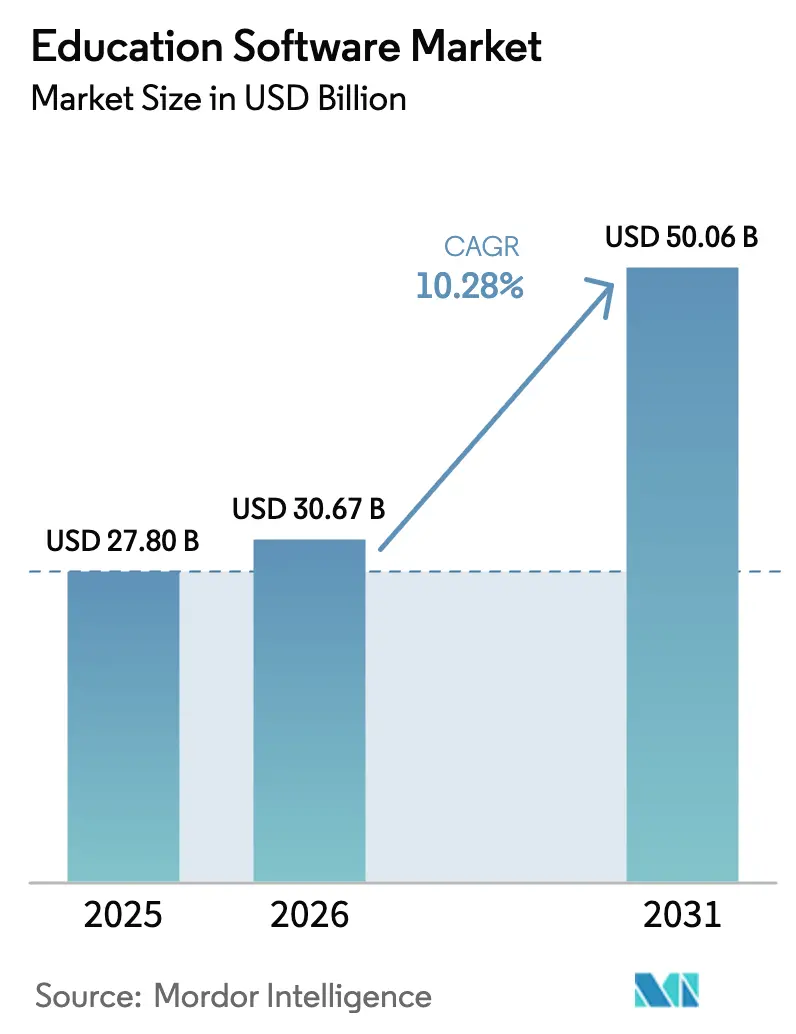
| Market Size (2026) | USD 30.67 Billion |
| Market Size (2031) | USD 50.06 Billion |
| Growth Rate (2026 - 2031) | 10.28% CAGR |
| Fastest Growing Market | Asia Pacific |
| Largest Market | North America |
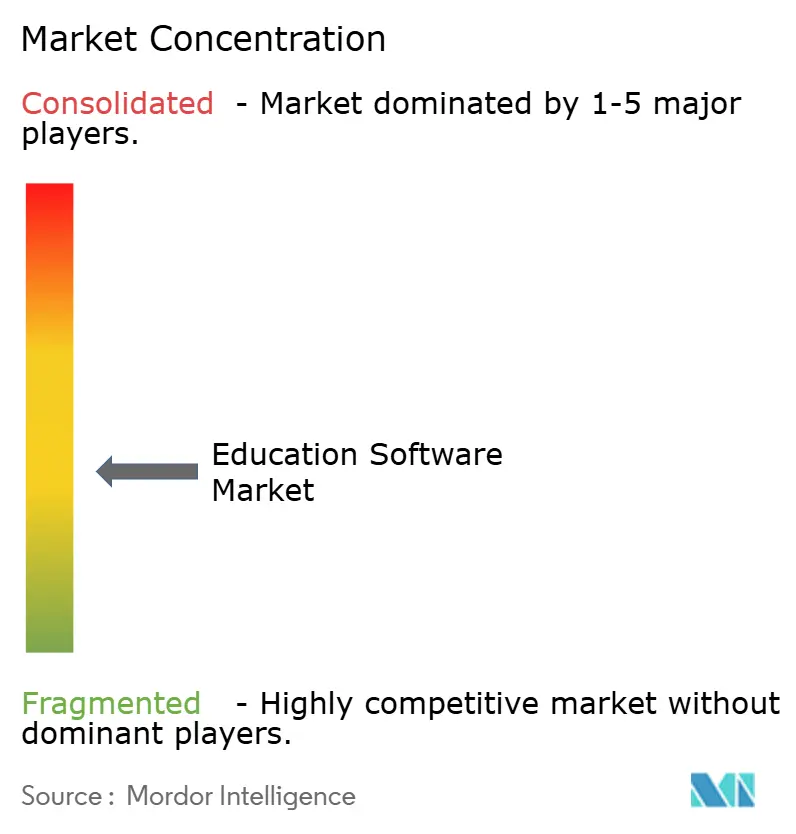
| Market Concentration | Medium |
Major Players*Disclaimer: Major Players sorted in no particular order Image © Mordor Intelligence. Reuse requires attribution under CC BY 4.0. | |
Education Software Market Analysis by Mordor Intelligence
The education software market size in 2026 is estimated at USD 30.67 billion, growing from 2025 value of USD 27.8 billion with 2031 projections showing USD 50.06 billion, growing at 10.28% CAGR over 2026-2031. Growth is fuelled by widespread digital-first learning mandates, rapid uptake of AI-driven adaptive engines, and the budget flexibility of cloud deployment models. Mature 1-to-1 device programs have created a global hardware foundation that amplifies software demand, while corporate reskilling pressures are pushing enterprises toward advanced learning management ecosystems. North America continues to optimise entrenched platforms, whereas Asia-Pacific posts double-digit expansion on the back of public investment in AI curricula and expanding broadband reach. Competitive intensity remains moderate: high switching costs protect incumbents, yet AI-native challengers are winning share where personalisation is a decisive purchase criterion. [1]Duolingo Inc., “Shareholder Letter Q4 2024,” duolingo.com
Key Report Takeaways
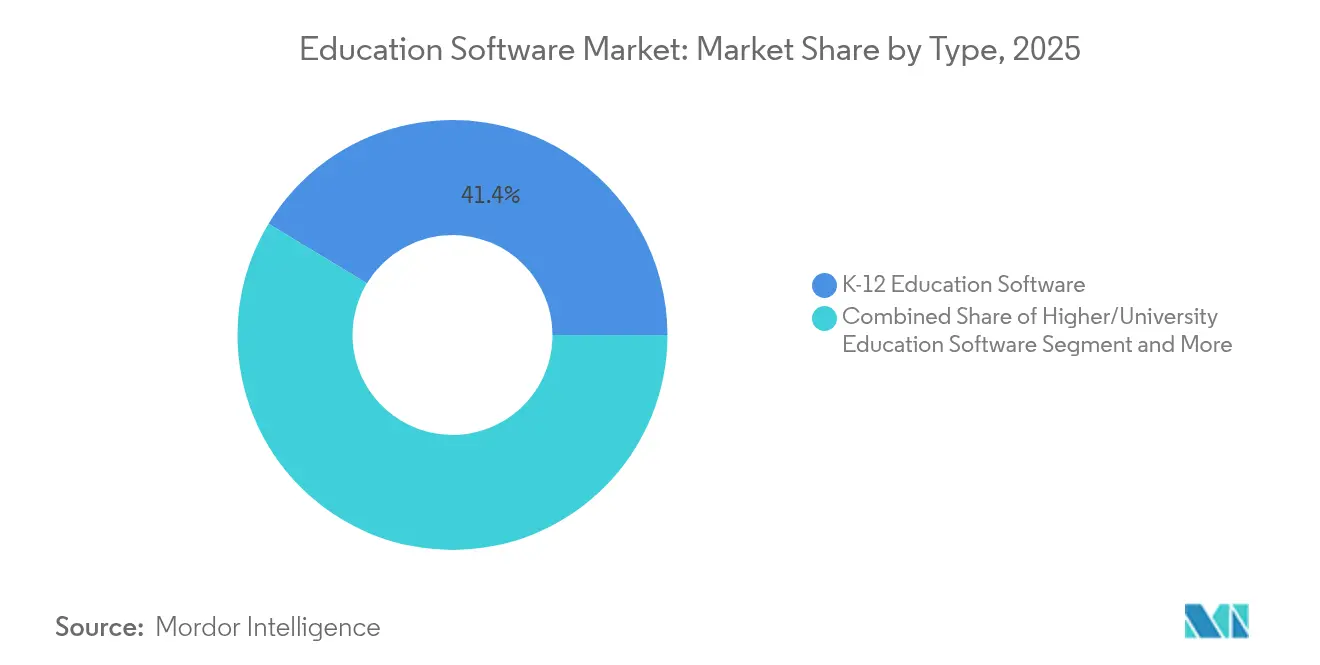
- By type, K-12 solutions led with 41.35% of education software market share in 2025; lifelong/adult learning is forecast to expand at a 14.25% CAGR through 2031.
- By deployment model, the cloud segment commanded 77.25% share of the education software market size in 2025 and is projected to grow at 15.42% CAGR to 2031.
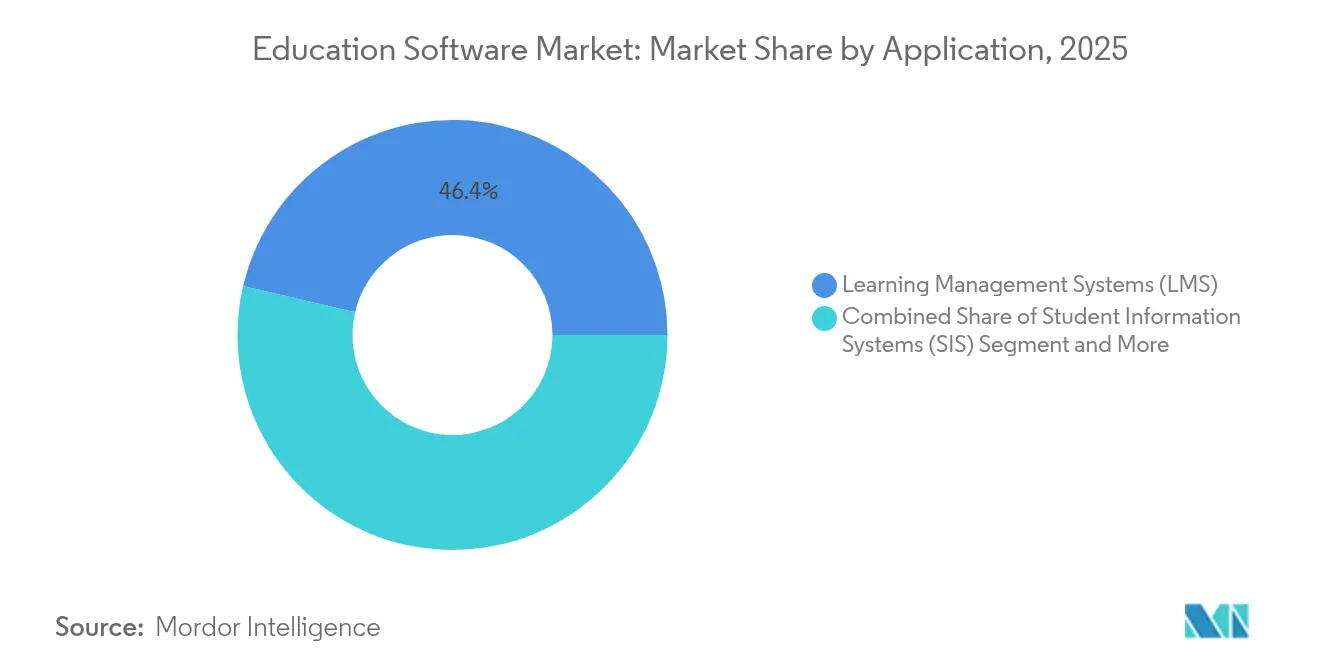
- By application, learning management systems held 46.35% revenue share in 2025, while AI-driven tutoring platforms are advancing at a 21.15% CAGR through 2031.
- By end-user, academic institutions accounted for 55.10% of the education software market size in 2025; corporates record the highest projected CAGR at 12.55% to 2031.
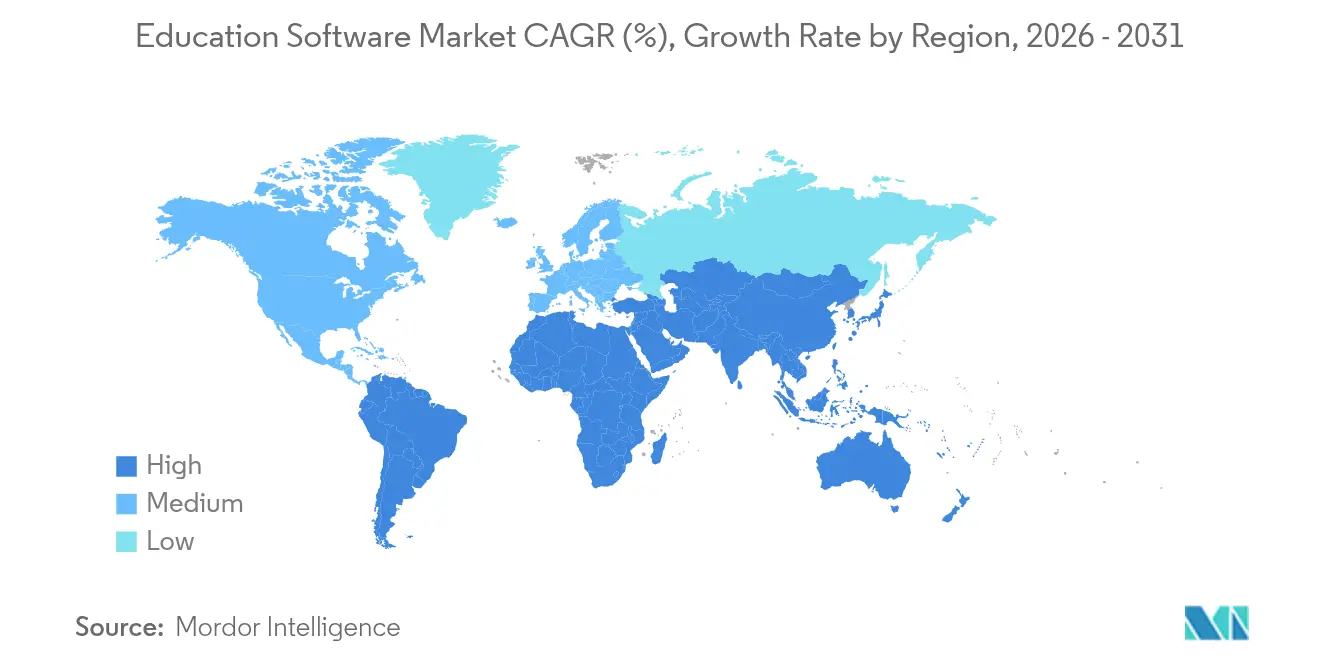
- By geography, North America led with 33.40% share in 2025; Asia-Pacific is the fastest-growing region at 13.12% CAGR through 2031.
Note: Market size and forecast figures in this report are generated using Mordor Intelligence’s proprietary estimation framework, updated with the latest available data and insights as of 2026.
Global Education Software Market Trends and Insights
Drivers Impact Analysis*
| Driver | (~) % Impact on CAGR Forecast | Geographic Relevance | Impact Timeline |
|---|---|---|---|
| Accelerating 1-to-1 device programs | 2.10% | Global, with concentration in North America & APAC | Medium term (2-4 years) |
| Surge in AI-powered adaptive learning engines | 3.20% | Global, led by North America & China | Short term (≤ 2 years) |
| Public-cloud cost efficiencies for LMS deployments | 1.80% | Global, particularly emerging markets | Long term (≥ 4 years) |
| Post-COVID hybrid-learning permanence | 1.40% | Global, strongest in developed markets | Medium term (2-4 years) |
| Corporate up-/re-skilling mandates | 2.70% | Global, concentrated in North America & EU | Short term (≤ 2 years) |
| Low-latency 5G enabling AR/VR micro-learning | 1.20% | APAC core, spill-over to North America | Long term (≥ 4 years) |
| Source: Mordor Intelligence | |||
Surge in AI-Powered Adaptive Learning Engines
AI-driven platforms now personalise pathways in real time by analysing individual performance signals and behavioural data. Large language models generate contextual explanations and instant assessments, cutting content-creation costs while keeping materials current. Duolingo’s conversational AI features have contributed to a 51% daily user jump and record revenue, illustrating how dynamic feedback loops boost engagement. Institutions adopt similar engines to improve completion rates and retention, reinforcing demand for scalable AI infrastructures. [2]Portland Public Schools, “Chromebook 1:1 Initiative Grades 3–12,” pps.net
Accelerating 1-to-1 Device Programs
More than 90% of schools in major economies operate 1-to-1 initiatives that pair each learner with a dedicated device, raising the baseline need for device management, content distribution, and analytics software. Incident IQ reports sustained service-ticket growth across its K-12 clients, underscoring permanent shifts in classroom operations. Funding lapses spotlight sustainability risks—Wake County, North Carolina recently terminated its Chromebook lease—yet districts such as Portland Public Schools still added 3-12 grade coverage, signalling long-term commitment to digital ecosystems.
Public-Cloud Cost Efficiencies for LMS Deployments
Clouds migration trims hardware expense, automates updates, and delivers elastic scaling. Teachfloor places the corporate learning cloud growth rate at 30% annually, with 87% of enterprises already transitioned. Rural colleges and emerging-market universities now access enterprise-grade analytics without heavy capital outlays, widening the total addressable education software market.
Corporate Up-/Re-Skilling Mandates
Enterprises pour resources into continuous learning to counter technology churn. Accenture alone allocates USD 1 billion each year to workforce upskilling while reporting a double-digit decline in per-employee training cost through digital platforms. AI-enabled systems measure skill acquisition, link training to performance metrics, and integrate with HR suites, cementing the education software market as a strategic pillar of talent management.
Restraints Impact Analysis*
| Restraint | (~) % Impact on CAGR Forecast | Geographic Relevance | Impact Timeline |
|---|---|---|---|
| Budget claw-backs after pandemic stimulus | -1.90% | Global, concentrated in public sector | Short term (≤ 2 years) |
| Student-data privacy & surveillance concerns | -1.20% | Global, strongest in EU & North America | Medium term (2-4 years) |
| Content copyright & licensing frictions | -0.80% | Global, particularly developed markets | Long term (≥ 4 years) |
| Teacher digital-skill gaps | -1.50% | Global, most acute in emerging markets | Medium term (2-4 years) |
| Source: Mordor Intelligence | |||
Student-Data Privacy and Surveillance Concerns
Regulatory tightening raises compliance overhead. Redactable’s audit of 1,400 education apps found 96% transmit learner data to external parties, sharpening scrutiny from parents and authorities. Vendors now embed granular consent tools and encryption layers, which can slow rollouts and elevate costs, particularly for smaller developers.
Teacher Digital-Skill Gaps
Many educators still lack confidence in advanced ed-tech functions. Peer-reviewed studies in Education and Information Technologies confirm that low-competency teachers improve only with tailored, ongoing support programs. Limited professional-development budgets therefore inhibit full platform utilisation, damping the achievable education software market growth in under-resourced districts.
*Our forecasts treat driver/restraint impacts as directional, not additive. The impact forecasts reflect baseline growth, mix effects, and variable interactions.
Segment Analysis
By Type: K-12 Dominance Drives Market Foundation
K-12 solutions contributed 41.35% to overall 2025 revenue, making them the cornerstone of platform design and feature roadmaps. Administrators value standardised assessment modules and parent-communication portals that simplify compliance tracking. Cross-pollination is growing universities are adopting K-12-style dashboards, while corporate academies borrow gamification elements honed in primary classrooms. Lifelong/adult learning is the fastest-expanding category, growing 14.25% annually as professionals seek flexible micro-credentials that fit work schedules. Providers therefore bundle modular content libraries with AI tutors that adapt to adult pacing, reinforcing the broad appeal of the education software market.
Platform developers tailor interfaces for multi-age cohorts without fragmenting the underlying code base, improving economies of scale. China’s nationwide AI-literacy mandate for primary schools from September 2025 will further enlarge the K-12 user pool. Similar policies are expected to spill into neighbouring markets, accelerating adoption and influencing product localisation roadmaps.


By Deployment Model: Cloud Infrastructure Enables Scale
Cloud deployments captured 77.25% of 2025 revenue and are forecast to rise 15.42% yearly, underscoring a decisive pivot away from on-premises data centres. Institutions welcome subscription pricing that aligns cost with enrolment volatility and eliminates hardware life-cycle headaches. The cloud therefore secures a durable economic foundation underpinning the education software market size.
On-premises solutions persist where data-sovereignty laws or intermittent connectivity prevail, but hybrid stacks are gaining traction. Vendors now offer containerised micro-services that let schools keep sensitive records in local servers while streaming AI analytics from public clouds. This dual approach reassures risk-averse boards without sacrificing innovation velocity, broadening market reach.
By Application: AI-Driven Tutoring Transforms Learning
Learning management systems retained 46.35% share last year and remain the backbone for syllabus delivery and attendance capture. Yet AI-driven tutoring platforms are scaling fastest at 21.15% CAGR, shifting the centre of gravity from administrative control to learner outcomes. Sophisticated engines parse student behaviour and generate bespoke exercises, creating engagement loops that increase time-on-task and completion metrics.
Assessment suites and content authoring tools increasingly embed generative AI prompts, cutting development cycles and enabling just-in-time material updates. Student information systems feed predictive models that flag at-risk learners early. This convergent architecture blurs traditional product lines, encouraging vendors to pitch unified suites that can upsell complementary modules across the education software market.
By End-user: Academic Institutions Lead, Corporates Accelerate
Academic institutions accounted for 55.10% of global spend in 2025, relying on integrated stacks to manage curriculum, accreditation, and student lifecycle data. Contract lengths average five years, locking in recurring revenue streams. Corporate programmes however deliver the fastest momentum at 12.55% CAGR as organisations embed continuous learning into workforce planning. Shared demand for credential portability and advanced analytics creates overlap: campuses now issue micro-badges compatible with LinkedIn profiles, while companies deploy university-style content libraries to foster deep skill tracks.
Government and non-profit bodies adopt lighter licences focused on compliance and accessibility. Vendors pursuing this segment prioritise multilingual interfaces, offline synchronisation, and discounted pricing tiers, ensuring broad penetration while maintaining product parity with enterprise editions.
Geography Analysis
North America generated 33.40% of 2025 revenue, anchored by early 1-to-1 device saturation and well-funded districts. Cloud adoption rates exceed 90%, enabling rapid roll-outs of AI upgrades. Vendors capitalise on robust privacy frameworks such as FERPA, which clarify procurement criteria and shorten sales cycles.
Asia-Pacific is registering the steepest climb at 13.12% CAGR as governments back AI literacy and rural connectivity. China’s directive mandating eight hours of AI instruction yearly, coupled with South Korea’s USD 70 million AI school network project, underscores public-sector momentum. Domestic champions localise interfaces and integrate regional content, while global providers partner for distribution, reinforcing the region’s outsized contribution to overall education software market growth.
Europe advances steadily, balancing innovation with stringent GDPR compliance that shapes data-handling architectures. Latin America and the Middle East & Africa remain opportunity frontiers marked by patchy broadband and budget variability. Suppliers adopt mobile-first design and freemium pricing to seed adoption, laying the groundwork for future conversion once infrastructure matures.

Competitive Landscape
The education software industry shows moderate concentration. Market leaders Instructure, PowerSchool, and D2L surround their learning cores with analytics, assessment, and credentialing add-ons, deepening lock-in. Switching involves data migration, staff retraining, and workflow re-engineering, raising exit barriers and sustaining pricing power.
AI-native entrants target niche pain points such as adaptive feedback loops and voice-enabled tutoring. Their lightweight architectures integrate via open APIs, reducing deployment friction. Incumbents respond through acquisition: IXL moved for MyTutor to bolster personalised tutoring and extend its UK footprint, while Amira Learning merged with Istation to assemble a 15% slice of the K-12 reading tools segment.
Investment trends emphasise content-plus-analytics bundles. Capital allocators reward vendors that demonstrate outcome metrics—completion rates, assessment uplift—rather than simple seat counts. Partnerships with hyperscale clouds further compress time-to-market for AI features, ensuring that the education software market remains dynamic despite established moats. [4]IXL Learning Inc., “IXL to Acquire MyTutor Press Release,” ixl.com
Education Software Industry Leaders
Instructure Inc.
Anthology Inc.
PowerSchool Holdings Inc.
D2L Corporation
Cornerstone OnDemand Inc.
- *Disclaimer: Major Players sorted in no particular order

Recent Industry Developments
- May 2025: IXL Learning acquired UK-based MyTutor to expand personalized tutoring services
- May 2025: Echo360 purchased GoReact to enhance real-time video feedback and skills assessment.
- April 2025: D2L reported Q4 revenue of USD 53.3 million, up 12%, citing AI feature uptake.
- January 2025: Amira Learning acquired Istation, creating a combined 15% share in AI-powered literacy tools.


Global Education Software Market Report Scope
Educational software is a term used for any computer software that is made for an educational purpose. It encompasses different ranges from language learning software to classroom management software to reference software.
The education software market is segmented by type (K-12 educational software, university education software, adult education software, elderly education software), by deployment (cloud, on-premises), by end-user (academics institutes, corporates, individuals, other end-users), by geography (North America, Europe, Asia-Pacific, Latin America, Middle East and Africa). The market sizes and forecasts are provided in terms of value (USD) for all the above segments.
| Synchronous Instructor-Led Live Online |
| Asynchronous Self-Paced eLearning |
| Blended / Hybrid |
| Microlearning and Nano-Learning Modules |
| K-12 Education Software |
| Higher/University Education Software |
| Corporate Training and Workforce Development Software |
| Lifelong and Adult Learning Software |
| Special Needs and Accessibility Software |
| Language Learning Software |
| Public SaaS (Multi-Tenant Cloud) |
| Private and Community Cloud |
| Hybrid Cloud |
| On-Premises |
| Mobile-First / App-Only |
| Learning Management Systems (LMS) |
| Student Information Systems (SIS) |
| Learning Analytics and Business Intelligence |
| Assessment, Testing and Proctoring |
| Content Authoring and Digital Courseware |
| Classroom Management and Collaboration Tools |
| AR/VR and Immersive Learning Platforms |
| Compliance and Certification Management |
| Academic Institutions | K-12 Schools and Districts |
| Higher Education Institutions | |
| Corporates | Large Enterprises |
| Small and Medium Enterprises (SME) | |
| Government and Non-Profit Organizations | |
| Individuals and Direct Consumers | Students and Lifelong Learners |
| Tutors and Independent Instructors |
| North America | United States | |
| Canada | ||
| Mexico | ||
| South America | Brazil | |
| Argentina | ||
| Chile | ||
| Rest of South America | ||
| Europe | Germany | |
| United Kingdom | ||
| France | ||
| Italy | ||
| Spain | ||
| Russia | ||
| Rest of Europe | ||
| Asia-Pacific | China | |
| Japan | ||
| India | ||
| South Korea | ||
| Australia | ||
| ASEAN-5 | ||
| Rest of Asia-Pacific | ||
| Middle East and Africa | Middle East | GCC Countries |
| Turkey | ||
| Israel | ||
| Rest of Middle East | ||
| Africa | South Africa | |
| Nigeria | ||
| Egypt | ||
| Rest of Africa | ||
| By Learning Mode | Synchronous Instructor-Led Live Online | ||
| Asynchronous Self-Paced eLearning | |||
| Blended / Hybrid | |||
| Microlearning and Nano-Learning Modules | |||
| By Type | K-12 Education Software | ||
| Higher/University Education Software | |||
| Corporate Training and Workforce Development Software | |||
| Lifelong and Adult Learning Software | |||
| Special Needs and Accessibility Software | |||
| Language Learning Software | |||
| By Deployment Model | Public SaaS (Multi-Tenant Cloud) | ||
| Private and Community Cloud | |||
| Hybrid Cloud | |||
| On-Premises | |||
| Mobile-First / App-Only | |||
| By Application / Function | Learning Management Systems (LMS) | ||
| Student Information Systems (SIS) | |||
| Learning Analytics and Business Intelligence | |||
| Assessment, Testing and Proctoring | |||
| Content Authoring and Digital Courseware | |||
| Classroom Management and Collaboration Tools | |||
| AR/VR and Immersive Learning Platforms | |||
| Compliance and Certification Management | |||
| By End-user | Academic Institutions | K-12 Schools and Districts | |
| Higher Education Institutions | |||
| Corporates | Large Enterprises | ||
| Small and Medium Enterprises (SME) | |||
| Government and Non-Profit Organizations | |||
| Individuals and Direct Consumers | Students and Lifelong Learners | ||
| Tutors and Independent Instructors | |||
| By Geography | North America | United States | |
| Canada | |||
| Mexico | |||
| South America | Brazil | ||
| Argentina | |||
| Chile | |||
| Rest of South America | |||
| Europe | Germany | ||
| United Kingdom | |||
| France | |||
| Italy | |||
| Spain | |||
| Russia | |||
| Rest of Europe | |||
| Asia-Pacific | China | ||
| Japan | |||
| India | |||
| South Korea | |||
| Australia | |||
| ASEAN-5 | |||
| Rest of Asia-Pacific | |||
| Middle East and Africa | Middle East | GCC Countries | |
| Turkey | |||
| Israel | |||
| Rest of Middle East | |||
| Africa | South Africa | ||
| Nigeria | |||
| Egypt | |||
| Rest of Africa | |||


Key Questions Answered in the Report
What is the current size of the education software market and how fast is it growing?
The education software market stands at USD 30.67 billion in 2026 and is projected to reach USD 50.06 billion by 2031, implying a 10.28% CAGR.
Which segment holds the largest share of spending?
K-12 solutions lead with 41.35% of 2025 revenue, making them the cornerstone of platform design and procurement.
Which region is expanding the fastest?
Asia-Pacific is the fastest-growing geography, advancing at a 13.12% CAGR through 2031 as governments fund AI curricula and broadband rollout.
Why are cloud deployments dominant in this industry?
Cloud models already account for 77.25% of 2025 revenue because they cut hardware costs, automate updates, and let institutions scale capacity on demand.
How quickly are AI-driven tutoring platforms growing?
AI-driven tutoring is the fastest-rising application, posting a 21.15% CAGR to 2031 on the strength of real-time personalisation and learning analytics.
What are the main compliance risks for buyers to watch?
Tightening student-data privacy rules and evolving copyright obligations can raise implementation costs and lengthen procurement cycles, especially in North America and the EU. . . . . . . . New Research
Page last updated on:


