Connected Drug Delivery Devices Market Size and Share
Market Overview
| Study Period | 2020 - 2031 |
|---|---|
| Market Size (2026) | USD 2.13 Billion |
| Market Size (2031) | USD 4.37 Billion |
| Growth Rate (2026 - 2031) | 15.43% CAGR |
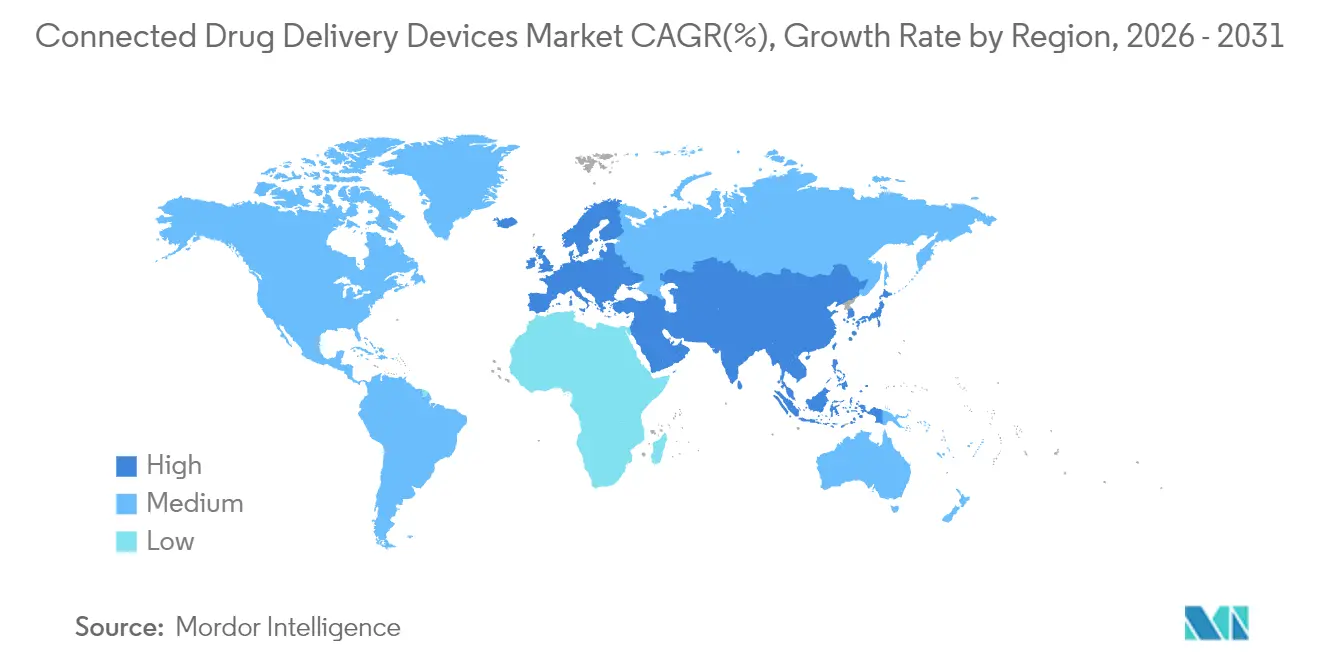
| Fastest Growing Market | Asia Pacific |
| Largest Market | North America |
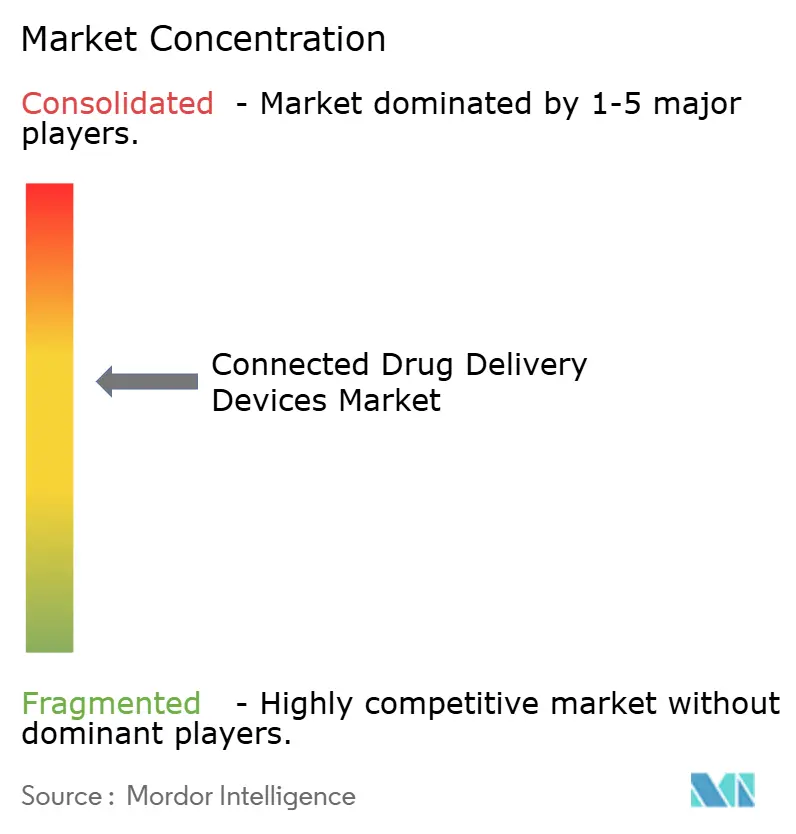
| Market Concentration | Medium |
Major Players *Disclaimer: Major Players sorted in no particular order Image © Mordor Intelligence. Reuse requires attribution under CC BY 4.0. | |
Connected Drug Delivery Devices Market Analysis by Mordor Intelligence
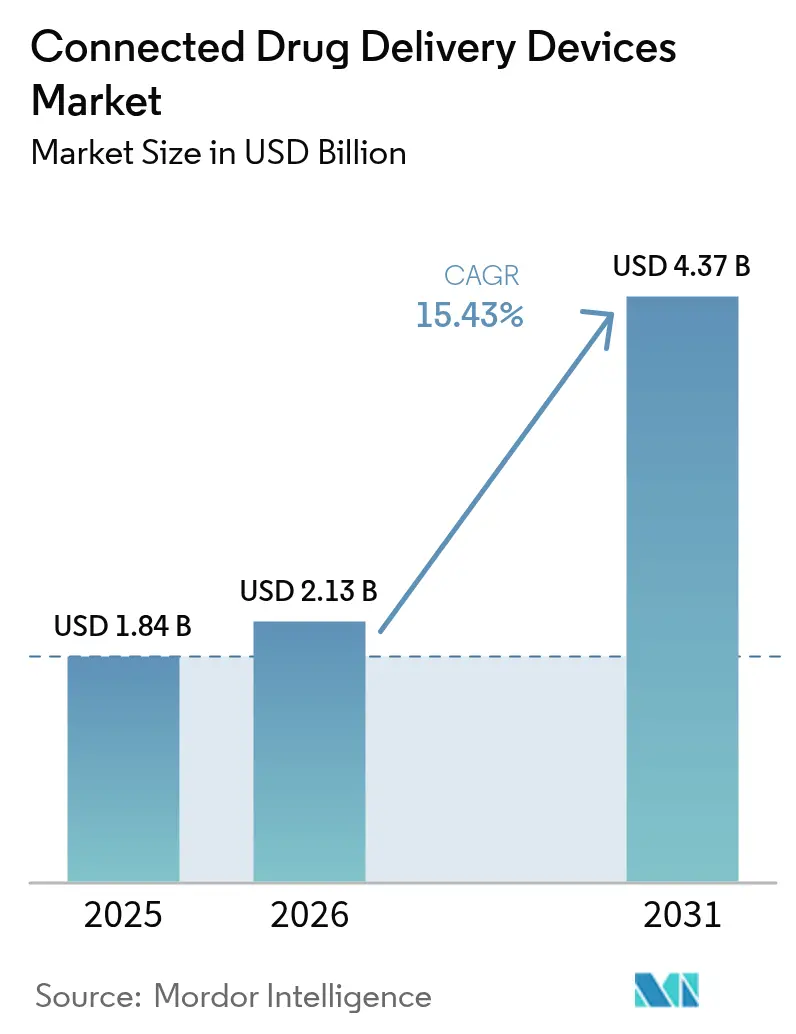
The Connected Drug Delivery Devices Market size is projected to be USD 1.84 billion in 2025, USD 2.13 billion in 2026, and reach USD 4.37 billion by 2031, growing at a CAGR of 15.43% from 2026 to 2031.
The acceleration reflects falling Bluetooth Low Energy component prices, payer moves toward value-based reimbursement, and regulatory fast-track pathways that shorten launch cycles. Component deflation erased the premium once attached to connectivity, allowing device makers to embed radios without breaching bill-of-materials ceilings that payers accept for chronic-care drugs. Parallel advances in graphene biosensors, battery-free NFC tags, and hybrid cellular modules enable smaller, longer-lasting hardware that pairs seamlessly with telehealth workflows. Payers reinforce uptake by tying reimbursement for asthma, COPD, and diabetes therapies to verified adherence data, making connected delivery a prerequisite for premium drug positioning. On the supply side, the FDA cleared 37 software-as-a-medical-device and drug combination products in 2025, up from 19 in 2024, sending a clear signal that regulators will keep pace with digital innovation.
Key Report Takeaways
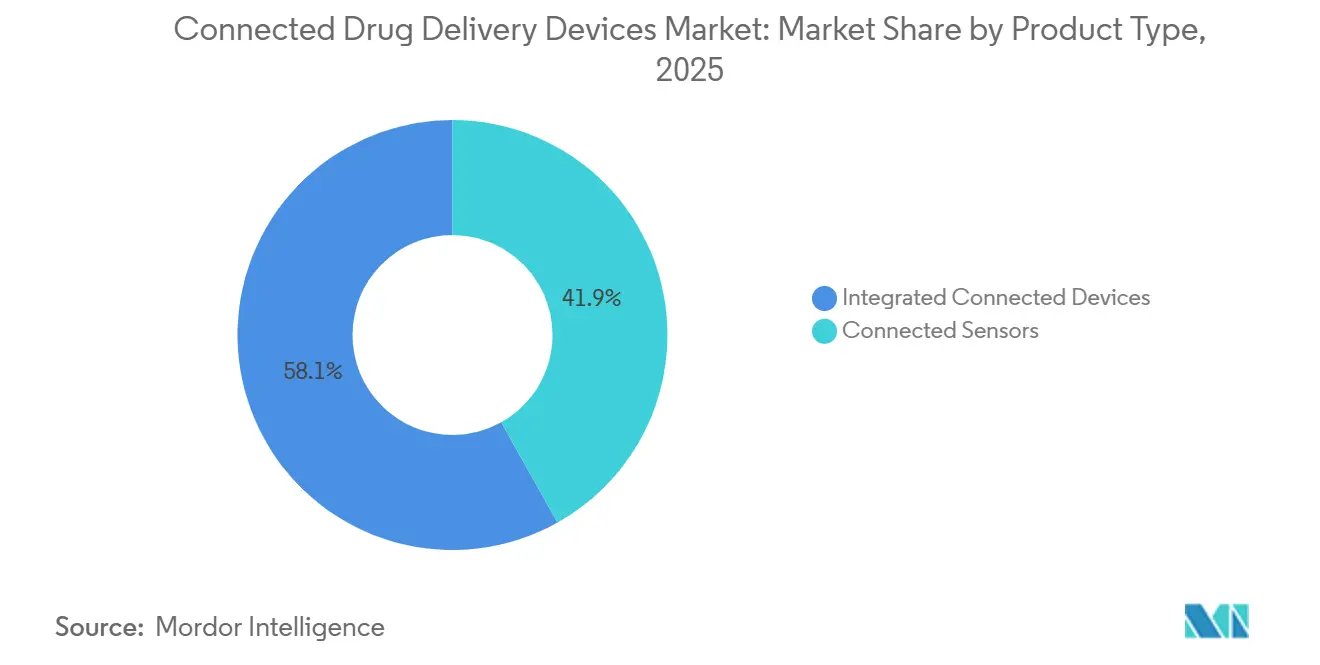
- By product type, integrated connected devices led with 58.12% of the connected drug delivery devices market share in 2025, while connected sensors are advancing at a 17.96% CAGR through 2031.
- By device type, prefilled syringes accounted for 38.05% of the connected drug delivery devices market in 2025, and wearable injectors are projected to expand at an 18.48% CAGR through 2031.
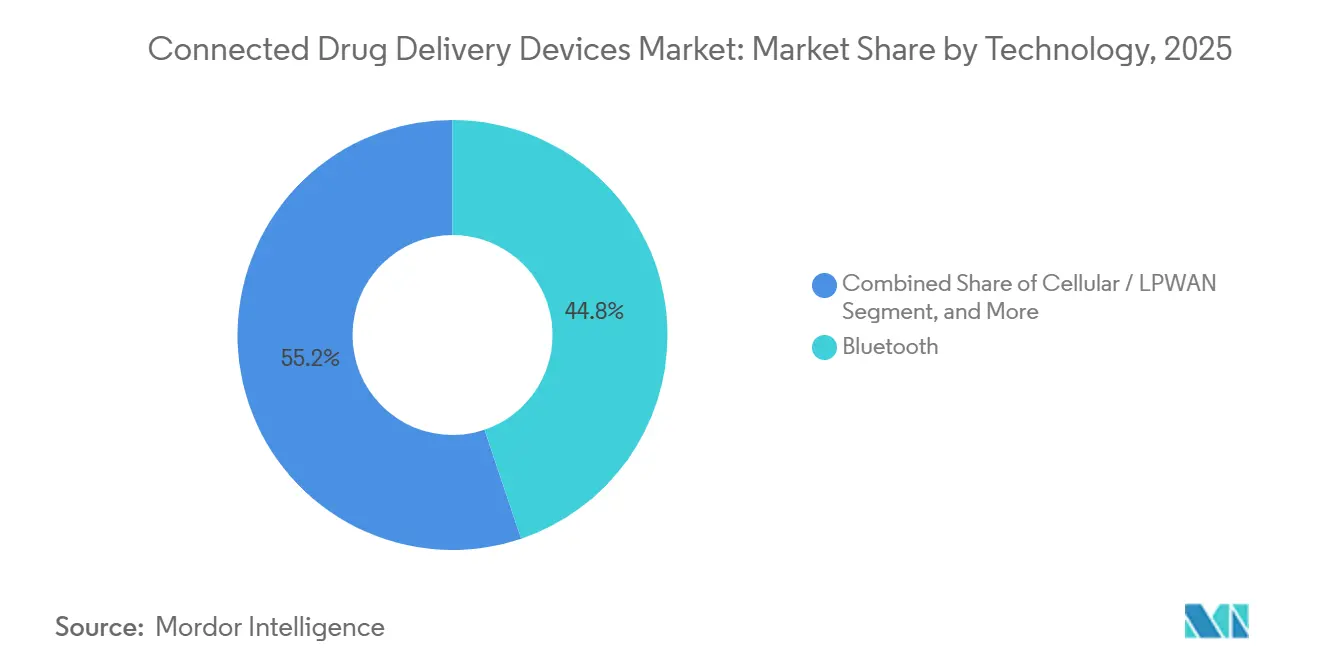
- By technology, Bluetooth retained a 44.82% share in 2025, whereas cellular / LPWAN modules are growing at a 20.66% CAGR through 2031.
- By route of administration, injectable products captured a 59.08% share in 2025, and inhalational devices are rising at a 15.41% CAGR through 2031.
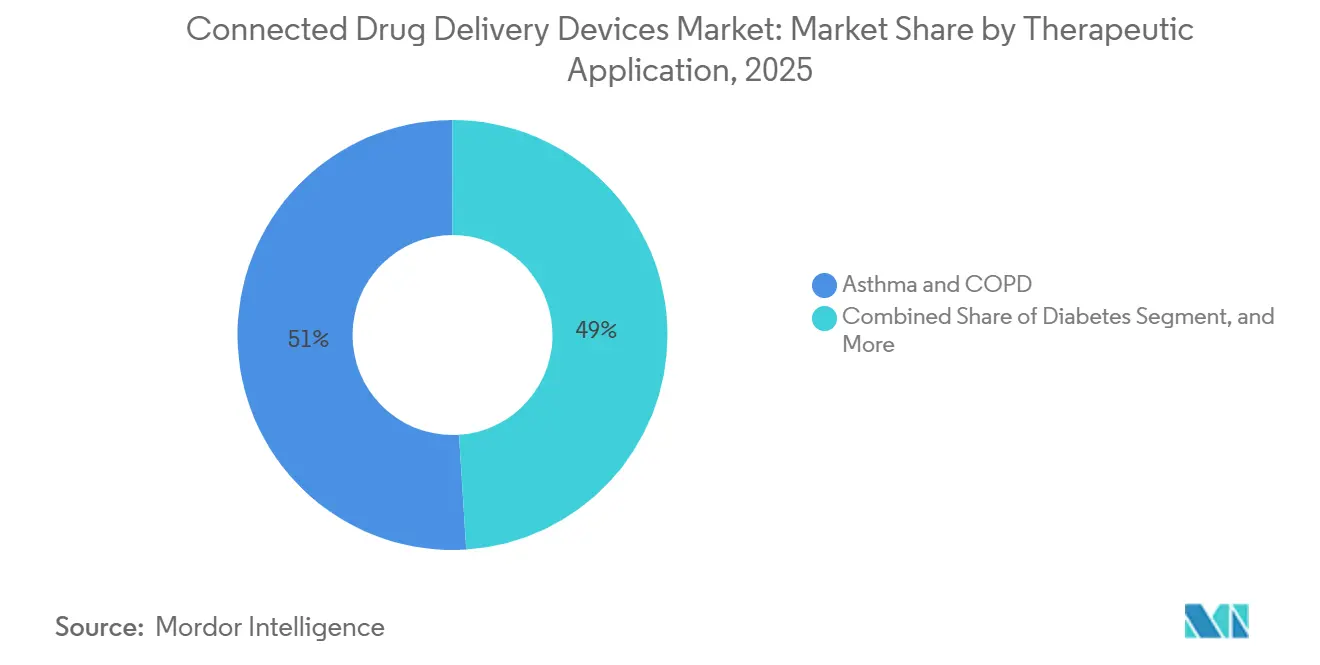
- By therapeutic application, asthma & COPD accounted for 51.02% of 2025 revenue, yet diabetes is the fastest mover, with a 19.98% CAGR to 2031.
- By end user, home care settings held 46.82% of deployments in 2025, while clinics & specialty centers are growing at 16.55% CAGR through 2031.
- By geography, North America commanded a 36.78% share in 2025, but Asia-Pacific is forecast to lead growth at a 21.41% CAGR on supportive national digital-health policies.
Note: Market size and forecast figures in this report are generated using Mordor Intelligence’s proprietary estimation framework, updated with the latest available data and insights as of 2026.
Global Connected Drug Delivery Devices Market Trends and Insights
Drivers Impact Analysis*
| Driver | (~) % Impact on CAGR Forecast | Geographic Relevance | Impact Timeline |
|---|---|---|---|
| Bluetooth Integration Cost Deflation | +2.8% | Global, led by North America and Europe | Short term (≤ 2 years) |
| Shift to Value-Based Care Reimbursement Models | +3.2% | North America, Western Europe, emerging Asia-Pacific | Medium term (2-4 years) |
| Post-COVID Telehealth Normalization | +2.1% | Global, strongest in North America and select Asia-Pacific markets | Short term (≤ 2 years) |
| Regulatory Fast-Track Pathways for SaMD-Drug Combination Products | +1.9% | North America, Europe, Japan | Medium term (2-4 years) |
| Graphene-Based Sensor Miniaturization Breakthroughs | +1.6% | Global, R&D hubs in North America and Asia-Pacific | Long term (≥ 4 years) |
| Battery-Free NFC Power-Scavenging Designs | +1.5% | Global, faster uptake in Europe and North America | Medium term (2-4 years) |
| Source: Mordor Intelligence | |||


Bluetooth Integration Cost Deflation
Bluetooth Low Energy chipsets fell to USD 0.42 per unit in 2025 after Taiwan Semiconductor Manufacturing Company shifted production to 5-nanometer nodes, doubling transistor density and reducing power draw.[1]Taiwan Semiconductor Manufacturing Co., “Investor Presentation 2025,” tsmc.com Hospitals in Germany and the United Kingdom subsequently listed connected injectors as first-line options because adherence data helps avoid bundled-payment penalties. Nordic Semiconductor shipped 180 million medical-grade SoCs in 2025, a 64% jump over 2024, giving smaller device makers turnkey modules that cut development cycles to nine months. The price collapse removes cost as a gating factor, allowing generic manufacturers to embed radios in pen injectors without exceeding a USD 2 bill-of-materials ceiling. As unit economics converge, procurement teams now treat connectivity as standard rather than a premium, broadening the addressable market for connected drug delivery devices.
Shift to Value-Based Care Reimbursement Models
The Centers for Medicare & Medicaid Services lifted its Chronic Care Management stipend to USD 63 per beneficiary per month in January 2025, explicitly rewarding remote adherence monitoring.[2]Centers for Medicare & Medicaid Services, “Chronic Care Management Update 2025,” cms.gov UnitedHealthcare and Anthem insist on objective inhaler data before approving biologic step-ups for severe asthma, affecting 1.2 million members. England’s National Health Service withholds 15% of diabetes-drug reimbursement if patients fail to upload pen-injector data at least 80% of prescribed doses. Japan followed with a COPD adherence tier in October 2025. These mandates flip incentives by penalizing non-adherence, accelerating adoption throughout the Connected drug delivery devices market.
Post-COVID Telehealth Normalization
Outpatient telehealth stabilized at 22% of U.S. encounters in 2025, well above the 4% pre-pandemic baseline.[3]American Medical Association, “Telehealth Survey 2025,” ama-assn.org Connected devices provide clinicians with dose events, site rotation, and inhalation flow data that compensate for the lack of in-person observation. The U.S. Drug Enforcement Administration now permits e-prescriptions of controlled substances via telehealth, removing a hurdle for opioid pain pumps and ADHD injectors. Australia extended telehealth reimbursement to 2027 contingent on connected-device data uploads. India’s National Digital Health Mission plugged inhaler and insulin-pen data into its health-ID system in June 2025, linking 180 million beneficiaries. This permanence embeds connectivity into mainstream care pathways and enlarges the Connected drug delivery devices market footprint.
Regulatory Fast-Track Pathways for SaMD-Drug Combination Products
FDA granted 14 Breakthrough Device designations to connected delivery systems in 2025, up 75% year over year. Draft guidance published in February 2025 positions predictive-dose algorithms as software-as-a-medical-device, funneling them through combination-product channels that move faster than stand-alone drug reviews. Europe launched a parallel advice track, reducing consultation time to 60 days. Japan’s Sakigake scheme cleared nine connected insulin pens in 2025. These channels compress commercialization to 24 months post-clinical, enabling first movers to secure exclusivity in the connected drug delivery devices market.
Restraints Impact Analysis*
| Restraint | (~) % Impact on CAGR Forecast | Geographic Relevance | Impact Timeline |
|---|---|---|---|
| Cyber-Security & Data-Privacy Compliance Burden | -2.4% | Global, strictest in North America and Europe | Short term (≤ 2 years) |
| Single-Use Electronics-Waste Regulations Tightening | -1.8% | Europe and Asia-Pacific, emerging North America | Medium term (2-4 years) |
| Semiconductor-Grade MEMS Supply Shortages | -1.6% | Global, acute in North America and Europe | Short term (≤ 2 years) |
| Interoperability Hurdles with Fragmented EHR Standards | -1.3% | North America, Europe, emerging Asia-Pacific | Medium term (2-4 years) |
| Source: Mordor Intelligence | |||
Cyber-Security & Data-Privacy Compliance Burden
FDA’s post-market guidance, effective October 2025, compels manufacturers to publish software bills of materials and close vulnerabilities within 30 days, adding an estimated USD 1.2 million in annual costs for mid-size firms. GDPR fines on device makers hit EUR 14 million in 2025, up 40% over 2024, mostly for unencrypted dose data. HIPAA classifies devices that locally store dosing logs as covered entities, bringing audits that once applied only to EHR systems. Compliance drained 18% of Insulet’s 2025 R&D budget, diverting resources from new features. Rising obligations are putting pressure on consolidation in the Connected drug delivery devices market, as smaller players seek scale to amortize legal overheads.
Single-Use Electronics-Waste Regulations Tightening
The EU’s revised WEEE Directive, starting in January 2027, requires take-back programs to reach 65% collection within 2 years of launch. California SB 244 funds e-waste recycling at USD 0.15 per unit, costing a maker of 180 million syringes USD 27 million annually. South Korea extended its producer responsibility levy to connected inhalers at 12% of the wholesale price, which manufacturers pass on to consumers. Becton, Dickinson’s German pilot collected only 38% of used syringes, well below the mandate. The push toward reusable electronics may slow uptake of fully integrated disposable platforms, trimming growth in parts of the connected drug delivery devices market.
*Our forecasts treat driver/restraint impacts as directional, not additive. The impact forecasts reflect baseline growth, mix effects, and variable interactions.
Segment Analysis
By Product Type: Sensors Gain as Retrofits Accelerate
Connected Sensors are climbing at a 17.96% CAGR, even though integrated connected devices retained 58.12% revenue in 2025. Retrofit clip-on designs let pharmaceutical partners upgrade legacy injectors within 12 months, whereas integrated platforms need 36 months for new tooling. Propeller Health’s metered-dose inhaler sensor earned formulary status with 14 U.S. plans in 2025 because it avoided capital expense. Biocorp’s Mallya achieved 92% accuracy in detecting missed doses, convincing Sanofi to bundle it with Lantus in France. Integrated units preserve a premium business model through recurring cartridges and software subscriptions. Tandem Diabetes’s slim X2 pump integrated Dexcom CGM and secured 68% of U.S. automated insulin delivery users in 2025. The Connected drug delivery devices market, therefore, splits between high-value integrated ecosystems and cost-efficient sensor retrofits.


By Device Type: Wearable Injectors Reshape Biologic Delivery
Wearable Injectors register an 18.48% CAGR, fastest across devices, as biologic volumes rise beyond syringe capacity. Enable Injections’ enFuse gained six new FDA-approved indications in 2025, shifting oncology care from USD 3,000 infusion sessions to USD 400 at-home patches. Prefilled Syringes still dominate the connected drug delivery devices market, with a 38.05% share, because insulin and GLP-1 doses remain below 1 milliliter. Yet Amgen moved 40% of Repatha scripts to a 3.5 mL wearable in 2025. Becton, Dickinson and Company’s reusable Libertas platform targets sustainability mandates and already shows 34% adoption among rheumatoid arthritis patients. Form-factor diversification widens choice and deepens market reach.
By Technology: Cellular Connectivity Breaks Smartphone Dependence
Cellular/LPWAN modules are advancing at a 20.66% CAGR, as rural and elderly users lack reliable smartphone pairing. Bluetooth maintained a 44.82% revenue share in 2025 despite a USD 0.42 cost advantage, yet data gaps occur when patients leave their phones behind. Eitan Medical’s LTE-M-equipped wearable captured 98% of dose logs, compared with 76% for Bluetooth controls. Hybrid architectures that default to Bluetooth but fall back to cellular add USD 1.80 to the bill of materials while guaranteeing complete datasets. Regulators now allow over-the-air updates for cellular devices without new clearances, lowering post-market upkeep.
By Route of Administration: Inhalational Gains from Guideline Mandates
Injectables accounted for 59.08% of 2025 revenue, yet Inhalational products expanded at a 15.41% CAGR as guidelines tie biologic escalation to adherence proof. Adherium’s sensor trimmed asthma exacerbations by 34%, prompting NICE to recommend connected inhalers in severe cases. However, sensor costs remain high for generic albuterol, limiting mass adoption. The Connected drug delivery devices market, therefore, shows route-based divergence: injectables ride the biologics pipeline, while inhalers benefit from policy-mandated adherence tracking.
By Therapeutic Application: Diabetes Surges on Closed-Loop Momentum
Asthma & COPD owned 51.02% of 2025 revenue, but Diabetes rockets ahead at a 19.98% CAGR, powered by closed-loop systems. Insulet’s Omnipod 5 reached 520,000 U.S. users by December 2025, raising connected pump annual revenue intensity to USD 4,800 per patient. FDA cleared six automated insulin delivery platforms in 2025 under De Novo classification, lowering regulatory risk. Cardiovascular, Autoimmune, and Oncology indications are supported by connected injectors and pill bottles that capture adherence data for high-cost therapies. Diversification across therapeutic areas expands the base of the Connected drug delivery devices market.
By End User: Clinics Gain as Infusion Shifts Outpatient
Home settings held a 46.82% share in 2025, yet clinics & specialty centers post a 16.55% CAGR as biologics move out of hospitals. YpsoDose cellular injectors let 140 U.S. rheumatology practices close infusion suites and bill remote-monitoring fees instead. Hospitals remain essential for CAR-T and gene therapies that demand inpatient monitoring. Equity gaps persist: commercially insured users adopt connected pens at 82%, while Medicaid beneficiaries do so at 54%. Closing this digital divide remains a policy priority to fully unlock the potential of the connected drug delivery devices market.
Geography Analysis
North America controls 36.78% of 2025 revenue, buoyed by Medicare reimbursement, high device penetration, and FDA benchmark status. Growth moderates to 13.8% CAGR as saturation approaches, yet the region shapes global approval sequences under mutual recognition pacts. Asia-Pacific leads expansion at 21.41% CAGR as China reimburses inhaler data uploads for 180 million patients and India embeds insulin-pen logs in national health IDs. Japan’s Sakigake scheme cleared nine connected pens in 2025, and Australia ties telehealth reimbursement to connected-device usage.
Diverse rules across 20 regimes raise compliance complexity, rewarding multinationals with local expertise. Overall, regional policy divergence shapes the strategic allocation of sales and regulatory resources in the connected drug delivery devices market.

Competitive Landscape
The top five vendors, Medtronic, Insulet, Becton Dickinson, Ypsomed, and AptarGroup, captured about significant market share of the connected drug delivery devices market revenue in 2025. Medtronic’s MiniMed 780G held 34% U.S. automated pump share, leveraging an installed base of 1.2 million and Abbott CGM interoperability. Insulet partnered with Abbott in January 2026 to expand sensor choice, reflecting an industry pivot from walled gardens to open platforms. Patent filings shifted toward battery-free NFC sensors, with the top 20 companies lodging 340 patents in 2025.
Start-ups exploit white spaces: Portal Instruments won 510(k) clearance for a needle-free jet injector aimed at needle-phobic diabetes patients. BEIGfoot Biomedical’s low-cost smart pen targets users who require multiple daily injections, a group overlooked by pump vendors. Partnerships with contract developers, such as Phillips-Medisize, help newcomers navigate combination-product pathways. Compliance overheads push smaller firms toward acquisition or alliance with incumbents that can spread costs across portfolios.
Competitive dynamics coalesce around three levers: codevelopment with pharma to bundle devices, rapid regulatory clearances, and real-world evidence for payer contracts. Vendors that control both hardware and analytic software stand to lock in durable revenue streams across consumables and subscriptions, reinforcing their position in the Connected drug delivery devices market.
Connected Drug Delivery Devices Industry Leaders
West Pharmaceutical Services, Inc.
Adherium Limited
Resmed Inc
Teva Pharmaceutical Industries
Aptar Pharma
- *Disclaimer: Major Players sorted in no particular order

Recent Industry Developments
- May 2025: Enable Injections obtained EU MDR CE-mark for the enFuse Syringe Transfer System, opening sales across the European Union.
- February 2025: Supernus Pharmaceuticals secured FDA approval for ONAPGO, the first subcutaneous apomorphine infusion device for Parkinson’s motor fluctuations.
- December 2024: Gerresheimer won FDA tentative approval for Lasix ONYU, a home-use furosemide micropump enabling sustainable treatment of congestive heart failure.
- November 2024: Medtronic gained FDA clearance for its InPen app with missed-meal detection, aligning with the launch of Simplera all-in-one CGM.


Research Methodology Framework and Report Scope
Market Definitions and Key Coverage
Our study defines the connected drug delivery devices market as every sensor-enabled inhaler, injector, pen, nebulizer, or clip-on sleeve that transmits dose or adherence data via Bluetooth, NFC, or low-power cellular radios to companion software across seventeen tracked nations. We include hardware revenue only, valuing each device at first sale and assigning units to the geography where therapy begins.
Scope exclusion: purely mechanical or single-use products with no wireless data pathway are outside this review.
Segmentation Overview
- By Product Type
- Connected Sensors
- Integrated Connected Devices
- By Device Type
- Inhalers
- Pen & Auto-Injectors
- Prefilled Syringes
- Wearable Injectors
- Others
- By Technology
- Bluetooth
- NFC
- Cellular / LPWAN
- Other
- By Route of Administration
- Inhalational
- Injectable
- By Therapeutic Application
- Asthma & COPD
- Diabetes
- Cardiovascular Disorders
- Autoimmune & Inflammatory Diseases
- Oncology
- Other
- By End User
- Home Care Settings
- Hospitals
- Clinics & Specialty Centers
- Other
- By Geography
- North America
- United States
- Canada
- Mexico
- Europe
- Germany
- United Kingdom
- France
- Italy
- Spain
- Rest of Europe
- Asia-Pacific
- China
- Japan
- India
- Australia
- South Korea
- Rest of Asia-Pacific
- Middle East & Africa
- GCC
- South Africa
- Rest of Middle East & Africa
- South America
- Brazil
- Argentina
- Rest of South America
- North America
Detailed Research Methodology and Data Validation
Primary Research
Structured interviews with pulmonologists, endocrinologists, diabetes educators, payers, and connected-device engineers in North America, Europe, and Asia-Pacific validate average selling prices, uptake triggers, and real-world adherence behavior that documents alone cannot reveal.
Desk Research
Our analysts start by aligning unit flows with WHO Global Health Observatory imports, OECD health statistics, the US FDA 510(k) database, and the European Medicines Agency registry, which anchor installed bases and approval trends. We then layer insights from Digital Therapeutics Alliance briefs, patent analytics via Questel, Dow Jones Factiva archives, and 10-K filings to map launch pipelines, price drift, and reimbursement milestones. D&B Hoovers supports company-level splits, while several other open datasets round out the desk phase; the list is illustrative, not exhaustive.
Market-Sizing & Forecasting
We apply one top-down rebuild of annual inhaler and injector volumes, filter them through verified smart-penetration ratios, and multiply by expert-approved ASPs to reach the baseline. Supplier roll-ups and sampled hospital audits provide selective bottom-up checks. Key model drivers include asthma prevalence, insulin-using diabetic counts, Bluetooth chipset cost curves, home-care visit frequency, and reimbursement coverage ratios. A multivariate regression blended with ARIMA projects each variable forward, while interpolation bridges reporting gaps. According to Mordor Intelligence, this yields a market value.
Data Validation & Update Cycle
Mordor analysts compare outputs with shipment logs and peer surveys, resolve anomalies through call-backs, route findings through a two-level review, and refresh the dataset annually, with interim updates after major recalls, approvals, or payer rule changes.
Why Mordor's Connected Drug Delivery Devices Baseline Commands Reliability
Published estimates often diverge because some publishers bundle software fees with hardware, use earlier base years, or convert currencies at spot rates. Our focused scope and yearly refresh keep figures contemporary and comparable.
Benchmark comparison
| Market Size | Anonymized source | Primary gap driver |
|---|---|---|
| USD 1.59 B (2025) | Mordor Intelligence | - |
| USD 7.44 B (2024) | Global Consultancy A | Includes platform subscriptions and digital therapeutics |
| USD 5.86 B (2023) | Trade Journal B | Uses 2023 base and growth without ASP normalization |
| USD 0.36 B (2018) | Industry Analyst C | Focuses only on injectable segment |
These contrasts show how our disciplined scope, variable-level validation, and annual refresh give decision-makers a balanced, transparent baseline they can trace to tangible data.


Key Questions Answered in the Report
How large will the Connected drug delivery devices market be by 2031?
It is forecast to reach USD 4.37 billion by 2031, expanding at a 15.43% CAGR from 2026 to 2031.
Which segment is growing fastest within connected devices?
Wearable Injectors post the highest growth at 18.48% CAGR as high-volume biologics migrate from infusion centers to at-home patches.
What policy moves drive adoption in Asia-Pacific?
China reimburses connected inhaler data, India links insulin-pen logs to national health IDs, and Japan fast-tracks connected pens under the Sakigake pathway.
Why is diabetes a key opportunity?
Closed-loop insulin pumps integrate continuous glucose monitoring, raising annual device and software revenue to about USD 4,800 per user and yielding a 19.98% CAGR.
How are sustainability regulations shaping design choices?
The EU’s WEEE directive and similar laws push manufacturers toward reusable electronics or battery-free NFC tags to meet stringent take-back and recycling targets.
Page last updated on:


