Pecan Market Size and Share
Pecan Market Analysis by Mordor Intelligence
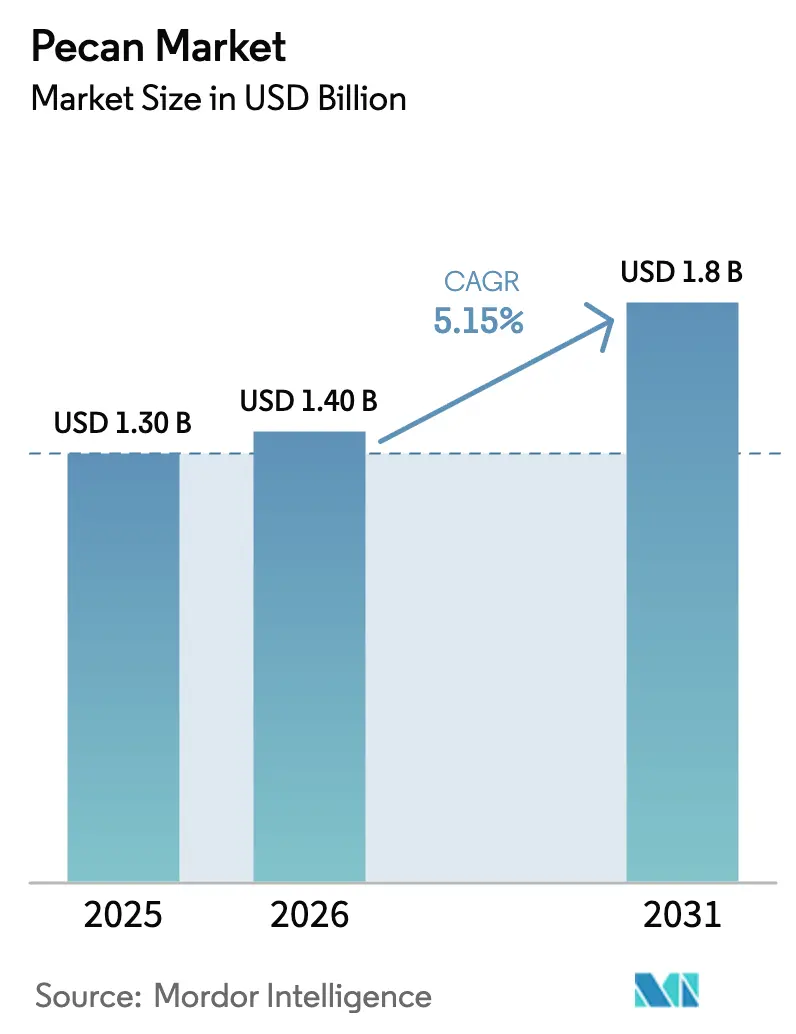
The pecan market size was valued at USD 1.3 billion in 2025 and estimated to grow from USD 1.4 billion in 2026 to reach USD 1.8 billion by 2031, at a CAGR of 5.15% during the forecast period (2026-2031). Demand momentum is driven by four key factors, including the growing adoption of plant-based proteins, strong foodservice growth in the Asia-Pacific region, noticeable changes in global trade routes, and continuous innovation in value-added applications. Production swings tied to alternate-bearing cycles are prompting processors to secure multi-year contracts during bumper seasons, a strategy that can lock in raw material costs and stabilize downstream pricing. Buyers in China, India, and Japan are increasingly valuing year-round supply assurance over traditional country-of-origin loyalty, creating opportunities for counter-seasonal harvests from countries such as South Africa and Australia to capture market share. The 2025 Dietary Guidelines Advisory Committee has prioritized nuts and seeds as a key component of protein recommendations. This development is projected to impact institutional foodservice procurement and retail assortment decisions, supported by favorable regulatory guidance.
Key Report Takeaways
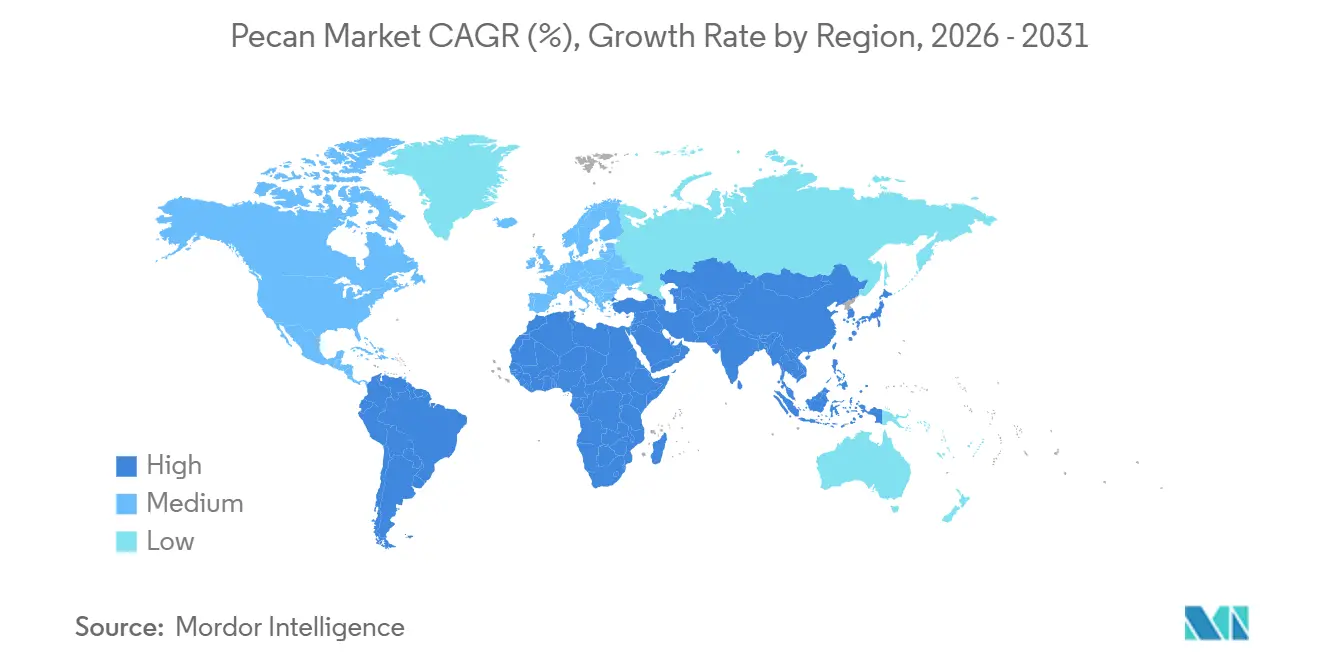
- By geography, North America led with a 53% pecan market share in 2025, while the Asia-Pacific region is forecast to expand at a 7.8% CAGR through 2031.
Note: Market size and forecast figures in this report are generated using Mordor Intelligence’s proprietary estimation framework, updated with the latest available data and insights as of January 2026.
Global Pecan Market Trends and Insights
Drivers Impact Analysis*
| Driver | (~) % Impact on CAGR Forecast | Geographic Relevance | Impact Timeline |
|---|---|---|---|
| Rising health-driven snacking and protein demand | +1.2% | Global, with strongest uptake in North America and Asia-Pacific urban centers | Medium term (2-4 years) |
| Growing use in bakery and confectionery applications | +0.9% | North America and Europe, expanding into Asia-Pacific premium segments | Short term (≤ 2 years) |
| Surge in plant-based dairy and snack launches | +0.8% | North America and Europe core markets, with Asia-Pacific emerging adoption | Medium term (2-4 years) |
| Expanding consumption in Asia-Pacific foodservice chains | +1.3% | Asia-Pacific core, with spillover into Middle East hospitality sectors | Long term (≥ 4 years) |
| Up-cycling of pecan press-cake into high-protein inputs | +0.4% | North America production hubs, with export potential to Europe and Asia | Long term (≥ 4 years) |
| Carbon-credit potential of pecan agro-forestry orchards | +0.3% | Global, with early adoption in United States, Australia, and South Africa | Long term (≥ 4 years) |
| Source: Mordor Intelligence | |||


Rising Health-Driven Snacking and Protein Demand
Protein-centric snacking has moved firmly into the mainstream, and the pecan market benefits because a 28-gram serving delivers 2.6 grams of protein and 3 grams of fiber while maintaining a favorable unsaturated fat profile. The 2025 Dietary Guidelines Advisory Committee elevated nuts within protein food groups, which directly shapes school lunch menus, hospital contracts, and corporate wellness programs [1]Source: United States Department of Agriculture, “Dietary Guidelines for Americans, 2025,” USDA.gov. Institutional volume commitments offer a steadier demand base than retail promotions, which tend to spike during holiday gift-giving periods. The challenge remains low consumer top-of-mind awareness relative to almonds, which underscores the need for broader category marketing backed by consistent supply.
Growing Use in Bakery and Confectionery Applications
Moisture retention and high oil content enable pecans to maintain a desirable mouthfeel in cookies and brownies, allowing formulators to reduce added fats. The July 2024 United States Department of Agriculture grade standard update introduced granular size specifications that enable bakers to source exact kernel dimensions, thereby minimizing processing waste and supporting premium positioning [2]Source: United States Department of Agriculture, Agricultural Marketing Service, “United States Standards for Grades of Pecans in the Shell,” AMS.USDA.gov. Yet production volatility creates procurement risk, so large food manufacturers hedge with futures contracts or blend formulations with almonds during tight supply seasons.
Surge in Plant-Based Dairy and Snack Launches
Pecan milk and pecan-based cream cheese offer a rich flavor without the use of stabilizer gums, addressing taste concerns that have hindered the development of other nut-based beverages. Water-use comparisons favor pecans over almonds, reinforcing sustainability claims. Retail trial rates remain modest, so brands lean on joint promotions with pecan industry associations to secure shelf placements. Investment flows continue because pecan protein concentrates offer a clean-label path to enhance nutrition panels in bars and smoothies without imparting soy or pea-like taste notes.
Expanding Consumption in Asia-Pacific Foodservice Chains
Premium bakeries and coffee shops across China, India, and Japan now feature pecans as indicators of Western indulgence. American Pecan Council trade data confirm that Chinese importers shifted roughly 75% of 2024 procurement to South African origins, underscoring a supply-first rather than loyalty-first mindset. Foodservice exposure builds consumer familiarity, which then pulls retail volume, cementing the pecan market in the region.
Restraints Impact Analysis*
| Restraint | (~) % Impact on CAGR Forecast | Geographic Relevance | Impact Timeline |
|---|---|---|---|
| Weather-driven price volatility | -0.7% | Global, with acute impacts in United States Gulf Coast and Mexico production zones | Short term (≤ 2 years) |
| Marketing spend gap versus almonds and walnuts | -0.5% | Global, most pronounced in Asia-Pacific and Europe where brand awareness lags | Medium term (2-4 years) |
| Skilled-labor shortages at peak harvest | -0.4% | North America and Australia, with mechanization adoption lagging in smaller orchards | Short term (≤ 2 years) |
| Fungicide-resistant pecan-scab outbreaks | -0.3% | Southeastern United States and humid subtropical growing regions | Medium term (2-4 years) |
| Source: Mordor Intelligence | |||
Weather-Driven Price Volatility
The United States Department of Agriculture (USDA) forecasts indicate that production is projected to increase from 500.3 thousand metric tons in 2024 to 1,088.6 thousand metric tons in 2025, exemplifying the alternate-bearing cycle. Such surges depress prices and test cold-storage capacity, while adverse events, such as hurricanes, can cut output in half the following season. Buyers react by diversifying supply across hemispheres and using short-term contracts, which fragments producer relationships.
Marketing Spend Gap Versus Almonds and Walnuts
The Almond Board of California and California Walnut Commission operate multimillion-dollar advertising programs. By comparison, fragmented pecan growers lack a unified fund, so category share of voice remains thin on social media, in nutrition research sponsorships, and at retail merchandising. Limited consumer exposure restricts trial and repeat purchases, especially in Europe and Asia-Pacific, where nuts other than almonds remain niche.
*Our forecasts treat driver/restraint impacts as directional, not additive. The impact forecasts reflect baseline growth, mix effects, and variable interactions.
Geography Analysis
North America retained 53% of the pecan market share in 2025, anchored by the United States and Mexico, yet producers face heightened production volatility and higher labor costs. Data from the United States Department of Agriculture (USDA) indicate that the pecan market size in the region can double during on-years and decrease during off-years, creating challenges for inventory planning. Mexico augments supply with counter-cyclical bearing in northern orchards, but both countries lost share in China as importers shifted toward South African origin.
Asia-Pacific is the fastest-expanding region, registering a 7.8% CAGR through 2031. China remains the primary demand engine, even after shifting 75% of its 2024 purchases to South African suppliers. Australia’s expanding orchards are positioned to satisfy rising demand in nearby Asian markets, where premium bakery chains and specialty cafes showcase pecans as aspirational ingredients. India and Japan follow, driven by urban middle-class consumers experimenting with Western desserts. Europe sustains steady usage, concentrated in Germany, France, Spain, and Italy, where pecans serve as inclusions in bakery and confectionery products. Importers favor certified organic and sustainability-audited shipments to satisfy retailer requirements.
South Africa’s competitive prices gained footing in 2024 and 2025, challenging long-established North American supply dominance. Brazil and Argentina have seen higher bakery incorporation, but tariffs and currency volatility limit large-scale imports. The Middle East, led by the United Arab Emirates and Saudi Arabia, leverages hospitality demand in five-star hotels. South Africa plays a dual role as both producer and exporter, channeling its output into Asia while domestic uptake remains limited.

Competitive Landscape
Pecan processors control global throughput. South Georgia Pecan Company, National Pecan, and Golden Kernel run fully integrated systems that span orchards, cracking, shelling, and distribution, enabling continuous investment in optical sorting, cold storage, and traceability technology. Their scale advantage became apparent in April 2024, when Pecan Nation partnered with South Georgia Pecan Company to secure a long-term supply and expand branded snacking lines to 15,000 retail outlets [3]Source: Pecan Nation, “Partnership Announcement with South Georgia Pecan Company,” PecanNation.com. Integrated players also leverage multi-year grower contracts that stabilize farm income and ensure a steady supply of kernels during off-crop years. These strategies allow leading firms to absorb weather-driven volume shocks while defending shelf space against lower-cost imports.
Smaller shellers often depend on manual grading, which limits both throughput and consistency in quality. In 2024, the United States Department of Agriculture introduced stricter defect tolerances in its grade update, compelling processors to adopt precision optical scanners to meet the demands of bakery and confectionery buyers requiring precise kernel dimensions. Access to capital has become a critical factor for mid-tier companies to comply with these standards, driving mergers that consolidate orchards and processing operations into larger, integrated supply chains. In March 2024, several United States processors announced the installation of new automated cracking lines, indicating a consolidation trend favoring companies capable of spreading equipment costs over higher production volumes.
Southern Hemisphere entrants are rewriting trade dynamics. South African exporters deliver counter-seasonal supplies that help Asian buyers smooth their inventory, and Australia follows a similar model on a smaller scale, focusing on premium bakery chains in Japan and Singapore. Large ingredient purchasers now issue annual tenders that blend Northern and Southern Hemisphere origins, cutting the risk of weather-related gaps while pressuring North American incumbents on price. In response, integrated processors in the United States extend grower contracts beyond five years and expand cold storage, allowing excess crops to move into off-season windows, which helps them retain key accounts despite rising import competition.
Recent Industry Developments
- June 2025: Diamond of California introduced Snack Pecans, marking the company's first dedicated pecan snack product in its 100-year history. This launch marks a significant milestone for the company, as it expands its product portfolio to meet the growing demand for convenient and healthy snack options.
- June 2025: Cafe Delhi Heights collaborated with American Pecans to launch the 'American Pecans Superfoods Festival.' This culinary event is scheduled from June 15 to July 15 at all Cafe Delhi Heights outlets in India.
- April 2024: Pecan Nation announced a strategic partnership with South Georgia Pecan Company to expand retail distribution and secure long-term supply commitments, leveraging the latter's position as the world's largest pecan sheller. The collaboration aims to place Pecan Nation in 15,000 retail outlets, while maintaining its brand differentiation through premium packaging and marketing that focuses on health benefits and sustainable sourcing.


Research Methodology Framework and Report Scope
Market Definitions and Key Coverage
Our study defines the global pecan market as all in-shell and shelled pecans that reach end users in food manufacturing, retail snacking, food-service, and household channels. Forms such as raw, roasted, chopped, or candied are included when pecan remains the main ingredient.
Scope exclusion: derivative products (oils, flours, blended nut mixes with <50 % pecan) lie outside this assessment.
Segmentation Overview
-
By Geography
-
North America
-
United States
- Production Analysis (Area Harvested, Yield, and Production Volume)
- Consumption Analysis (Consumption Value and Volume)
- Import Market Analysis (Import Value, Volume, and Key Supplying Markets)
- Export Market Analysis (Export Value, Volume, and Key Destination Markets)
- Wholesale Price Trend Analysis and Forecast
- Regulatory Framework
- List of Key Players
- Logistics and Infrastructure
- Seasonality Analysis
-
Canada
- Production Analysis (Area Harvested, Yield, and Production Volume)
- Consumption Analysis (Consumption Value and Volume)
- Import Market Analysis (Import Value, Volume, and Key Supplying Markets)
- Export Market Analysis (Export Value, Volume, and Key Destination Markets)
- Wholesale Price Trend Analysis and Forecast
- Regulatory Framework
- List of Key Players
- Logistic and Infrastructure
- Seasonality Analysis
-
Mexico
- Production Analysis (Area Harvested, Yield, and Production Volume)
- Consumption Analysis (Consumption Value and Volume)
- Import Market Analysis (Import Value, Volume, and Key Supplying Markets)
- Export Market Analysis (Export Value, Volume, and Key Destination Markets)
- Wholesale Price Trend Analysis and Forecast
- Regulatory Framework
- List of Key Players
- Logistic and Infrastructure
- Seasonality Analysis
-
United States
-
Europe
-
Russia
- Production Analysis (Area Harvested, Yield, and Production Volume)
- Consumption Analysis (Consumption Value and Volume)
- Import Market Analysis (Import Value, Volume, and Key Supplying Markets)
- Export Market Analysis (Export Value, Volume, and Key Destination Markets)
- Wholesale Price Trend Analysis and Forecast
- Regulatory Framework
- List of Key Players
- Logistic and Infrastructure
- Seasonality Analysis
-
Germany
- Production Analysis (Area Harvested, Yield, and Production Volume)
- Consumption Analysis (Consumption Value and Volume)
- Import Market Analysis (Import Value, Volume, and Key Supplying Markets)
- Export Market Analysis (Export Value, Volume, and Key Destination Markets)
- Wholesale Price Trend Analysis and Forecast
- Regulatory Framework
- List of Key Players
- Logistic and Infrastructure
- Seasonality Analysis
-
Italy
- Production Analysis (Area Harvested, Yield, and Production Volume)
- Consumption Analysis (Consumption Value and Volume)
- Import Market Analysis (Import Value, Volume, and Key Supplying Markets)
- Export Market Analysis (Export Value, Volume, and Key Destination Markets)
- Wholesale Price Trend Analysis and Forecast
- Regulatory Framework
- List of Key Players
- Logistic and Infrastructure
- Seasonality Analysis
-
Spain
- Production Analysis (Area Harvested, Yield, and Production Volume)
- Consumption Analysis (Consumption Value and Volume)
- Import Market Analysis (Import Value, Volume, and Key Supplying Markets)
- Export Market Analysis (Export Value, Volume, and Key Destination Markets)
- Wholesale Price Trend Analysis and Forecast
- Regulatory Framework
- List of Key Players
- Logistic and Infrastructure
- Seasonality Analysis
-
France
- Production Analysis (Area Harvested, Yield, and Production Volume)
- Consumption Analysis (Consumption Value and Volume)
- Import Market Analysis (Import Value, Volume, and Key Supplying Markets)
- Export Market Analysis (Export Value, Volume, and Key Destination Markets)
- Wholesale Price Trend Analysis and Forecast
- Regulatory Framework
- List of Key Players
- Logistic and Infrastructure
- Seasonality Analysis
-
Russia
-
Asia-Pacific
-
China
- Production Analysis (Area Harvested, Yield, and Production Volume)
- Consumption Analysis (Consumption Value and Volume)
- Import Market Analysis (Import Value, Volume, and Key Supplying Markets)
- Export Market Analysis (Export Value, Volume, and Key Destination Markets)
- Wholesale Price Trend Analysis and Forecast
- Regulatory Framework
- List of Key Players
- Logistic and Infrastructure
- Seasonality Analysis
-
India
- Production Analysis (Area Harvested, Yield, and Production Volume)
- Consumption Analysis (Consumption Value and Volume)
- Import Market Analysis (Import Value, Volume, and Key Supplying Markets)
- Export Market Analysis (Export Value, Volume, and Key Destination Markets)
- Wholesale Price Trend Analysis and Forecast
- Regulatory Framework
- List of Key Players
- Logistic and Infrastructure
- Seasonality Analysis
-
Japan
- Production Analysis (Area Harvested, Yield, and Production Volume)
- Consumption Analysis (Consumption Value and Volume)
- Import Market Analysis (Import Value, Volume, and Key Supplying Markets)
- Export Market Analysis (Export Value, Volume, and Key Destination Markets)
- Wholesale Price Trend Analysis and Forecast
- Regulatory Framework
- List of Key Players
- Logistics and Infrastructure
- Seasonality Analysis
-
Australia
- Production Analysis (Area Harvested, Yield, and Production Volume)
- Consumption Analysis (Consumption Value and Volume)
- Import Market Analysis (Import Value, Volume, and Key Supplying Markets)
- Export Market Analysis (Export Value, Volume, and Key Destination Markets)
- Wholesale Price Trend Analysis and Forecast
- Regulatory Framework
- List of Key Players
- Logistics and Infrastructure
- Seasonality Analysis
-
China
-
South America
-
Brazil
- Production Analysis (Area Harvested, Yield, and Production Volume)
- Consumption Analysis (Consumption Value and Volume)
- Import Market Analysis (Import Value, Volume, and Key Supplying Markets)
- Export Market Analysis (Export Value, Volume, and Key Destination Markets)
- Wholesale Price Trend Analysis and Forecast
- Regulatory Framework
- List of Key Players
- Logistics and Infrastructure
- Seasonality Analysis
-
Argentina
- Production Analysis (Area Harvested, Yield, and Production Volume)
- Consumption Analysis (Consumption Value and Volume)
- Import Market Analysis (Import Value, Volume, and Key Supplying Markets)
- Export Market Analysis (Export Value, Volume, and Key Destination Markets)
- Wholesale Price Trend Analysis and Forecast
- Regulatory Framework
- List of Key Players
- Logistics and Infrastructure
- Seasonality Analysis
-
Brazil
-
Middle East
-
Israel
- Production Analysis (Area Harvested, Yield, and Production Volume)
- Consumption Analysis (Consumption Value and Volume)
- Import Market Analysis (Import Value, Volume, and Key Supplying Markets)
- Export Market Analysis (Export Value, Volume, and Key Destination Markets)
- Wholesale Price Trend Analysis and Forecast
- Regulatory Framework
- List of Key Players
- Logistics and Infrastructure
- Seasonality Analysis
-
Saudi Arabia
- Production Analysis (Area Harvested, Yield, and Production Volume)
- Consumption Analysis (Consumption Value and Volume)
- Import Market Analysis (Import Value, Volume, and Key Supplying Markets)
- Export Market Analysis (Export Value, Volume, and Key Destination Markets)
- Wholesale Price Trend Analysis and Forecast
- Regulatory Framework
- List of Key Players
- Logistics and Infrastructure
- Seasonality Analysis
-
United Arab Emirates
- Production Analysis (Area Harvested, Yield, and Production Volume)
- Consumption Analysis (Consumption Value and Volume)
- Import Market Analysis (Import Value, Volume, and Key Supplying Markets)
- Export Market Analysis (Export Value, Volume, and Key Destination Markets)
- Wholesale Price Trend Analysis and Forecast
- Regulatory Framework
- List of Key Players
- Logistics and Infrastructure
- Seasonality Analysis
-
Israel
-
Africa
-
South Africa
- Production Analysis (Area Harvested, Yield, and Production Volume)
- Consumption Analysis (Consumption Value and Volume)
- Import Market Analysis (Import Value, Volume, and Key Supplying Markets)
- Export Market Analysis (Export Value, Volume, and Key Destination Markets)
- Wholesale Price Trend Analysis and Forecast
- Regulatory Framework
- List of Key Players
- Logistics and Infrastructure
- Seasonality Analysis
-
Egypt
- Production Analysis (Area Harvested, Yield, and Production Volume)
- Consumption Analysis (Consumption Value and Volume)
- Import Market Analysis (Import Value, Volume, and Key Supplying Markets)
- Export Market Analysis (Export Value, Volume, and Key Destination Markets)
- Wholesale Price Trend Analysis and Forecast
- Regulatory Framework
- List of Key Players
- Logistics and Infrastructure
- Seasonality Analysis
-
South Africa
-
North America
Detailed Research Methodology and Data Validation
Primary Research
Mordor analysts interviewed growers in Georgia and Chihuahua, shellers in Texas, brokers in Rotterdam, and R & D leads at confectionery and dairy plants across Asia-Pacific. Conversations clarified shell-out ratios, producer margins, seasonal demand pulses, and likely adoption of pecan-rich plant-based SKUs, allowing us to validate desk findings and adjust contentious assumptions.
Desk Research
We collated time-series data on tree-nut output, acreage, and trade from sources such as USDA-NASS, FAOSTAT, UN Comtrade, and the International Nut & Dried Fruit Council, then cross-checked price trends with American Pecan Council releases, IMF commodity dashboards, and customs tariffs. Company filings, investor decks, and news archived on Dow Jones Factiva and D&B Hoovers helped size processor revenues, while Volza shipment records indicated cross-border flow shifts. These examples illustrate the caliber of open and subscription datasets mined; many additional outlets were reviewed to round out the evidence base.
Market-Sizing & Forecasting
A unified top-down and bottom-up build was adopted. Production volumes were netted for post-harvest loss, export allocation, and stock variation to construct an apparent domestic consumption pool. Sampled processor sales (average selling price x volume) acted as a bottom-up reasonableness check. Key model drivers include bearing acreage expansions, mean yield per hectare, per-capita tree-nut intake, average export parity price, share of pecans entering ingredient channels, and tariff movements. Multivariate regression with scenario analysis projects these variables through 2030. Where granular bottom-up gaps emerged, we interpolated using region-specific price-elasticity bands discussed with experts.
Data Validation & Update Cycle
Every iteration is stress-tested through variance screens, peer reviews, and a last-minute news sweep before sign-off. Reports refresh annually and may receive mid-cycle tweaks if weather shocks, policy shifts, or trade disputes materially alter fundamentals.
Why Mordor's Pecan Benchmark Commands Reliability
Published figures vary because firms differ on whether they count derivative products, apply farm-gate or retail pricing, or refresh inputs after supply shocks.
Key gap drivers include competitor studies that fold pecan oil and flour into totals, apply optimistic processed-product ASPs, or carry forward pre-pandemic growth rates without recalibrating yield setbacks. In contrast, we limit scope to nut kernels, tie ASPs to customs data, and update acreage and tariff files every season.
Benchmark comparison
| Market Size | Anonymized source | Primary gap driver |
|---|---|---|
| USD 0.95 B (2025) | Mordor Intelligence | - |
| USD 2.02 B (2024) | Global Consultancy A | Includes pecan oil & flour; uses retail prices; limited post-2023 yield data |
| USD 0.88 B (2025) | Regional Consultancy B | Excludes food-service channel; applies fixed currency base; infrequent forecast refresh |
| USD 2.41 B (2024) | Industry Publisher C | Blends shelled and value-added snacks; aggressive CAGR from limited interviews |
Taken together, the comparison shows that Mordor's disciplined scope selection, frequent data refresh, and cross-method corroboration deliver a balanced, transparent baseline that decision-makers can trace back to clear variables and repeatable steps.


Key Questions Answered in the Report
What is the projected value of the pecan market in 2031?
The pecan market is projected to reach USD 1.80 billion by 2031.
Which region will grow fastest through 2031?
Asia-Pacific is forecast to post a 7.8% CAGR through 2031, owing to rising foodservice uptake and higher disposable incomes.
How did Chinese import patterns change in 2024?
Chinese buyers redirected about 75% of pecan procurement to South Africa, reducing imports from the United States and Mexico by 66%.
Why is production volatility a major concern?
Alternate-bearing cycles and weather events can double or halve output year to year, driving large price swings that complicate supply contracts.
Page last updated on:


