Market Overview
| Study Period | 2020 - 2031 |
|---|---|
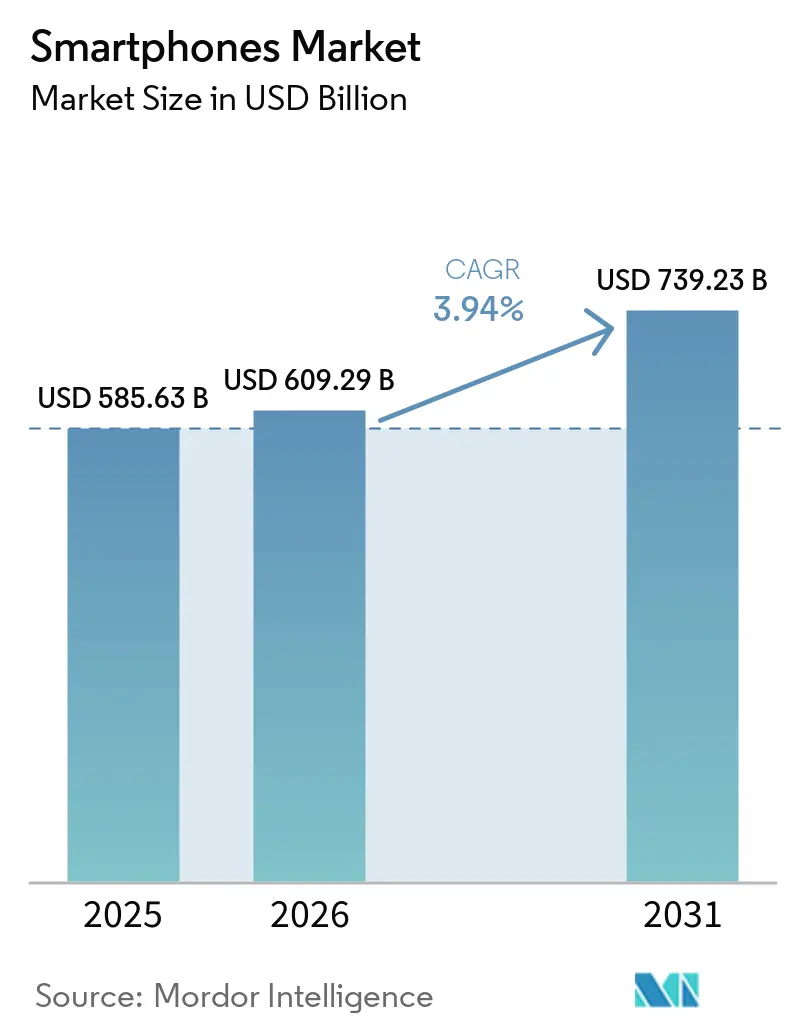
| Market Size (2026) | USD 609.29 Billion |
| Market Size (2031) | USD 739.23 Billion |
| Growth Rate (2026 - 2031) | 3.94% CAGR |
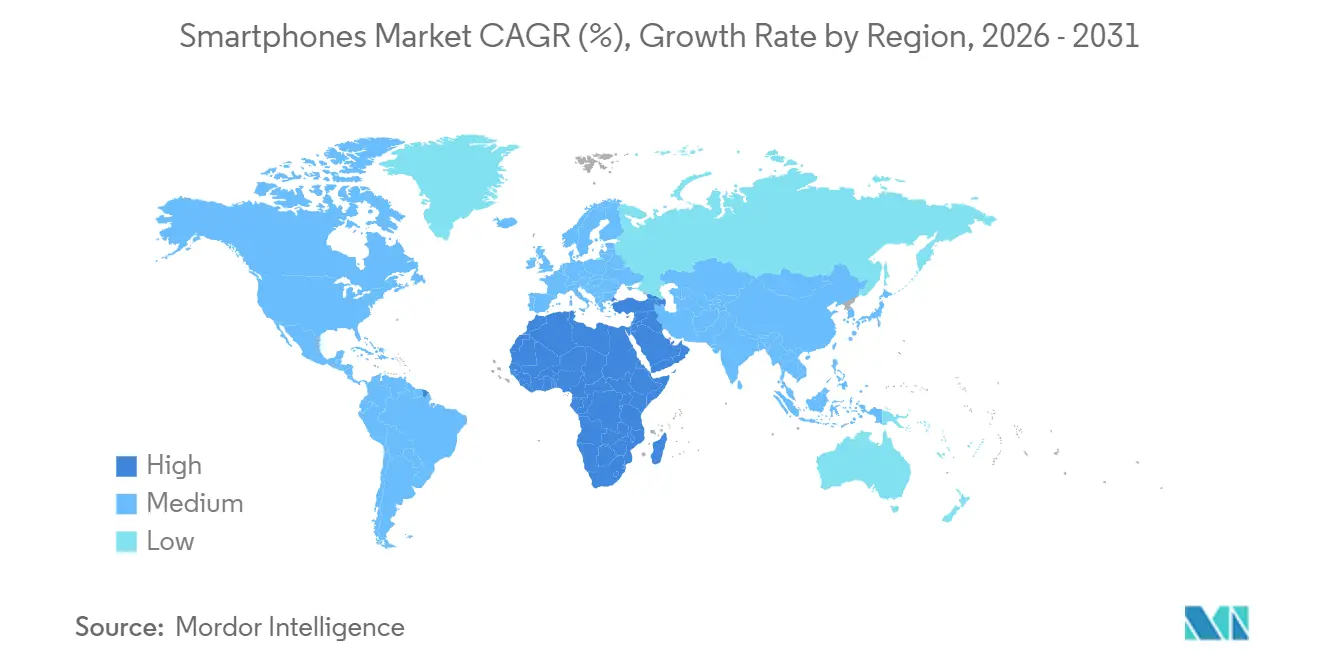
| Fastest Growing Market | Middle East |
| Largest Market | Asia Pacific |
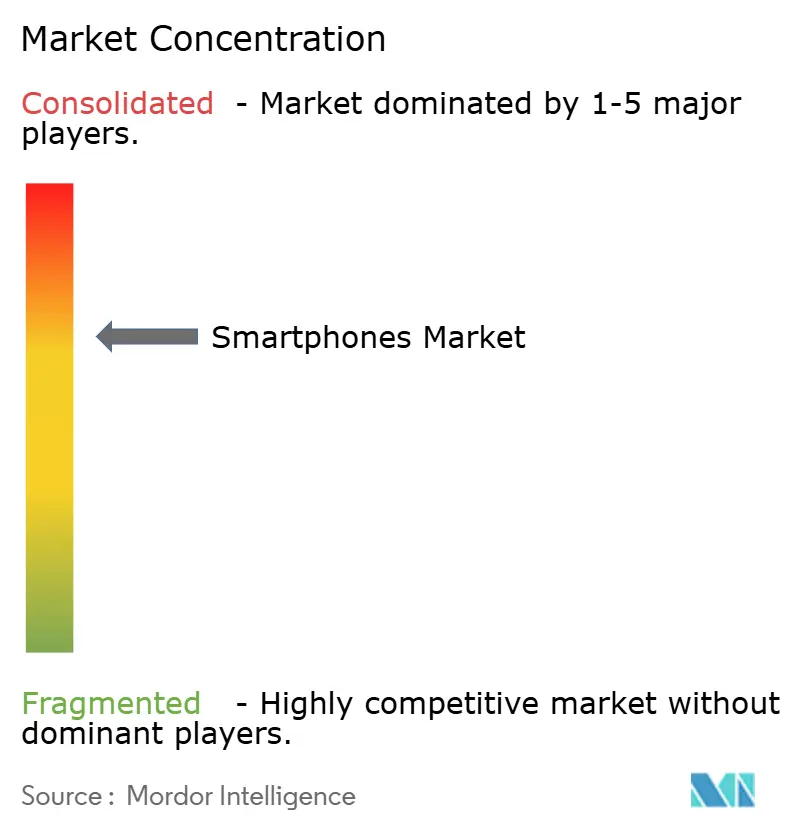
| Market Concentration | Medium |
Major Players *Disclaimer: Major Players sorted in no particular order Image © Mordor Intelligence. Reuse requires attribution under CC BY 4.0. | |
Smartphones Market Analysis by Mordor Intelligence
The Smartphones Market size is expected to grow from USD 585.63 billion in 2025 to USD 609.29 billion in 2026 and is forecast to reach USD 739.23 billion by 2031 at 3.94% CAGR over 2026-2031. In terms of shipment volume, the market was valued at 1.18 billion units in 2025 and is expected to grow from 1.21 billion units in 2026 to 1.35 billion units by 2031, at a CAGR of 2.21% during the forecast period (2026-2031). Premiumization, propelled by on-device generative AI and larger neural engines, is raising average selling prices even as shipments level off in mature economies. Brands are matching this hardware leap with longer software-support windows and zero-interest financing, which smooths upgrade cycles and sustains demand. Asia Pacific continues to anchor global volume, but the Middle East is emerging as the fastest-growing region as 5G networks reach critical density and high-income consumers gravitate toward ultra-premium flagships. Competitive intensity remains elevated, with Chinese vendors leveraging contract manufacturing in India and Vietnam to undercut incumbents on mid-range devices while Apple and Samsung protect the high end through proprietary silicon, vertically integrated displays, and ecosystem lock-in.
Key Report Takeaways
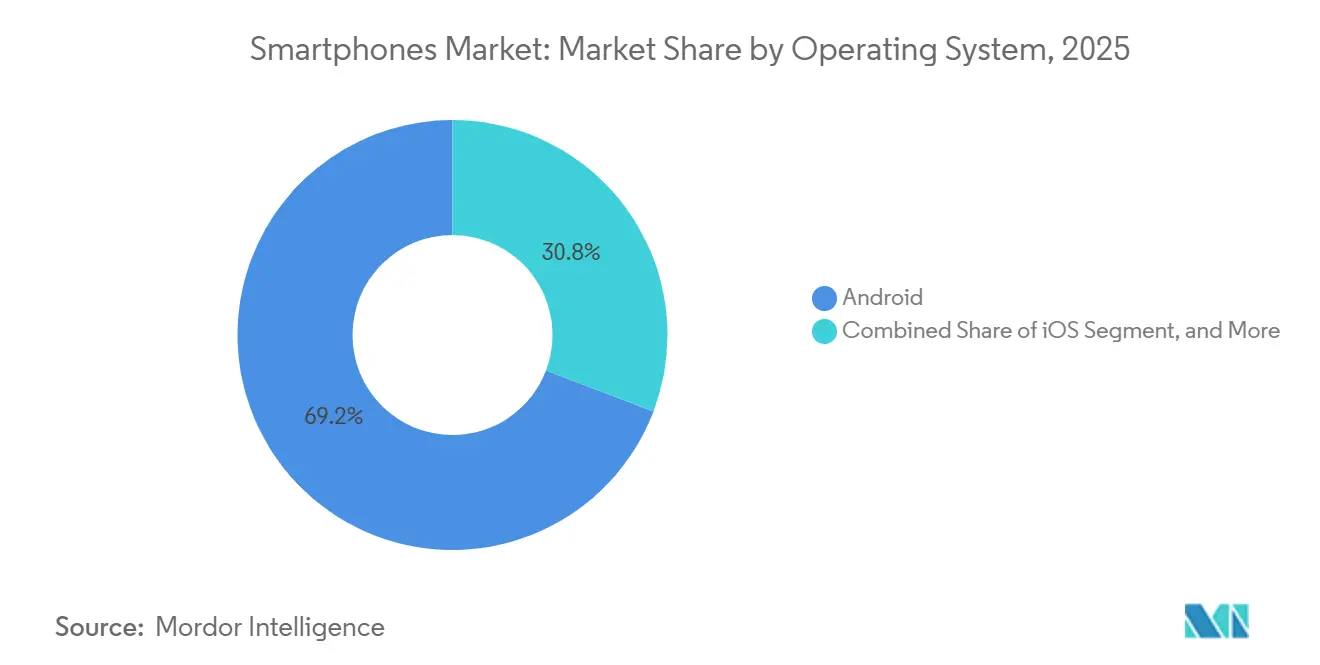
- By operating system, Android led with a 69.21% smartphones market share in 2025 while HarmonyOS and KaiOS together are set for the highest CAGR at 5.29% through 2031.
- By price band, mid-range devices captured 45.11% of revenue in 2025 whereas the ultra-premium tier above USD 800 is forecast to expand at a 6.42% CAGR to 2031.
- By technology, 5G accounted for 57.43% of shipments in 2025 and is advancing at a 4.54% CAGR through 2031.
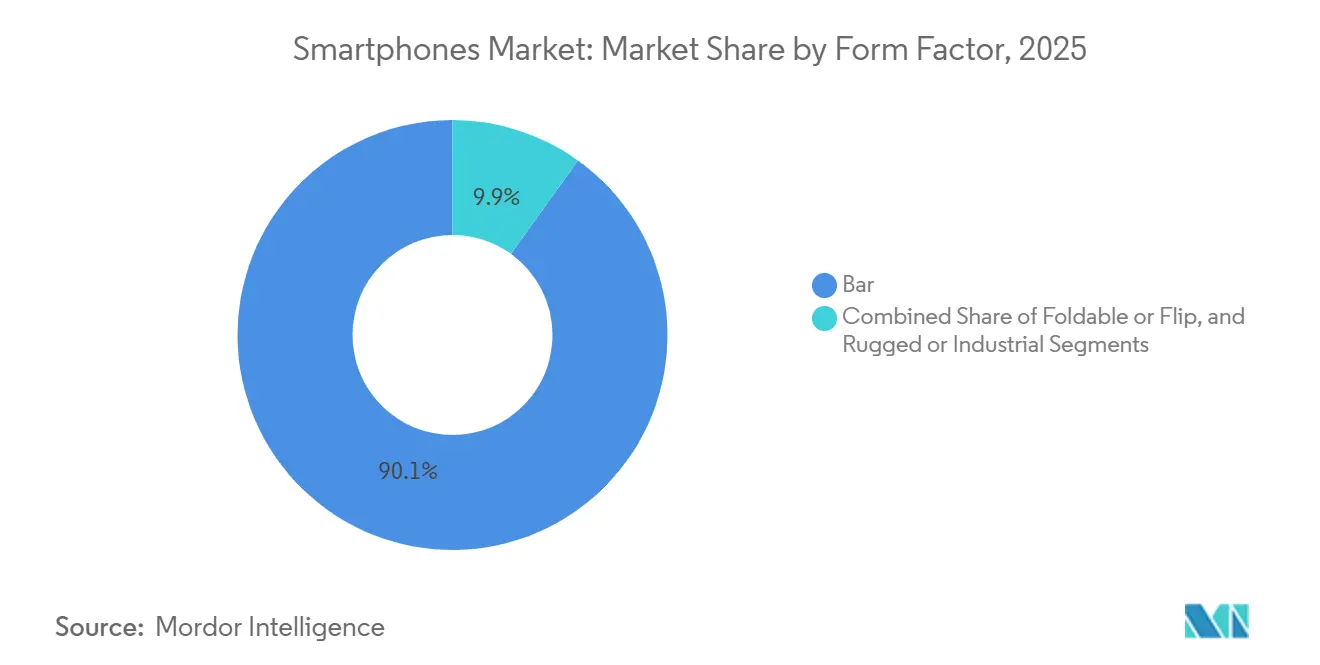
- By form factor, bar-style models controlled 90.07% of shipments in 2025, but foldables and flips are poised for 5.03% CAGR growth to 2031.
- By distribution channel, online direct-to-consumer captured 36.32% of 2025 sales and is expanding at a 5.57% CAGR to 2031.
- By end user, consumer devices represented 79.92% of revenue in 2025, while enterprise and SME adoption is rising at a 4.71% CAGR through 2031.
- By geography, Asia Pacific commanded 42.81% of the smartphones market revenue in 2025, yet the Middle East is projected to lead regional growth with a 10.83% CAGR to 2031.
Note: Market size and forecast figures in this report are generated using Mordor Intelligence’s proprietary estimation framework, updated with the latest available data and insights as of January 2026.
Global Smartphones Market Trends and Insights
Drivers Impact Analysis*
| Driver | (~) % Impact on CAGR Forecast | Geographic Relevance | Impact Timeline |
|---|---|---|---|
| AI-Enabled Upgrade Cycle Accelerates Replacements | +1.2% | North America, Europe, premium Asia Pacific | Medium term (2-4 years) |
| Premiumization Sustained by Financing, Trade-Ins, and Extended Software Support | +0.9% | North America, Europe, urban Asia Pacific | Long term (≥ 4 years) |
| Entry-Level 5G Proliferation in Emerging Markets | +0.8% | Asia Pacific, Middle East, and Africa | Short term (≤ 2 years) |
| Foldable Maturation Expands High-Value Niches | +0.5% | North America, Europe, China, South Korea | Medium term (2-4 years) |
| Carrier-Led Promotions and Device Financing in Mature Markets | +0.4% | North America, Europe | Short term (≤ 2 years) |
| Regional Manufacturing Localization Incentives Reduce Costs and Lead Times | +0.6% | India, Vietnam, Middle East, and Africa | Long term (≥ 4 years) |
| Source: Mordor Intelligence | |||
AI-Enabled Upgrade Cycle Accelerates Replacements
On-device generative AI, now capable of more than 40 trillion operations per second, has become a headline feature in flagship launches. Apple’s A18 Pro and Qualcomm’s Snapdragon 8 Elite showcase neural engines that deliver real-time translation, image synthesis, and personal-assistant tasks without cloud latency. In North America and Europe, this capability shortened replacement cycles in the smartphones market, as 38% of surveyed users in 2025 cited AI as their primary upgrade trigger.[1]Deloitte Insights, “2025 Global Mobile Consumer Survey,” deloitte.com Premium buyers perceive tangible day-to-day benefits, such as instant meeting summaries and on-device photo editing, which reinforce a willingness to pay flagship pricing. Chinese vendors are responding quickly: MediaTek’s Dimensity 9400 delivers a 30% power-efficiency gain for multimodal assistants, making AI a cross-platform baseline.[2]MediaTek Inc., “Dimensity 9400 Announcement,” mediatek.com The arms race is likely to persist through 2029 as chipmakers chase ever-larger parameter models optimized for handset thermals.
Premiumization Sustained by Financing, Trade-Ins, and Extended Software Support
Zero-interest installment plans and aggressive trade-in credits are shifting consumer focus from upfront cost to monthly affordability. U.S. carriers now stretch payments over 36 months, effectively turning a USD 1,200 flagship into a USD 33 obligation, while Apple processed more than 12 million trade-ins in 2024 that shaved up to USD 500 off the sticker price. Seven-year update pledges from Samsung and Google further lower total cost of ownership, reassuring buyers that premium models will stay secure and current well past typical refresh cycles. Together, these mechanisms keep premium demand in the smartphones market resilient even during macro softness and funnel more revenue into higher ASP tiers. Emerging markets are beginning to mirror this behavior as local banks and fintechs roll out installment-based handset loans.
Entry-Level 5G Proliferation in Emerging Markets
Sub-USD 200 5G smartphones are unlocking volume growth in the smartphones market where price elasticity is high. Xiaomi’s Redmi Note 13 5G debuted in India at INR 16,999 (USD 205) and quickly climbed sales charts, while Transsion raised the 5G mix of its Africa shipments from 8% in 2023 to 22% in 2024. Governments have amplified the trend; India’s Production-Linked Incentive program subsidizes local assembly, trimming duties and logistics costs. GSMA projects Sub-Saharan 5G connections will reach 100 million by 2030, signaling room for further handset upgrades. For brands, first-time 5G buyers create a funnel for future upselling once networks monetize value-added services.
Foldable Maturation Expands High-Value Niches
Hinge durability now exceeds 200,000 cycles, crease visibility has narrowed by a quarter, and prices are retreating as volumes scale. Samsung’s Galaxy Z Fold 6 and OPPO’s Find N3 eliminated earlier ergonomic compromises, encouraging power users to adopt the form factor for multitasking and document editing. Google’s Pixel Fold extends the proposition with adaptive UI that fluidly resizes apps when the device opens or closes. Foldables still trail bar phones on economies of scale within the smartphones market, yet production costs fell 18% in 2024, hinting at broader addressability over the forecast. Early adopters skew toward professionals and content creators, supporting a price premium that lifts average revenue per unit even as foldables remain a single-digit share of total shipments.
Restraints Impact Analysis*
| Restraint | (~) % Impact on CAGR Forecast | Geographic Relevance | Impact Timeline |
|---|---|---|---|
| Memory Supply Tightness Lifts BoM Costs, Pressuring Low-End Android | -0.7% | Asia Pacific, Middle East, and Africa | Short term (≤ 2 years) |
| Used or Refurbished Smartphone Growth Cannibalizes New Device Demand | -0.5% | North America, Europe, urban Asia Pacific | Medium term (2-4 years) |
| Slower Refresh Cycles from Durability and Incremental Innovation | -0.4% | Global | Long term (≥ 4 years) |
| Geopolitics and Tariffs Shifting SKUs, Raising Logistics Complexity | -0.3% | United States-China corridors | Medium term (2-4 years) |
| Source: Mordor Intelligence | |||
Memory Supply Tightness Lifts BoM Costs
DRAM spot prices climbed roughly 20% in late 2024 as wafer capacity was diverted to high-bandwidth server modules.[3]Micron Technology, “Fiscal Q1 2025 Earnings Call,” micron.com Samsung and SK Hynix prioritized automotive and data-center customers, leaving mobile LPDDR shortfalls that forced entry-level Android vendors to dial back memory configurations. In price-sensitive markets, a USD 10 increase pushes buyers toward 4 GB variants or even feature phones, eroding volume forecasts. Component inflation also squeezes razor-thin gross margins, prompting some tier-two brands to postpone launches or bundle fewer accessories. Relief is unlikely before mid-2026 when new fabs ramp, keeping pressure on low-end ASPs across the smartphones market and potentially widening the digital divide.
Used or Refurbished Smartphone Growth Cannibalizes New Device Demand
Certified refurbished programs from Apple, Samsung, and Back market are normalizing the purchase of a Used or Refurbished Smartphone among mainstream buyers, increasing consumer confidence in second-life devices. Apple sold millions of refurbished iPhones in 2024 at 15-20% discounts, while Back Market recorded a 42% jump in European sales.[4]Back Market, “2024 Sustainability Report,” backmarket.com-4 Extended software support means a three-year-old model remains performant, further diminishing urgency to buy new. Carriers, which once drove upgrades through subsidies, now lean on trade-in credits that feed the secondary channel and blunt first-sale volumes. The competitive upside is margin-friendly, refurbished devices preserve ecosystem lock-in and service revenue, but the restraint trims overall unit growth and drags headline smartphones market expansion.
*Our forecasts treat driver/restraint impacts as directional, not additive. The impact forecasts reflect baseline growth, mix effects, and variable interactions.
Segment Analysis
By Operating System: Android Dominance Faces Niche Erosion
Android retained 69.21% smartphones market share in 2025, yet HarmonyOS and KaiOS are growing at 5.29% annually, signaling gradual fragmentation. Huawei shipped more than 70 million HarmonyOS phones in 2024, fortifying a China-centric ecosystem that operates without Google services. KaiOS, powering ultra-low-cost devices, surpassed 150 million cumulative activations, introducing first-time internet users to app-based experiences. The smartphones market size for alternative platforms remains small today, but their trajectory challenges Android’s ubiquity in specific niches. Regulatory shifts, including the EU Digital Markets Act and India’s interoperability proposals, level the playing field by mandating third-party app stores and cross-platform messaging. As compliance costs rise, both iOS and Android may concede incremental share to regional or purpose-built platforms that promise data sovereignty or superior low-end performance.
Apple’s iOS meanwhile consolidates pricing power: fiscal 2024 iPhone revenue hit USD 200 billion, driven by Pro variants that anchor the ultra-premium tranche. Apple’s vertical integration of silicon, operating system, and services delivers a cohesive experience that justifies a USD 1,100 ASP, insulating iOS from price-based competition. For Android vendors, strategic responses include faster update pledges and tighter Google security certifications. Over the forecast, platform diversification in the smartphones market will hinge on localized regulation, app-store economics, and developer incentives rather than pure technological capability.


By Price Band: Ultra-Premium Surge Defies Macro Headwinds
Ultra-premium smartphones above USD 800 are projected to grow at 6.42% through 2031, outpacing every other tier. Flagships such as iPhone 16 Pro Max and Galaxy S25 Ultra integrate titanium frames, periscope lenses, and on-device AI that elevate perceived value. Trade-in credits and carrier financing reduce the effective purchase hurdle, drawing aspirational buyers into the segment. At the other extreme, entry-level models below USD 200 face BoM inflation and heightened competition from refurbished units, which narrows already thin margins.
Mid-range devices, priced USD 200-499, captured the bulk of 2025 revenue by offering 5G connectivity, multi-sensor cameras, and fast charging at palatable prices. Vendors use this band as a stepping stone, upselling via limited-time promotions or bundling accessories. Premium (USD 500-799) occupies a shrinking middle ground as consumers polarize toward either value or flagship experiences. The smartphones market size for mid-range will still expand, but the revenue mix will tilt toward ultra-premium where incremental hardware upgrades command outsized margins.
By Technology: 5G Becomes the New Baseline
The smartphones market size attributable to 5G devices reached 57.43% of shipments in 2025 and is climbing at a 4.54% CAGR as chipset prices fall and networks densify. Ericsson forecasts 5.6 billion 5G subscriptions by 2029, underscoring runway for device replenishment. Sub-USD 200 chipsets like Snapdragon 6 Gen 1 now integrate 5G modems, effectively erasing the cost delta with 4G. Operators are sunsetting 3G and reallocating spectrum, nudging laggards to adopt 5G-capable handsets. In urban corridors, millimeter-wave densification supports use cases such as cloud gaming and AR navigation, persuading early adopters to chase higher throughput.
4G devices remain relevant in rural zones, but their share will steadily retreat as carriers refarm spectrum and regulators auction additional mid-band frequencies. The International Telecommunication Union’s decisions at WRC-23 broadened global mid-band allocations, unlocking ample capacity for emerging markets. Consequently, every major vendor now positions 5G as table stakes, even on sub-USD 200 models, cementing the technology transition.
By Form Factor: Foldables Gain Traction Beyond Early Adopters
Foldables smartphones and flips phones are set for 5.03% CAGR growth as production costs decline and hinge reliability improves. Samsung’s latest hinge architecture reduces crease depth by 25%, while OPPO’s waterdrop hinge eliminates visible gaps, enhancing pocketability. Google’s tensor-driven adaptive UI demonstrates software maturation that maximizes the larger canvas during multitasking. These improvements expand the addressable audience from tech enthusiasts to mobile professionals who value split-screen document editing and video conferencing.
Bar-style smartphones still dominate due to manufacturing scale and consumer familiarity, but incremental differentiation is thinning. As vendors exhaust avenues for substantive hardware upgrades in slab designs, foldables become a clear premium upsell path that supports higher ASPs and reinforces brand halo effects. Rugged and industrial handsets remain a niche yet lucrative segment serving logistics, construction, and public-safety verticals with MIL-STD durability and enhanced ingress protection.
By Distribution Channel: Direct-to-Consumer Models Reshape Retail
Online direct-to-consumer captured 36.32% of sales in 2025 and is growing at 5.57% CAGR, making it the fastest channel. Brands bypass carrier subsidies and capture richer margins while mining customer data for targeted cross-selling. Apple, Xiaomi, and Samsung fuel the trend with exclusive online launches, trade-in offers, and bundled services. Lower logistics costs and faster fulfillment have increased consumer comfort with high-value e-commerce purchases, even in emerging markets where cash-on-delivery was once dominant.
Carrier stores still matter in North America and Europe, but foot traffic is declining as consumers research devices online and favor unlocked models that enable operator switching. Multi-brand retailers pivot toward experience-centric showrooms, emphasizing services such as device setup and accessory upselling. Brand-owned physical stores double as marketing theaters, reinforcing ecosystem stickiness through workshops, repair desks, and software demos.
By End User: Enterprise Adoption Accelerates on Security
Enterprise and SME demand, while only 20.08% of revenue in 2025, is advancing at 4.71% CAGR due to mobile-first workflows and security certifications. Samsung’s Knox platform and Apple’s secure enclave meet stringent compliance metrics, attracting sectors like finance and healthcare that require hardware-rooted encryption. Zero-touch enrollment and over-the-air provisioning reduce IT overhead, encouraging bulk deployments. Ruggedized variants with glove-compatible touchscreens and long-life batteries see uptake in field services and logistics. Government mandates for domestic assembly in India and similar sovereignty clauses elsewhere further boost enterprise procurement of locally made devices.
Longer refresh cycles, three to four years, temper annual unit purchasing but raise accessory and support revenue opportunities. As enterprises transition legacy applications to cloud-based SaaS, smartphones evolve from communication tools into primary computing nodes, strengthening the case for higher-spec devices with extended security patches.

Geography Analysis
Asia Pacific retained leadership with 42.81% of 2025 revenue, driven by China’s vast installed base and India’s manufacturing momentum. China’s shift to domestically designed silicon, exemplified by Huawei’s Mate 60 Pro, is steering premium buyers toward local brands, while India’s Production-Linked Incentive scheme attracted USD 15 billion in cumulative handset investment, scaling export capacity and lowering global ASPs.
North America’s upgrade cadence relies on carrier financing that conceals flagship prices. Apple captured over half of the U.S. premium segment in 2025, aided by trade-in credits, while Samsung boosted pre-orders 15% year-over-year with Galaxy S25 incentives. Canada and Mexico echo similar dynamics, balancing premium demand in metro areas with mid-range uptake in less affluent regions.
Europe’s market remains fragmented: Germany and France highlight data-privacy features, whereas the United Kingdom leans on carrier deals that bundle unlimited data. The Digital Markets Act may reshape app-store economics, creating openings for regional players and alternative payment systems.
South America’s growth hinges on Brazil’s localized production, where Lenovo-owned Motorola commands share through mid-range devices adapted to local spending power. Currency volatility complicates pricing, yet 5G deployments in major cities stimulate replacement demand.
The Middle East leads forecast growth at a 10.83% CAGR. High disposable incomes in Saudi Arabia and the United Arab Emirates, coupled with government digitalization agendas, lift premium device sales. Operators accelerate mmWave rollouts, supporting AR tourism guides and enterprise IoT pilots that require flagship-grade smartphones.
Africa’s market remains fiercely price sensitive, dominated by Transsion brands optimized for dual-SIM use and long battery life. 5G spectrum auctions in Nigeria and Kenya will spur gradual upgrades, but affordability constraints keep entry-level and refurbished devices prominent in the near term.

Competitive Landscape
Apple and Samsung together account for about 40% of global revenue, yet face erosion from cost-aggressive Chinese vendors. Apple’s USD 200 billion iPhone haul in 2024 underscores its grip on the ultra-premium tier through proprietary silicon, services, and device-to-device ecosystem linkage. Samsung counters with display prowess and a broad portfolio spanning USD 150 to USD 1,300, reinforced by seven-year update commitments that rival Apple’s longevity.
Xiaomi, OPPO, and vivo exploit contract manufacturing in India and Vietnam to underprice incumbents, particularly in mid-range and upper-mid tiers. Transsion dominates Africa with more than 45% share by embedding localized features and leveraging deep rural distribution. Disruptors such as Nothing Technology differentiate via transparent aesthetics and near-stock Android, appealing to Gen-Z cohorts.
R&D races revolve around neural processing units exceeding 45 TOPS, periscope cameras enabling 10x optical zoom, and satellite messaging for emergency coverage. Patent cross-licensing and standards disputes add legal overhead, but also serve as defensive moats for incumbents that own essential 5G IP. Overall, the smartphones market exhibits moderate concentration and intensifying feature-based competition that pivots on AI and foldable innovation.
Smartphones Industry Leaders
Samsung Electronics Co. Ltd
Apple Inc.
Xiaomi Corp.
OPPO (incl. OnePlus)
Vivo Communication Technology Co., Ltd.
- *Disclaimer: Major Players sorted in no particular order

Recent Industry Developments
- January 2025: Samsung launched the Galaxy S25 series with Snapdragon 8 Elite, Galaxy AI, and seven-year updates, driving a 15% pre-order uplift.
- January 2025: Apple expanded its Foxconn partnership in India by USD 500 million to prepare iPhone 17 production for export.
- December 2024: Xiaomi introduced the 14 Ultra globally at EUR 1,499 (USD 1,636), its most aggressive European flagship push.
- November 2024: OPPO began international sales of the Find N3 foldable at USD 1,699, featuring a gapless waterdrop hinge.


Research Methodology Framework and Report Scope
Market Definitions and Key Coverage
Our study defines the smartphone market as all brand-new, factory-assembled handsets that combine cellular voice, an advanced mobile operating system, and internet-enabled multimedia features. Devices counted must ship with integrated app stores and support for over-the-air software updates.
Scope Exclusions: Ruggedized industrial handsets and second-hand or refurbished units are kept outside the model.
Segmentation Overview
- Overall Market Estimates
- Total Market Value (USD)
- Total Market Volume (Units)
- By Operating System (Value, and Volume)
- Android
- iOS
- Others (HarmonyOS, KaiOS)
- By Price Band (Value, and Volume)
- Entry-Level (Less Than USD 200)
- Mid-Range (USD 200-499)
- Premium (USD 500-799)
- Ultra-Premium (More Than USD 800)
- By Technology (Network Generation) (Value)
- 5G
- 4G or LTE
- 3G and Below
- By Form Factor (Value)
- Bar
- Foldable or Flip
- Rugged or Industrial
- By Distribution Channel (Value)
- Operator or Carrier Stores
- Brand-Owned Retail
- Multi-Brand Physical Retail
- Online Direct-to-Consumer
- By End User (Value)
- Consumer or Individual
- Enterprise or SME
- Public Sector or Government
- By Geography (Value)
- North America
- United States
- Canada
- Mexico
- South America
- Brazil
- Argentina
- Chile
- Colombia
- Rest of South America
- Europe
- Germany
- France
- United Kingdom
- Italy
- Spain
- Russia
- Rest of Europe
- Asia-Pacific
- China
- India
- Japan
- South Korea
- Southeast Asia (Singapore, Thailand, Indonesia, Vietnam, Philippines, Malaysia)
- Australia
- Rest of Asia-Pacific
- Middle East
- Saudi Arabia
- United Arab Emirates
- Rest of the Middle East
- Africa
- South Africa
- Nigeria
- Rest of Africa
- North America
Detailed Research Methodology and Data Validation
Primary Research
Mordor analysts interview mobile operators, component suppliers, national distributors, and retail chains across Asia-Pacific, the Americas, Europe, and the Middle East and Africa. These conversations test replacement-cycle assumptions, promotional pricing trends, and upcoming 5G or AI-centric model mixes, enabling us to refine demand elasticity and regional mix factors.
Desk Research
We start by extracting shipment and installed-base signals from open datasets such as ITU regulator statistics, GSMA Intelligence subscriber counts, and the Ericsson Mobility Report, which together map the active user pool. Consumer-price and income series from the World Bank and IMF help us gauge affordability, while UN Comtrade tariff codes clarify cross-border handset flows. Corporate filings, investor decks, and reputable tech media add SKU-level launch, ASP, and channel insights. Paid databases like D&B Hoovers and Dow Jones Factiva complement these inputs with company-level revenue splits. The named sources illustrate our approach; many additional references were reviewed during validation.
Market-Sizing and Forecasting
A top-down build converts 5G and 4G subscriber additions into potential demand pools, which are then reconciled with shipment tallies and ASP trajectories to reach the baseline. Select bottom-up checks, such as sampled OEM revenue roll-ups and channel stock audits, anchor the totals. Key variables tracked include carrier 5G adoption rates, median replacement cycles, real GDP per capita, semiconductor bill-of-materials price indices, and promotional ASP movements. Multivariate regression links these indicators to annual value growth, while scenario analysis captures shocks like component shortages. Data gaps in bottom-up samples are patched using regional ASP proxies vetted with our primary respondents.
Data Validation and Update Cycle
Outputs pass variance checks against independent shipment trackers and macro indicators before multi-analyst reviews sign off. Reports refresh yearly, and we issue mid-cycle updates if material events, such as currency swings, trade bans, or pandemic waves, shift the outlook. A final pre-publication sweep ensures clients always receive the latest view.
Why Mordor's Smartphone Baseline Inspires Confidence
Published market values often diverge because firms vary their scope choices, discount assumptions, and refresh cadence.
Key gap drivers include differences in price-band coverage, treatment of gray-market online sales, and how promotional discounts alter effective ASPs, all of which Mordor addresses through its disciplined scope mapping and annual data resets.
Benchmark comparison
| Market Size | Anonymized source | Primary gap driver |
|---|---|---|
| USD 585.63 B (2025) | Mordor Intelligence | |
| USD 537.62 B (2025) | Regional Consultancy A | Narrower price-band scope and biennial updates |
| USD 578.46 B (2025) | Global Consultancy B | Excludes gray-market e-commerce sales; list-price ASPs only |
These comparisons show that when scope breadth, variable selection, and timely validation are aligned, as in Mordor's approach, decision-makers gain a transparent, reproducible baseline they can trust.


Key Questions Answered in the Report
What is the current value of the global smartphones market?
The smartphones market size stood at USD 609.29 billion in 2026.
Which region will grow fastest through 2031?
The Middle East is forecast to post the highest regional CAGR at 10.83% through 2031.
How quickly is the 5G segment expanding?
Shipments using 5G technology are advancing at a 4.54% CAGR, already representing 57.43% of 2025 volume.
Why are ultra-premium smartphones gaining share despite economic headwinds?
Trade-in credits, long software-support windows, and zero-interest financing lower upfront barriers, supporting a 6.42% CAGR for devices above USD 800.
How long are vendors now supporting software updates?
Leading brands such as Samsung and Google commit to seven years of Android and security patches on flagship models.
What role does on-device AI play in upgrade decisions?
In North America and Europe, 38% of 2025 survey respondents cited AI features as their main reason to buy a new handset, up sharply from 2023.
Page last updated on:


