Wearable Injectors Market Size and Share
Market Overview
| Study Period | 2020 - 2031 |
|---|---|
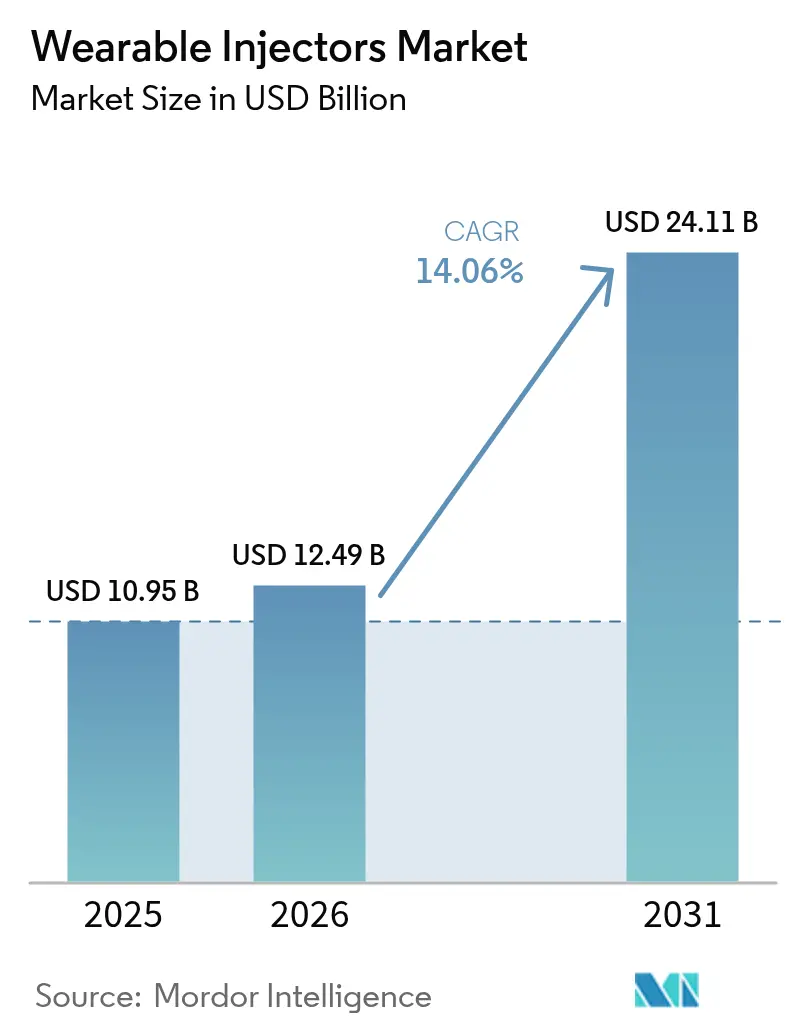
| Market Size (2026) | USD 12.49 Billion |
| Market Size (2031) | USD 24.11 Billion |
| Growth Rate (2026 - 2031) | 14.06% CAGR |
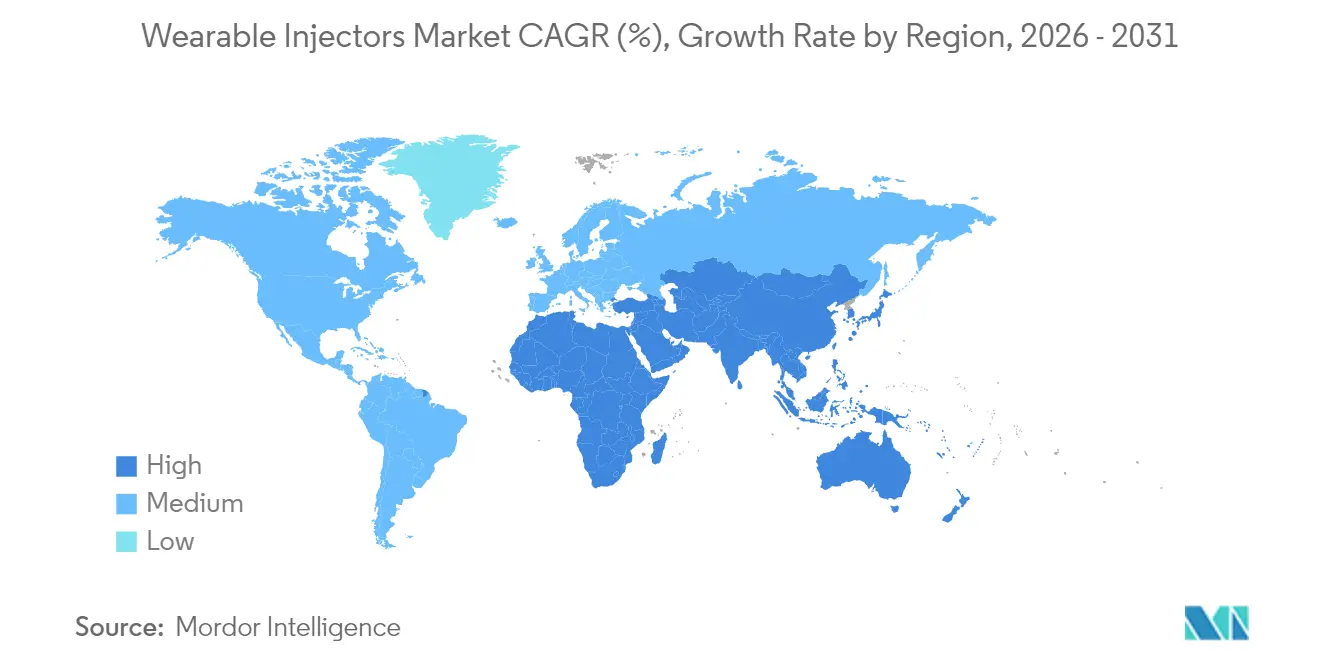
| Fastest Growing Market | Asia Pacific |
| Largest Market | North America |
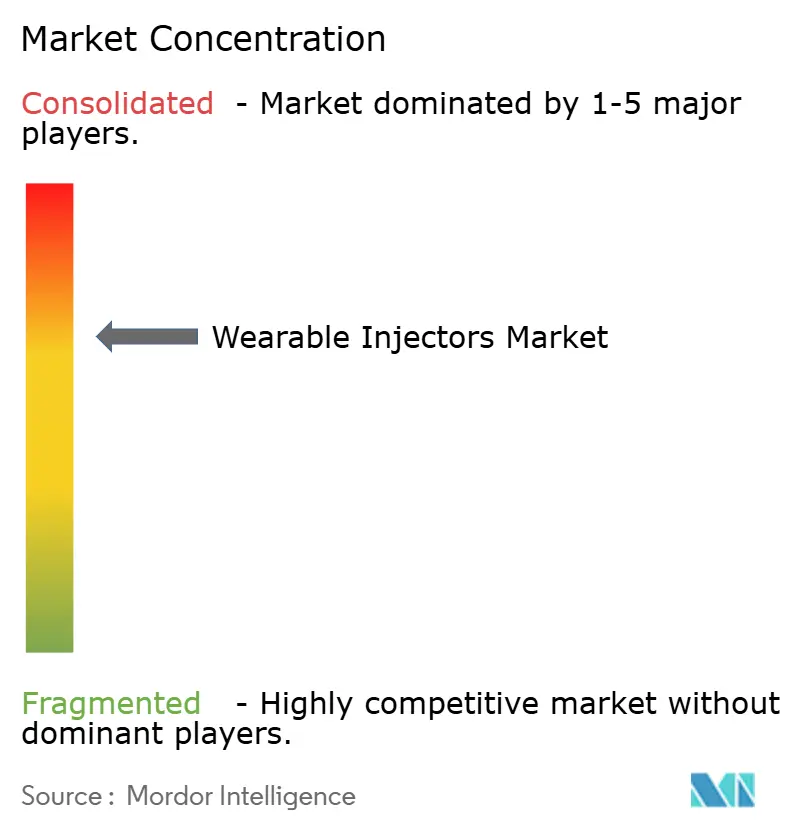
| Market Concentration | Medium |
Major Players *Disclaimer: Major Players sorted in no particular order Image © Mordor Intelligence. Reuse requires attribution under CC BY 4.0. | |
Wearable Injectors Market Analysis by Mordor Intelligence
Wearable Injectors Market size in 2026 is estimated at USD 12.49 billion, growing from 2025 value of USD 10.95 billion with 2031 projections showing USD 24.11 billion, growing at 14.06% CAGR over 2026-2031.
The surge is anchored in rising biologics approvals, an expanding global chronic-disease population, and the healthcare sector’s pivot to patient-centric, home-based care models. Device makers are prioritizing connected platforms, high-viscosity capability, and user-friendly designs to support self-administration trends. Pharmaceutical companies leverage these devices to improve adherence, shorten infusion times, and lower hospital utilization, while payers increasingly reimburse for home infusion to curb care costs. Competitive intensity is set by established med-tech firms partnering with drug manufacturers, yet supply-chain constraints in specialty polymers and battery-life sustainability challenge near-term scaling.
Key Report Takeaways
- By product type, on-body patch injectors led with 60.98% of wearable injectors market share in 2025; smart injectors are forecast to expand at a 15.65% CAGR through 2031.
- By therapy area, oncology accounted for 33.28% of the wearable injectors market size in 2025, while rare and orphan diseases are projected to grow at 17.05% CAGR to 2031.
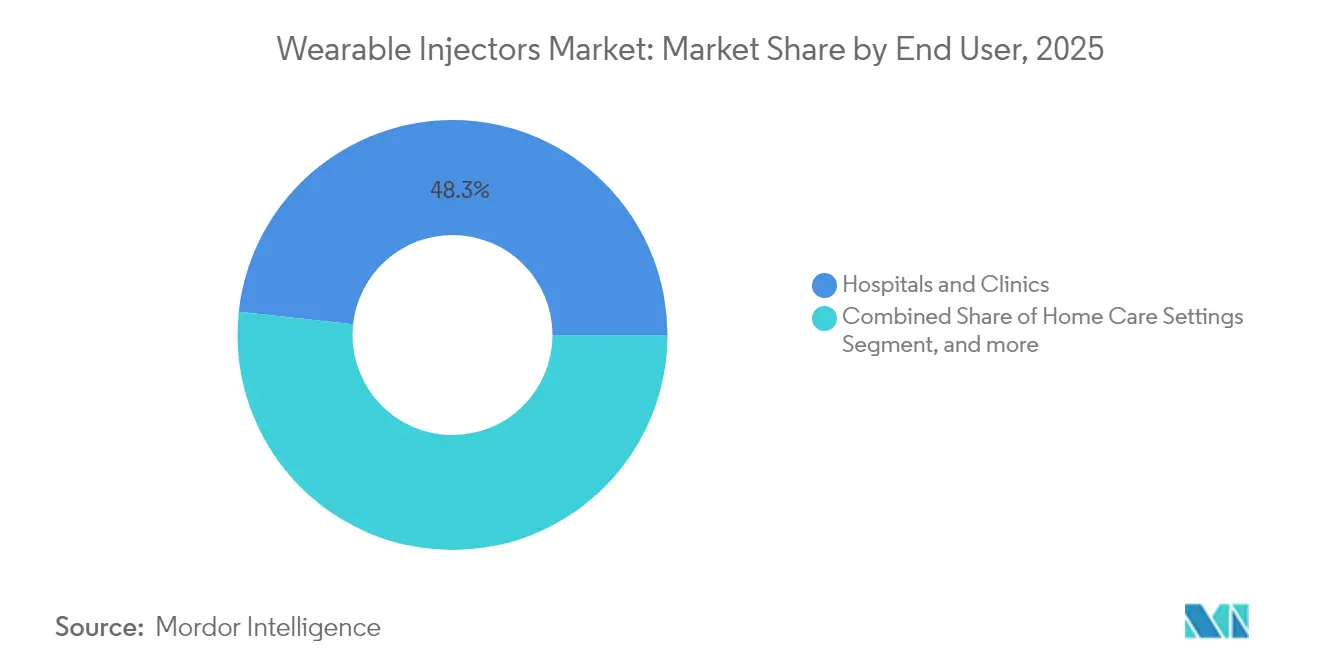
- By end user, home-care settings captured 51.72% revenue in 2025; specialty infusion centers are poised for the fastest growth at 14.48% CAGR through 2031.
- By geography, North America commanded 42.78% share of the wearable injectors market in 2025; Asia-Pacific is set to register the highest CAGR of 14.79% between 2026-2031.
Note: Market size and forecast figures in this report are generated using Mordor Intelligence’s proprietary estimation framework, updated with the latest available data and insights as of 2026.
Global Wearable Injectors Market Trends and Insights
Drivers Impact Analysis*
| Driver | (~) % Impact on CAGR Forecast | Geographic Relevance | Impact Timeline |
|---|---|---|---|
| Growing Prevalence of Chronic Diseases | +3.2% | Global, with highest impact in North America and Europe | Long term (≥ 4 years) |
| Technological Advancements in Wearable Injector Platforms | +2.8% | North America & EU leading, APAC adoption accelerating | Medium term (2-4 years) |
| Shift Toward Home-Based Treatment & Self-Administration | +2.5% | Global, particularly strong in developed markets | Medium term (2-4 years) |
| Rising Pipeline of Biologics & Large-Molecule Drugs | +2.1% | Global, with concentration in US and European markets | Long term (≥ 4 years) |
| Micro-MEMS Enabling High-Viscosity Formulation Delivery | +1.8% | Global, led by technology hubs in US, Germany, Japan | Long term (≥ 4 years) |
| Payer Adoption of Digital Adherence Analytics | +1.4% | North America & EU, gradual APAC penetration | Medium term (2-4 years) |
| Source: Mordor Intelligence | |||
Growing Prevalence of Chronic Diseases
Diabetes affected 536.6 million adults worldwide in 2021 and is projected to reach 783.2 million by 2045, underpinning sustained demand for automated delivery systems that can manage polypharmacy outside hospital settings. Multi-morbidity affects 27.1% of US adults, up from 21.8% a decade earlier, amplifying the need for connected injectors that track complex dosing schedules.[1]Centers for Disease Control and Prevention, “National Center for Chronic Disease Prevention Data,” cdc.gov These trends position the wearable injectors market as a critical enabler of chronic disease management by reducing clinic visits, improving adherence, and elevating patient quality of life.
Technological Advancements in Wearable Injector Platforms
Micro-MEMS innovations now push high-viscosity biologics above 15 cP through slender cannulas, enabling on-body systems to deliver 10 mL volumes without patient discomfort. Real-time connectivity, automatic needle retraction, and IoT analytics refine dosing accuracy and generate adherence data for payers and clinicians. FDA draft guidance on essential drug-delivery outputs establishes performance benchmarks that accelerate device clearances.[2]U.S. Food & Drug Administration, “Draft Guidance for Industry: Essential Performance Requirements for Combination Products,” fda.gov Piezoelectric micropumps attaining 4 mL/min flow at 35.7 kPa further illustrate the precision gains that are reshaping the wearable injectors market.
Shift Toward Home-Based Treatment & Self-Administration
The FDA’s 2025 approval of Onapgo, a wearable subcutaneous infusion device for advanced Parkinson’s disease, validated complex therapies in home settings by reducing OFF-time markedly versus placebo. Payer surveys reveal 90% consider wearable injectors address unmet needs and 82% would reimburse premiums for their use. Virtual-reality and smartphone tutorials now streamline patient training, making self-management feasible for broader demographics.
Rising Pipeline of Biologics & Large-Molecule Drugs
Biologics comprised a rising share of the record 71 US FDA drug approvals in 2023, magnifying demand for large-volume subcutaneous delivery platforms.[3]Nature Biotechnology Editors, “New Drug Approvals 2023,” nature.com On-body solutions such as Stevanato Group’s Vertiva 10 mL system tailor flow rates and needle lengths to match therapy profiles. Subcutaneous amivantamab, administered in under five minutes, illustrates how wearable platforms shrink infusion windows from hours to minutes, enhancing patient convenience.
Restraints Impact Analysis*
| Restraint | (~) % Impact on CAGR Forecast | Geographic Relevance | Impact Timeline |
|---|---|---|---|
| Preference for Alternative Drug-Delivery Modes | -1.8% | Global, stronger in traditional healthcare systems | Medium term (2-4 years) |
| Unfavorable Reimbursement in Developing Nations | -1.5% | APAC, Latin America, Africa | Long term (≥ 4 years) |
| Battery-Life & E-Waste Disposal Concerns | -1.2% | Global, heightened in environmentally conscious markets | Short term (≤ 2 years) |
| Shortage of Specialty Polymers for Injector Housings | -0.9% | Global supply chain impact, concentrated in manufacturing hubs | Short term (≤ 2 years) |
| Source: Mordor Intelligence | |||
Preference for Alternative Drug-Delivery Modes
Hospital infusion centers still rely on traditional IV workflows that generate billable events, slowing transition to wearable injectors. Needle-free technologies such as InsuJet attract patients wary of self-injection, while oral biologic capsules from Rani Therapeutics could eventually bypass device-based delivery. These alternatives anchor provider inertia and temper the near-term growth of the wearable injectors market.
Unfavorable Reimbursement in Developing Nations
Medical devices account for only 3-6% of total healthcare spending across many Asia-Pacific economies, limiting funding for single-use wearables. Bundled payments often exclude separate reimbursement for injectors, raising out-of-pocket costs that deter adoption. Fragmented procurement channels and low digital readiness further dilute the perceived value of connected injector features.
*Our forecasts treat driver/restraint impacts as directional, not additive. The impact forecasts reflect baseline growth, mix effects, and variable interactions.
Segment Analysis
By Product Type: Smart Injectors Drive Innovation
Smart devices recorded the fastest 15.65% CAGR, buoyed by integrated sensors and mobile apps that furnish real-time adherence data to clinicians and payers. On-body patches remained dominant, controlling 60.98% of the wearable injectors market share in 2025, underpinned by entrenched use in diabetes therapy. High-volume injectors, often exceeding 5 mL, address bariatric biologics and cancer therapeutics, while off-body belt formats fill niche needs requiring prolonged wear and large reservoirs.
BD’s alliance with Ypsomed couples glass prefillable syringes with high-viscosity autoinjectors to deliver biologics over 15 cP viscosity, an advance aligning with pharma’s pipeline of dense formulations. Artificial-intelligence algorithms embedded in next-generation smart injectors personalize dosing intervals by analyzing glucose or biomarker feedback, improving outcomes, and cementing customer loyalty to specific device ecosystems.


By Therapy Area: Oncology Dominance Amid Rare-Disease Upside
Oncology commanded 33.28% of the wearable injectors market size in 2025 as subcutaneous monoclonal antibodies shorten chair time and release infusion suite capacity. Phase 3 data confirmed non-inferior outcomes for subcutaneous amivantamab with administration time cut to under five minutes, highlighting patient benefit.
Rare-disease therapies, though smaller in absolute volume, are poised for a 17.05% CAGR through 2031, as orphan-drug incentives spur biologic launches requiring precise, home-friendly delivery. The ability to schedule large-volume injections every three weeks empowers on-body systems to complement or replace intermittent clinic infusions, minimizing patient fatigue and transport costs.
By End User: Home-Care Settings Lead Transformation
Home care retained 51.72% revenue share in 2025, reflecting payer and patient endorsement of self-treatment that cuts facility overhead and infection risk. Specialty infusion centers, growing at 14.48% CAGR, function as transitional hubs that initiate therapy before shifting patients to home-based regimens. Hospitals remain crucial launch sites for high-risk oncology and immunology products that need first-dose monitoring.
Usability studies on on-body infusors logged 99.2% successful task completion across patients, caregivers, and clinicians, supporting the safety of decentralized models. FDA clearance of Enable Injections’ enFuse for pegcetacoplan further validates the migration of large-volume therapies into home settings, with 60% uptake among eligible patients within four months.
Geography Analysis
North America captured 42.78% of the wearable injectors market in 2025, undergirded by clear FDA regulatory pathways, entrenched healthcare connectivity, and a high burden of chronic disease. Insulet’s Omnipod platform alone exceeded 500,000 active users after posting 22% revenue growth in 2024, illustrating robust device adoption. Most payers now reimburse connected injectors that transmit adherence data into electronic health records, aligning incentives for self-administration.
Asia-Pacific is projected to register the swiftest 14.79% CAGR through 2031, propelled by middle-class expansion, government digital-health policies, and rising biologic launches. China and Japan spearhead volume demand and regulatory modernization, while India, Indonesia, and Thailand show accelerating uptake owing to chronic-disease prevalence and mobile-health penetration. Fragmented reimbursement and lower device-spending ratios, however, temper immediate scale-up.
Europe benefits from harmonized medical-device regulations that streamline cross-border approvals, ensuring predictable adoption in Germany, France, and the United Kingdom. National health systems emphasize patient-centric chronic-care pathways that incorporate connected injectors into integrated disease-management programs. Latin America and the Middle East & Africa hold latent potential but remain inhibited by infrastructure deficits and limited payer coverage, steering vendors toward tiered-pricing and public-private-partnership models to seed early demand.

Competitive Landscape
The wearable injectors market is moderately consolidated, with several large global companies holding significant shares. Conglomerates and specialized medical device companies dominate the market, focusing on innovation and product development. Major players in the wearable injectors market include Becton, Dickinson and Company, Insulet Corporation, Ypsomed, Tandem Diabetes Care, Inc., and Amgen. These companies are recognized for their strong R&D capabilities, driving product innovation and expanding market presence.
Connectivity, dosing precision, and patient comfort rather than basic injection mechanics define differentiation. FDA classification of on-body injectors as Class II devices under CFR 880.5 affords a clear review pathway, inviting newcomers who can satisfy human-factor and sterility mandates. Needle-free and oral biologic platforms loom as disruptive forces, compelling incumbents to incorporate AI-driven adherence analytics, sustainable power systems, and recyclable housings to sustain advantage. Supply-chain strain in specialty polymers and lithium cells places a premium on dual-sourcing strategies and circular-economy design.
Developers increasingly bundle wrap-around digital services ranging from virtual training to cloud dashboards to lock in customers and create data assets useful for post-market surveillance and value-based contracting. As biologic volumes rise, partnerships between device firms and CDMOs (contract development and manufacturing organizations) intensify, integrating primary-container expertise with electronic and mechanical subsystems to deliver turnkey solutions for pharmaceutical clients.
Wearable Injectors Industry Leaders
Becton, Dickinson and Company
Insulet Corporation
Ypsomed
Tandem Diabetes Care, Inc.
Amgen
- *Disclaimer: Major Players sorted in no particular order

Market Opportunities and Future Outlook
Ongoing IV-to-subcutaneous shifts for biologics and specialty therapies are creating a clear opportunity, particularly where combination-product programs move dosing into home care while still preserving clinical oversight through connected features. Recent commercialization and regulatory progress, including the US FDA approval of Sarclisa Escena administered via Enable Injections' enFuse on-body injector (July 2026), supports continued demand for large-volume, patient-worn delivery formats in oncology and other specialty indications where chair time and site-of-care costs remain a constraint.
A second opportunity is opening in manufacturing and scale-up capacity for drug-device combination products. Pharma companies and CDMOs are expanding integrated sterile fill-finish alongside device assembly to reduce launch risk and increase throughput: PCI Pharma Services announced investments exceeding USD 1 billion (April 2026) to expand sterile fill-finish and drug-device combination capabilities, including new autoinjector lines in Philadelphia and Rockford targeting 250 million units of annual capacity by 2027, while MGS opened a 300,000-square-foot facility in Richfield, Wisconsin (February 2026) with 140,000 square feet of Class 8 cleanrooms for complex drug-delivery device assembly. For device OEMs and pharma partners, these expansions increase the attractiveness of turnkey combination-product supply for high-viscosity, larger-volume subcutaneous formats (minutes to hours), alongside digital adherence analytics increasingly sought by payers in developed markets.
Recent Industry Developments
- July 2026: Sanofi announced the US FDA approval of Sarclisa Escena, a subcutaneous formulation administered via an on-body injector using Enable Injections' enFuse platform. The approval extends wearable injector use into anticancer therapy administration and supports broader IV-to-subcutaneous conversion strategies for high-value biologics.
- May 2026: Enable Injections announced CE Certification for the enFuse On-Body Delivery System for use with Aspaveli, to be distributed by Sobi in the European Union. The certification widens the platform's commercial footprint in Europe and adds a new reference program for combination-product deployments beyond the United States.
- October 2024: BD and Ypsomed announced a collaboration to advance self-injection systems for high-viscosity biologics. The work points to continued development across primary containers and delivery devices, with glass prefillable formats matched to injection systems designed for more challenging biologic formulations.


Research Methodology Framework and Report Scope
Market Definition and Coverage
This market covers wearable injector devices that are worn on the body or carried off-body to automatically deliver larger volume subcutaneous doses over a set time, mainly for biologics and other specialty drugs used outside a clinic setting.
Scope exclusions: We exclude conventional auto-injector pens and insulin-only tubed pump systems where the core function is continuous insulin infusion rather than scheduled large-volume delivery.
Segmentation Overview
- By Product Type
- On-body Patch Injectors
- Off-body Belt Injectors
- Smart Injectors
- High-volume (≥5 mL) Injectors
- By Therapy Area
- Oncology
- Autoimmune Disorders
- Diabetes
- Cardiovascular Diseases
- Rare & Orphan Diseases
- By End User
- Hospitals & Clinics
- Home Care Settings
- Specialty Infusion Centers
- By Geography
- North America
- United States
- Canada
- Mexico
- Europe
- Germany
- United Kingdom
- France
- Italy
- Spain
- Rest of Europe
- Asia-Pacific
- China
- Japan
- India
- Australia
- South Korea
- Rest of Asia-Pacific
- Middle East & Africa
- GCC
- South Africa
- Rest of Middle East & Africa
- South America
- Brazil
- Argentina
- Rest of South America
- North America
Data Sources, Market Sizing, and Validation
Desk Research
Desk work starts with public signals that show how the addressable patient pool and device adoption are moving. We mainly lean on sources such as the FDA and EMA for device clearances and safety notes, the US CDC and OECD for chronic disease and aging statistics, and the World Bank for health spend and macro context by region.
On top of that, we review company annual reports, investor presentations, and press releases to map product launches, manufacturing moves, and partnership announcements that can shift supply. Where helpful, we also use paid subscriptions for company financials and news, plus patent databases to understand design directions and feature cadence. These sources are not exhaustive, and many additional public references were used for data collection, validation, and clarification during the study.
Primary Interviews and Surveys
Primary inputs come from interviews and structured surveys with device manufacturers, component suppliers, drug-delivery experts, and buyers and clinicians involved in home administration programs. Since this is a global market, checks are run across APAC, EMEA, and the Americas, so assumptions around adoption timing, pricing movement, and therapy mix are not overly shaped by one region.
Distribution of primary research fieldwork respondents
| Company type | Respondent position | Region |
|---|---|---|
| Top tier: 33% | CXOs: 14% | APAC: 49% |
| Mid tier: 53% | Functional/Unit leaders: 30% | EMEA: 31% |
| Smaller Players: 14% | Managers: 56% | Americas: 20% |
Market-Sizing & Forecasting
Sizing is built using a top-down approach where the demand pool is reconstructed from treated cohorts and eligible therapies that are shifting toward large-volume subcutaneous administration, and then filtered through expected wearable usage rates by setting of care. To keep the totals realistic, we corroborate them with selective bottom-up checks such as sampled device ASPs by region, shipment and capacity signals discussed in interviews, and a few supplier and channel checks.
Key model inputs include the mix of therapy areas that most commonly use on-body and off-body delivery, the share of patients moving from infusion to home care, device replacement and single-use versus reusable patterns, typical fill-volume thresholds (for example, 2 mL and higher), and regional pricing and reimbursement signals that influence adoption speed. For forecasting, scenario analysis is used, supported by multivariate regression where uptake is linked to chronic disease prevalence, biologic pipeline momentum, and health system cost pressure. When bottom-up detail is missing for smaller countries, we use proxy ratios from similar markets and then adjust with expert feedback before finalizing the series.
Data Validation & Update Cycle
Validation is done by checking the model against independent markers, including therapy adoption signals, regulatory activity, and whether implied device volumes align with realistic manufacturing and distribution constraints. Variances are reviewed in steps, and any outliers are traced back to the assumption level, so the correction is clear and repeatable.
We refresh the report annually, and interim updates are triggered when material events occur, such as major approvals, recalls, or sharp pricing shifts. Before delivery, analysts run a fresh review pass so the final numbers reflect the latest available public data and the most recent expert checks.
Mordor Intelligence's Wearable Injectors Market Estimate Compared With Other Published Estimates
Published market values for wearable injectors can look far apart even when they describe similar devices, because the boundaries and counting rules are not always the same. Differences usually come from what gets included as a wearable injector, which year is treated as the base, and how fast adoption is assumed to move across therapy areas and regions.
By tracking regulatory scope cues and therapy-level adoption rates, Mordor Intelligence keeps the count tied to autonomous large-volume subcutaneous delivery devices, instead of blending in adjacent self-injection tools or infusion equipment that changes the denominator. Gaps can also show up when one estimate uses factory-gate device revenues while another layers in downstream service revenue, or when currency timing and price progression assumptions are not refreshed after major launches and reimbursement changes.
Benchmark comparison
| Source | Market Size | Gaps in Research Methodology |
|---|---|---|
| Mordor Intelligence | USD 12.49 B (2026) | |
| Global Consultancy A | USD 10.12 B (2024) | Uses an earlier base year and may apply broader device inclusion and faster near-term uptake assumptions, which can shift the level even before forecasting starts. |
| Industry Publisher B | USD 8.84 B (2024) | Often centers revenue at factory-gate values and may include related services differently, and the therapy mix and regional adoption curve choices can pull the total down versus models that emphasize biologics shifting to home care. |
The spread in the table is mainly explained by base-year choice, device boundary, and how revenue is counted across the value chain. By keeping assumptions linked to clear demand drivers like treated cohorts, wearable eligibility, and realistic pricing movement, we end up with a number that can be rechecked and updated without changing the logic each year.


Key Questions Answered in the Report
What is the current wearable injectors market size?
The wearable injectors market size reached USD 12.49 billion in 2026 and is projected to hit USD 24.11 billion by 2031 at a 14.06% CAGR.
Which segment holds the largest share of the wearable injectors market?
On-body patch injectors led with 60.98% of the wearable injectors market share in 2025, primarily due to widespread adoption in diabetes management.
Which region is expected to grow fastest in the wearable injectors market?
Asia-Pacific is forecast to post the quickest 14.79% CAGR through 2031, supported by healthcare digitization policies and expanding middle-class populations.
What therapeutic area dominates wearable injector use?
Oncology applications accounted for 33.28% of the wearable injectors market size in 2025, with subcutaneous biologics reducing infusion times for cancer patients.
How are payers influencing the adoption of wearable injectors?
Surveys show 90% of payers believe wearable injectors address unmet care needs, and 82% are willing to pay a premium for devices that enable safe home-based treatment.
What sustainability challenges face the wearable injectors industry?
Battery end-of-life management and polymer waste pose environmental concerns, prompting manufacturers to explore recyclable housings and longer-life power solutions.
Page last updated on:


