
Needle-Free Drug Delivery Devices Market Size and Share
Market Overview
| Study Period | 2020 - 2031 |
|---|---|
| Market Size (2026) | USD 16.7 Billion |
| Market Size (2031) | USD 23.48 Billion |
| Growth Rate (2026 - 2031) | 7.05 % |
| Fastest Growing Market | Asia Pacific |
| Largest Market | North America |
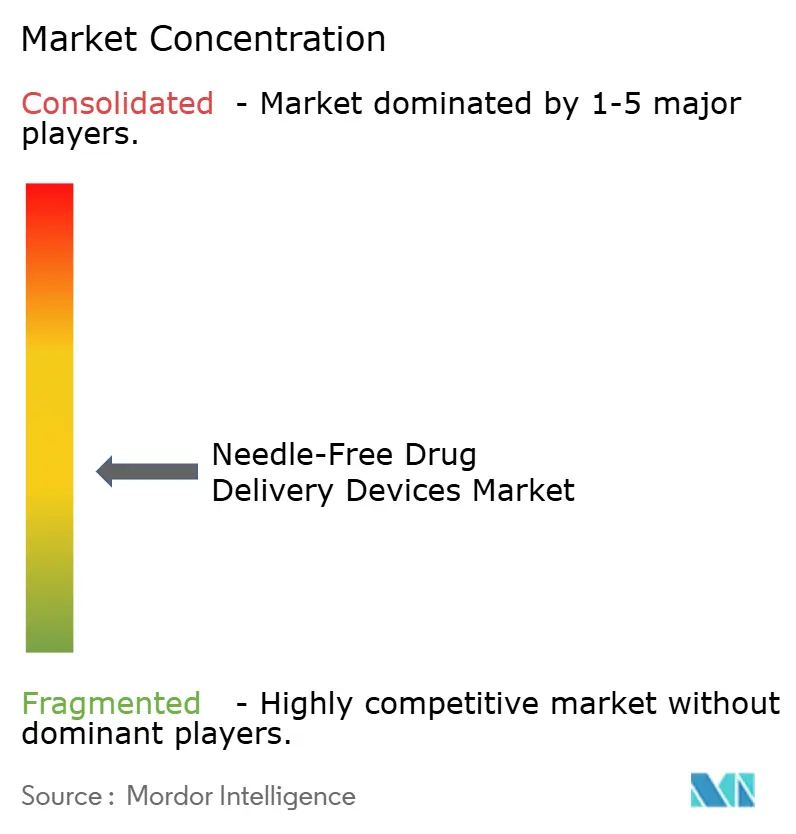
| Market Concentration | Medium |
Major Players *Disclaimer: Major Players sorted in no particular order Image © Mordor Intelligence. Reuse requires attribution under CC BY 4.0. | |
Needle-Free Drug Delivery Devices Market Analysis by Mordor Intelligence
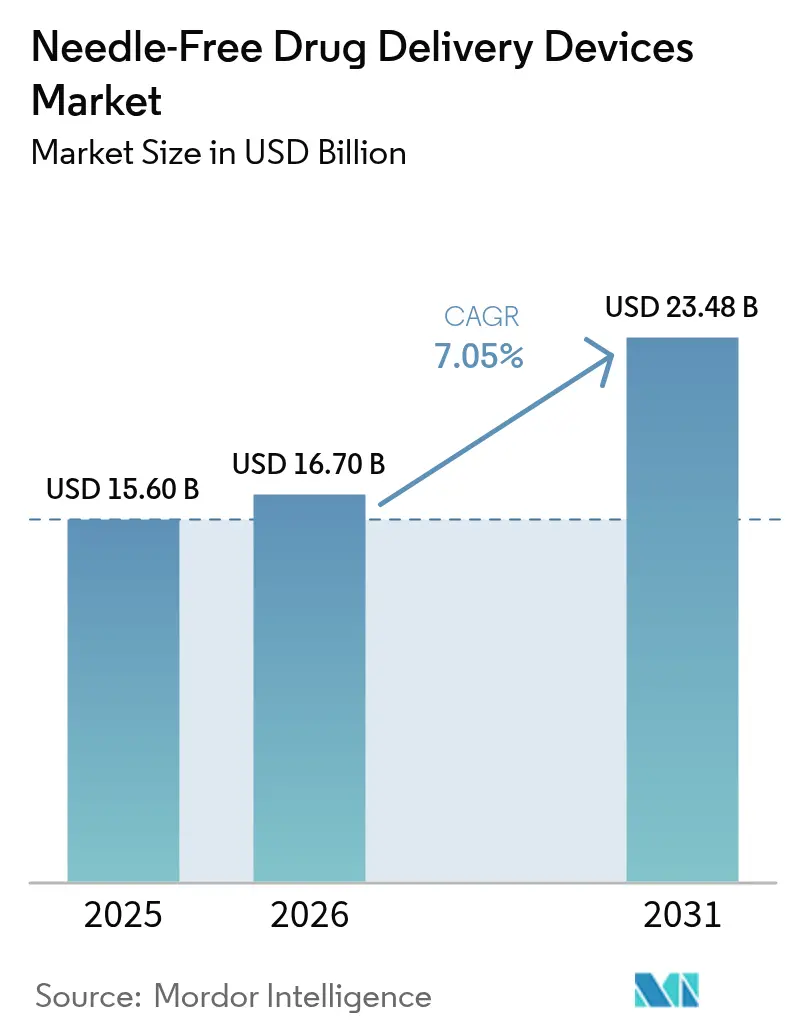
The needle free drug delivery devices market size is expected to grow from USD 15.60 billion in 2025 to USD 16.70 billion in 2026 and is forecast to reach USD 23.48 billion by 2031 at 7.05% CAGR over 2026-2031. Robust demand for self-administration, rising biologics pipelines, and sustained investment in digital-health integrations are powering this upward trajectory. North America contributes the largest regional share, while Asia-Pacific is growing fastest as healthcare access broadens and chronic-disease incidence rises. Jet injectors maintain a dominant device position, yet microneedle patches are scaling rapidly as 3D printing and biodegradable materials unlock new formulation possibilities. Oncology therapies anchor the highest application growth as precision-medicine strategies demand delivery platforms that minimize systemic toxicity and elevate adherence. Regulatory complexity remains the primary headwind, though firms that master evolving guidance can secure durable competitive advantages.
Key Report Takeaways
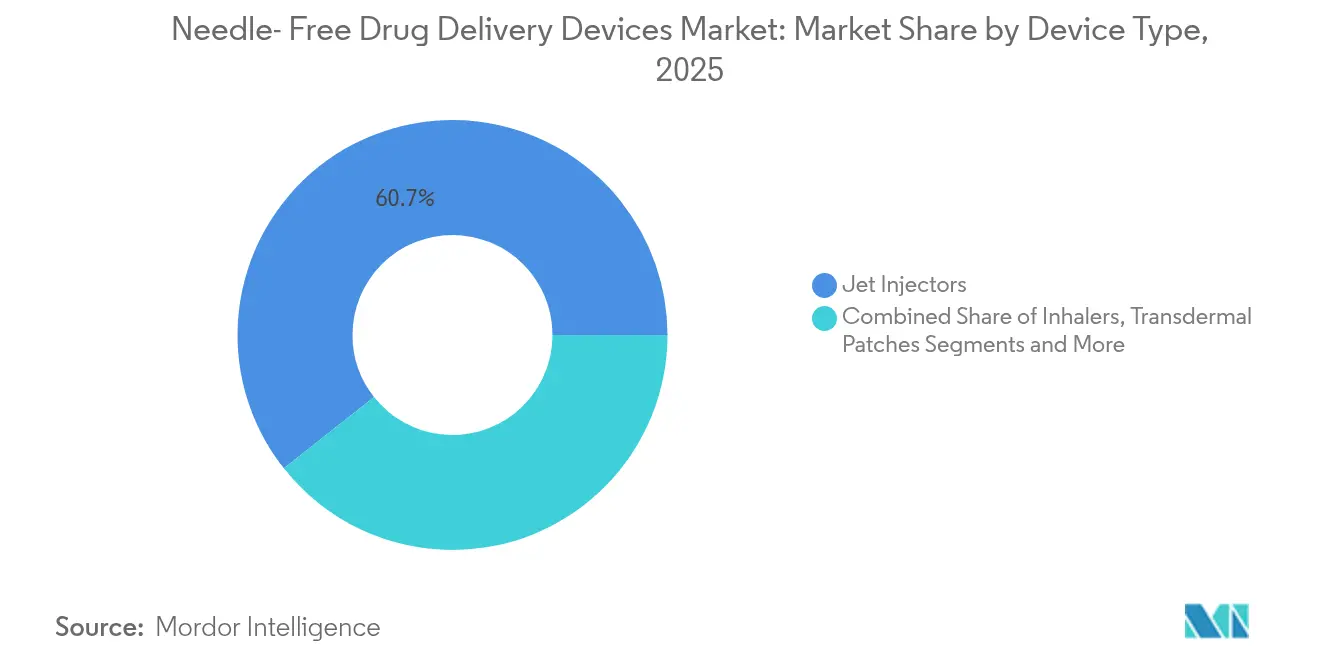
- By device type, jet injectors held 60.65% of the needle free drug delivery devices market share in 2025, while microneedle patches are projected to advance at a 10.15% CAGR to 2031.
- By usability, disposable systems commanded 66.05% share of the needle free drug delivery devices market size in 2025; reusable systems are projected to expand at a 8.72% CAGR.
- By product fill type, prefilled injectors accounted for 52.10% share of the needle free drug delivery devices market size in 2025, whereas fillable injectors are expected to grow at an 8.44% CAGR.
- By site of delivery, subcutaneous delivery led with 48.25% needle free drug delivery devices market share in 2025; intradermal delivery is forecast to rise at a 8.73% CAGR.
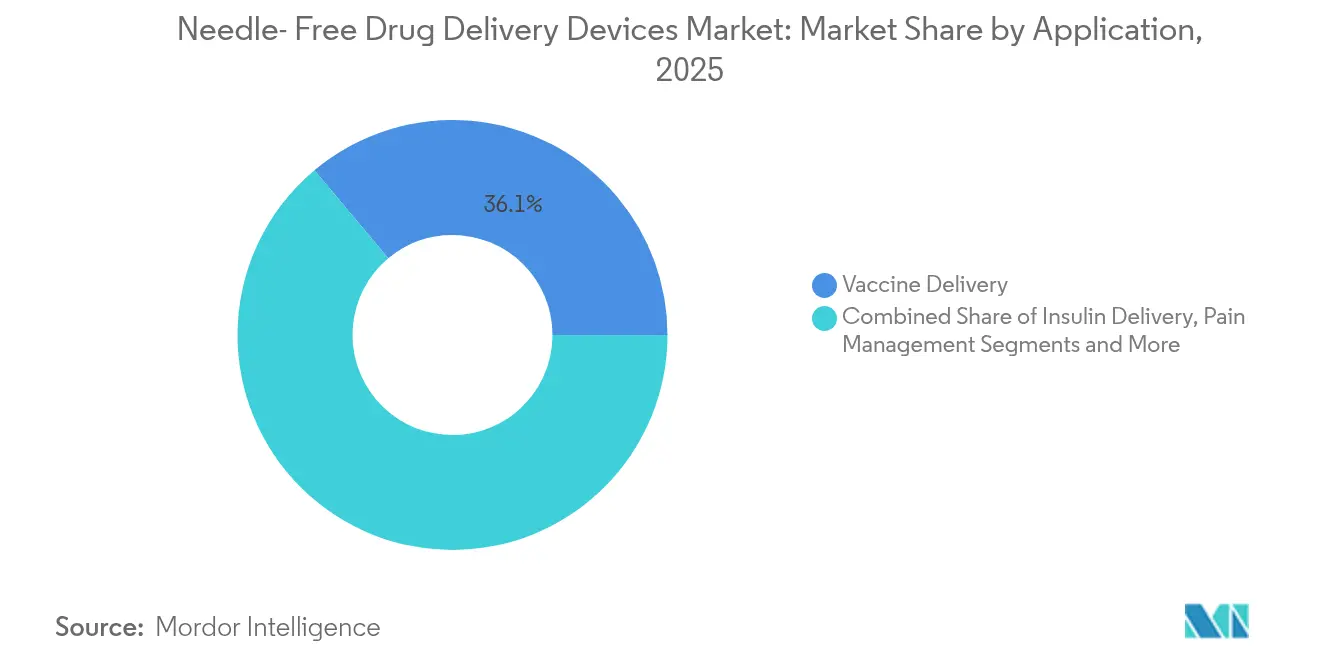
- By application, vaccine delivery held 36.10% of the needle free drug delivery devices market share in 2025, and oncology therapies should register the fastest 9.98% CAGR through 2031.
- By end user, hospitals and clinics represented 58.15% of the needle free drug delivery devices market size in 2025, while home-care settings are growing at a 8.93% CAGR.
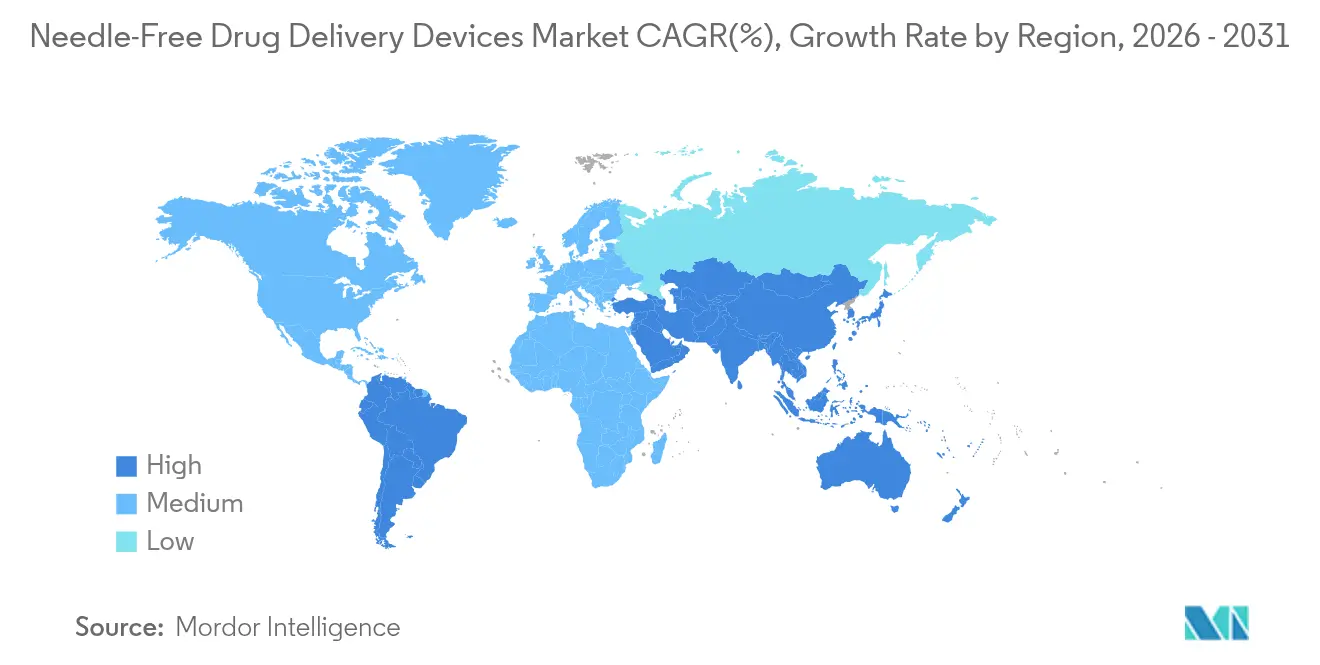
- By region, North America led with 38.10% of the needle free drug delivery devices market share in 2025, and Asia-Pacific is set for a 10.02% CAGR to 2031.
Note: Market size and forecast figures in this report are generated using Mordor Intelligence’s proprietary estimation framework, updated with the latest available data and insights as of 2026.
Global Needle-Free Drug Delivery Devices Market Trends and Insights
Drivers Impact Analysis*
| Driver | (~) % Impact on CAGR Forecast | Geographic Relevance | Impact Timeline |
|---|---|---|---|
| High burden of chronic and lifestyle disorders | +2.1% | Global, highest in North America and Europe | Long term (≥ 4 years) |
| Rising patient preference for self-administration & home care | +1.8% | North America, Europe, developed Asia-Pacific | Medium term (2-4 years) |
| Technological advancements | +1.5% | Global, early adoption in North America and Europe | Medium term (2-4 years) |
| Rising vaccination initiatives and immunization programs | +1.3% | Global, highest in Asia-Pacific and Africa | Medium term (2-4 years) |
| High burden of needle-stick injuries | +0.9% | Global, highest in healthcare-dense regions | Short term (≤ 2 years) |
| Accelerating pharma–device co-development alliances | +0.7% | North America and Europe, expanding to Asia-Pacific | Long term (≥ 4 years) |
| Source: Mordor Intelligence | |||
High Burden of Chronic and Lifestyle Disorders
Global prevalence of diabetes, cancer, and cardiovascular disease is resetting delivery priorities toward safer, pain-free platforms. In 2024, U.S. healthcare facilities recorded 600,000-800,000 needlestick injuries, each costing USD 500-3,000 in follow-up care.[1]Massachusetts Department of Public Health, “Needlesticks and Other Sharps Injuries Among Healthcare Workers,” mass.gov Needle free injectors reduce sharps exposure and align with chronic-disease protocols requiring lifelong therapy. Manufacturers now design devices expressly for chronic use cases, such as wearable injectors that maintain flow rates for up to 72 hours. These patient-centric designs underpin sustained demand within the needle free drug delivery devices market.
Rising Patient Preference for Self-Administration & Home-Care Solutions
Home-based models are reshaping care economics, and 87.5% of users of the enFuse on-body system report confidence in self-therapy. Health systems benefit from lower facility overhead, while patients gain autonomy. Human-factors engineering—ergonomic triggers, tactile feedback, and intuitive graphical prompts—has become a critical differentiator, enabling firms to capture share in the expanding needle free drug delivery devices market.
Technological Advancements
3D-printed microneedle arrays deliver complex geometries that triple drug-loading capacity and tailor diffusion rates.[2]Xiang Li, “3D Printing of Dissolvable Microneedle Arrays for Transdermal Drug Delivery,” Scientific Reports, nature.com Biodegradable polymers reduce biohazard waste and support eco-design imperatives. Connected auto-injectors capture dose histories, yielding a 37% drop in medication errors for chronic-care patients. These converging innovations sustain long-run momentum for the needle free drug delivery devices market.
Rising Vaccination Initiatives and Immunization Programs
Expanded immunization drives across Asia-Pacific and Africa create volume demand for painless, dose-sparing platforms. Microneedle patches can achieve equivalent immune response with 40% lower antigen load, easing cold-chain strain. Public-health agencies adopting intradermal jet injectors accelerate uptake, reinforcing growth in regions where the needle free drug delivery devices market remains early-stage.
Restraints Impact Analysis*
| Restraint | (~) % Impact on CAGR Forecast | Geographic Relevance | Impact Timeline |
|---|---|---|---|
| Stringent regulatory framework | -1.2% | Global, highest in North America and Europe | Medium term (2-4 years) |
| Premium pricing & inadequate reimbursement | -1.0% | Emerging Asia-Pacific and Latin America | Medium term (2-4 years) |
| Limited drug-formulation compatibility and risk with reusable devices | -0.9% | Global, higher impact in cost-sensitive markets | Short term (≤ 2 years) |
| Limitations associated with microneedle patches | -0.8% | Global | Short term (≤ 2 years) |
| Source: Mordor Intelligence | |||
Stringent Regulatory Framework
The U.S. FDA’s 2024 Essential Drug Delivery Outputs guidance introduced rigorous verification protocols for combination products, extending development cycles and raising costs.[3]FDA, “Essential Drug Delivery Outputs for Combination Products,” fda.gov Divergent rules in the EU and Asia compel firms to engineer region-specific versions, fragmenting R&D budgets. Smaller innovators feel the strain most acutely, slowing novel entrants into the needle-free drug delivery devices market.
Premium Pricing & Inadequate Reimbursement in Cost-Sensitive Settings
Advanced materials and electromechanical components inflate device prices. Oregon’s 2024 Drug Price Transparency report flagged delivery hardware as a driver of therapy expense escalation. Reimbursement gaps deter adoption in out-of-pocket markets, restraining diffusion of premium platforms despite clinical merits and tempering growth within the needle-free drug delivery devices market.
*Our forecasts treat driver/restraint impacts as directional, not additive. The impact forecasts reflect baseline growth, mix effects, and variable interactions.
Segment Analysis
By Device Type: Jet Injectors Retain Scale while Microneedle Patches Accelerate
Jet injectors captured 60.65% of 2025 revenue, reflecting their vaccine-ready versatility and capacity to handle high-viscosity biologics. This dominance secures a sizeable portion of the needle-free drug delivery devices market for mature players. Microneedle patches, however, are projected to expand at 10.15% CAGR, fueled by dissolvable polymers that leave no sharps waste and enhanced permeability, which have been proven to raise bioavailability by up to 40%.
Form-factor innovation is redefining competitive boundaries. Laser-assisted systems and electroporation devices serve niche protein and gene-therapy pipelines, underscoring the breadth of the needle-free drug delivery devices market. 3D-printed molds let manufacturers iterate microstructure rapidly, trimming prototype cycles and reinforcing first-mover advantages.



By Usability: Sustainability Push Elevates Reusable Platforms
Disposable formats hold 66.05% share, but environmental mandates and cost-containment pressures spur a 8.72% CAGR for reusable devices. Life-cycle analyses indicate potential 85% waste reduction versus single-use injectors. The needle free drug delivery devices market increasingly rewards designs featuring detachable drug cartridges and autoclavable housings.
User-centered evaluations reveal higher confidence scores when tactile cues and mobile-app tutorials guide dose delivery. Smart sensors embedded in reusable systems transmit administration data to cloud dashboards, expanding value beyond sustainability to adherence intelligence.
By Product Fill Type: Prefilled Convenience vs. Fillable Flexibility
Prefilled injectors own 52.10% of 2025 revenues, their ready-to-use format mitigating dosing errors—an attribute prized in oncology and immunology. That said, fillable platforms are gaining at 8.44% CAGR as simplified loading mechanics and guided prompts overcome historic sterility hurdles. Dual-chamber variants that reconstitute lyophilized biologics close the convenience gap while preserving cold-chain resilience, enlarging the needle-free drug delivery devices market size for cost-sensitive providers.
Manufacturers pilot value-tier strategies in emerging economies, offering refill kits compatible with durable actuators, thereby lowering per-dose cost and widening access.
By Site of Delivery: Intradermal Routes Gain Speed
Subcutaneous administration dominated with 48.25% needle-free drug delivery devices market share in 2025, balancing absorptive kinetics with patient familiarity. Intradermal delivery should grow 8.73% CAGR as microneedle tech targets dendritic-cell-rich skin layers, yielding dose-sparing benefits critical to pandemic preparedness.
Device engineers tailor burst pressure and nozzle geometry for tissue-specific dispersion, illustrating how site of delivery now dictates hardware architecture. Intramuscular systems remain essential for emergency epinephrine and select vaccines, preserving multiroute diversity within the broader needle free drug delivery devices market.
By Application: Oncology Therapies Propel High-Value Growth
Vaccines provided 36.10% of 2025 revenue, yet oncology will log the fastest 9.98% CAGR as antibody-drug conjugates migrate to at-home regimens. Microneedle arrays enable localized chemotherapeutic micro-dosing, reducing systemic exposure and enhancing patient comfort.
Insulin remains foundational, but innovations emphasize real-time glucose-coupled delivery algorithms. Pediatric applications leverage painless mechanisms to boost compliance, carving specialized niches and amplifying diversity in the needle-free drug delivery devices market.
By End User: Home-Care Settings Transform Delivery Economics
Hospitals and clinics retained a 58.15% share in 2025, yet home-care channels are scaling at a 8.93% CAGR as payers endorse the migration of stable therapies. A study in the Journal of Medical Economics estimated 37% annual cost savings per patient when injectable regimens shift to home settings.
Remote-monitoring functionality embedded in modern devices addresses clinician oversight concerns, accelerating adoption and enlarging the needle-free drug delivery devices market.
Geography Analysis
North America commands 38.10% of 2025 revenue thanks to entrenched biopharma R&D, high chronic-disease prevalence, and reimbursement for advanced delivery systems. The FDA approved 32% more combination products in 2024 versus 2023, signaling a favorable pipeline for the needle-free drug delivery devices market. Clinical data from MIT showed microneedle patches deliver biologics with 40% higher bioavailability than conventional subcutaneous routes. Digital-health maturity underpins rapid uptake of connected injectors that broadcast adherence metrics to provider dashboards.
Asia-Pacific is the fastest-growing arena at 10.02% CAGR as China and India scale chronic-care infrastructure. Local firms increasingly develop proprietary jet injectors and microneedles, signaling a shift from contract manufacturing to innovation leadership. Japan’s super-aged demographic drives demand for low-force actuators suited to frail skin, influencing regional design cues. Regulatory harmonization under Asia-Pacific Economic Cooperation frameworks eases cross-border rollout but still requires country-specific dossiers, adding strategic nuance for entrants aiming to capture share in the needle free drug delivery devices market.
Europe sustains meaningful scale with value-based reimbursement that rewards demonstrable clinical benefit. Germany tops regional revenue, buoyed by domestic pharma giants and a payer environment receptive to outcome-linked pricing. Sustainability imperatives spur R&D into recyclable housings and bio-derived polymers, aligning with EU Green Deal targets. Autoinjectors are replacing glass prefilled syringes as safety-engineered designs mitigate accidental sticks. The European Medicines Agency’s focus on patient-reported outcomes elevates importance of ergonomic testing during approvals, encouraging holistic device design across the needle free drug delivery devices market.

Regulatory Landscape
Needle-free drug delivery devices are regulated as medical devices and, when paired with a drug or biologic, as combination products. That structure increases evidence and quality-system requirements across jurisdictions. In the United States, jet injectors are commonly classified as Class II devices (21 CFR 880.5430, product code KZE). For combination products, FDA oversight follows the Primary Mode of Action framework to assign the FDA lead center (CDER, CDRH, or CBER). A key 2026 inflection point was the FDA Quality Management System Regulation (QMSR) taking effect on February 2, 2026, replacing the legacy QSR and incorporating ISO 13485:2016 by reference, which has required manufacturers and suppliers to update quality documentation, validation, and supplier controls.
In Europe, integral drug-device combinations face added scrutiny under the Medical Device Regulation (MDR), including Article 117 requirements for a Notified Body Opinion on the device constituent. This can extend timelines and increase coordination needs between marketing authorization holders and device suppliers. ISO 21649:2023 anchors performance and test requirements for needle-free injection systems, and ISO 11608 remains central for injector design and verification. ISO 11608-1:2022/Amd 1:2026 was published on April 24, 2026, and device developers and contract manufacturers need to reflect the updated requirements in design controls and verification plans.
Value Chain Analysis
The needle-free drug delivery devices value chain spans drug or biologic sponsors, device OEMs (jet injectors, microneedle patch platforms, inhalation and transdermal systems), component suppliers (polymers, elastomers, sensors and microcontrollers for electromechanical systems), and specialized contract partners for precision manufacturing, assembly, and packaging. For combination products, regulatory workstreams are tightly linked with engineering, since evidence for the device constituent must be built alongside the medicinal product dossier. In the EU, MDR Article 117 introduces a Notified Body Opinion requirement, which further shapes how partners coordinate within the chain. Standards such as ISO 21649:2023 (needle-free injection systems) and the ISO 11608 series (injector requirements) guide design inputs, verification testing, and supplier qualification across OEMs and CMOs.
Manufacturing and scale-up are key value capture points, particularly for microneedle patches where microinjection molding supports repeatable array production but depends on tight control of polymer viscosity, shrinkage, and tooling thermal design (including conformal cooling). Bottlenecks often center on keeping consistent microneedle geometry and drug loading at batch scale, balancing brittleness against scalability in materials, and maintaining traceability and ownership of design history and validation evidence across OEMs, CMOs, and marketing authorization holders. Downstream, distribution and adoption hinge on institutional procurement and public-health use cases, where large-volume vaccination and immunization programs favor platforms that deliver consistent administration, reduce waste, and simplify training.
Competitive Landscape
The needle free drug delivery devices market exhibits moderate concentration, where established players such as Ferring B.V. and Owen Mumford vie with disruptors like Portal Instruments and Vaxxas. Strategic alliances between device makers and biopharma sponsors increasingly influence therapeutic-area leadership: co-development deals align dose form with delivery hardware at inception, reducing time to clinic.
Disruptive entrants exploit technological differentiation. Portal Instruments’ PRIME digital jet injector demonstrated lower pain scores than prefilled syringes, with 76% of trial participants citing reduced anxiety. Vaxxas leverages proprietary high-density microneedle patches for thermostable vaccines, a feature attractive to low-resource geographies.
Patent filings signal intensifying focus on scalable microneedle manufacturing and AI-orchestrated parameter optimization. Competitors integrate cloud connectivity, machine-learning adherence analytics, and dose-confirmation feedback loops into next-gen devices. White-space opportunities remain in mRNA and gene-therapy delivery, where large-molecule stability challenges persist, offering headroom for innovators to elevate share within the needle free drug delivery devices market.
Needle-Free Drug Delivery Devices Industry Leaders
PharmaJet
MannKind Corporation
Halozyme, Inc. (Antares Pharma)
Solventum
Injex Pharma AG
- *Disclaimer: Major Players sorted in no particular order

Market Opportunities and Future Outlook
Home-care self-administration and chronic-therapy adherence remain central whitespace areas for needle-free platforms, particularly where connected features and human-factors design aim to reduce dosing errors and support remote oversight. The market mix reflects this shift, with home-care settings gaining visibility as a defined end-user channel and disposable systems still representing the larger installed base. That dynamic leaves room for reusable architectures that lower per-dose waste through durable actuators and replaceable cartridges. Digital-health integration also creates differentiation opportunities in electromechanical injectors and wearable systems that log dose events and enable clinician review, which aligns with payer and provider priorities around medication-error reduction and outpatient cost containment.
Regulatory and program signals also point to commercialization pathways beyond traditional injections. In the United States, the FDA implemented QMSR on February 2, 2026, raising ISO 13485-aligned quality expectations for device makers and suppliers. A June 2026 Federal Register action expanded 510(k) exemptions for certain device categories, reinforcing interest in lower-friction pathways where risk profiles permit. On the product side, FDA clearance activity for syringe-less injection in adjacent use cases, including Ulrich Medicals CT Motion Injector clearance reported in January 2026 for diagnostic imaging, indicates continued institutional acceptance of needle-free and syringe-less administration paradigms that can carry into broader procurement and training familiarity. For vaccines and public health, intradermal strategies and fractional dosing programs support deployment lanes for jet injectors and microneedle platforms where dose-sparing and reduced sharps waste are part of the value proposition.
Recent Industry Developments
- June 2026: Halozyme Therapeutics and LifeMD announced an exclusive direct-to-patient, self-pay program for XYOSTED (testosterone enanthate) injection, leveraging Halozyme subsidiary Antares Pharma, with program availability stated to begin in July 2026 across 37 U.S. states. The program expands access and supports patient-driven fulfillment models for drug-device combinations, strengthening commercialization pathways outside traditional clinic dispensing.
- May 2026: PharmaJet reported that its Tropis intradermal needle-free injection system was selected to deliver about 1.4 million doses of fractional inactivated polio vaccine in Nigeria through a partnership with the African Field Epidemiology Network. Large-scale campaign selection reinforces jet injectors' role in dose-sparing strategies and validates operational readiness for high-throughput immunization settings.
- May 2024: MannKind disclosed a transaction with Pulmatrix to establish a Boston-area R&D foothold and broaden its dry-powder inhalation technology portfolio. The expansion supports inhaled, needle-free delivery capabilities and helps build a pipeline where device, formulation, and manufacturability must be optimized together.


Research Methodology Framework and Report Scope
Market Definition and Coverage
This market covers devices and delivery platforms that administer medicines or vaccines without using a conventional skin-penetrating metal needle. It includes the device hardware and systems used across hospital care, home use, and research settings, where delivery happens through pressure, inhalation, or transdermal routes.
Scope exclusions: Conventional hypodermic syringes, needle-based pens, and autoinjectors that use metal needles are excluded.
Segmentation Overview
- By Device Type
- Jet Injectors
- Inhalers
- Transdermal Patches
- Micro-Needle Patches
- Oral Needle-Free Systems
- Novel Needle-Free Technologies (Electroporation, Laser-based)
- By Usability
- Disposable Systems
- Reusable Systems
- By Product Fill Type
- Prefilled Injectors
- Fillable Injectors
- By Site of Delivery
- Intradermal
- Subcutaneous
- Intramuscular
- By Application
- Insulin Delivery
- Vaccine Delivery
- Pain Management
- Pediatric Injections
- Oncology Therapies
- Other Applications
- By End User
- Hospitals & Clinics
- Home-Care Settings
- Research & Academic Institutes
- Geography
- North America
- United States
- Canada
- Mexico
- Europe
- Germany
- United Kingdom
- France
- Italy
- Spain
- Rest of Europe
- Asia-Pacific
- China
- Japan
- India
- Australia
- South Korea
- Rest of Asia-Pacific
- Middle East and Africa
- GCC
- South Africa
- Rest of Middle East and Africa
- South America
- Brazil
- Argentina
- Rest of South America
- North America
Data Sources, Market Sizing, and Validation
Desk Research
Desk work starts by building a clean view of where demand is coming from and how devices are regulated, adopted, and paid for. We refer to public sources such as the US FDA databases (product clearances, safety notices, and guidance), the CDC for vaccination and disease burden indicators, and the WHO for immunization and regional health statistics.
To keep assumptions realistic, we also use sources such as the World Bank and OECD health expenditure indicators, along with peer-reviewed journals covering inhalation delivery, jet injector performance, and microneedle patch studies. Company filings, investor presentations, and reputable press are reviewed to understand product launches and manufacturing scale, and then paid subscriptions for company financials and patent databases are used selectively to confirm revenue exposure and innovation intensity. These examples are not exhaustive, and many other public and internal references were used for data collection, validation, and clarification.
Primary Interviews and Surveys
Primary inputs were used to pressure-test the demand pool and pricing logic across device types and end uses, and then to sense-check regional adoption differences. We spoke with a mix of device-side experts, healthcare professionals, and distribution and procurement stakeholders across major regions, which helped fill gaps where public data is limited and kept our assumptions consistent with real-world usage.
Distribution of primary research fieldwork respondents
| Company type | Respondent position | Region |
|---|---|---|
| Top tier: 28% | CXOs: 13% | APAC: 45% |
| Mid tier: 56% | Functional/Unit leaders: 42% | EMEA: 32% |
| Smaller Players: 16% | Managers: 45% | Americas: 23% |
Market-Sizing & Forecasting
Sizing begins with a top-down build where disease burden and immunization volumes, self-administration penetration, and healthcare setting mix are translated into an addressable device demand pool, which is then converted to value using average selling price ranges by technology and use setting. Once that demand pool is framed, selective bottom-up approximations are used as checks, such as supplier revenue exposure to needle-free platforms, channel discussions on unit movement, and sampled ASP times volume for key therapy areas.
Inputs that matter in this market include vaccine and chronic disease volumes (especially diabetes), adoption rates of homecare and self-injection alternatives, the mix shift between jet injectors, inhaler-based delivery, and transdermal or microneedle formats, and the pace of product approvals and recalls that can change shipments. Pricing is handled with a clear separation between reusable systems and disposable components where applicable, and gaps are addressed by using proxy adoption curves from comparable device categories, followed by expert review. For forecasting, scenario analysis is used to reflect the range of uptake paths, and each scenario is anchored to expert views on regulatory timelines, reimbursement readiness, and manufacturing scale-up.
Data Validation & Update Cycle
Outputs are checked against independent signals, such as procedure and vaccination trends, healthcare spending movement, and visible launch and recall events, before final numbers are locked. When a region or technology shows an unexpected swing, the assumptions are re-opened, and targeted follow-ups are triggered with relevant experts to confirm what changed and why.
A multi-step review is followed so that logic, math, and narrative stay aligned, and then a final pre-release pass is completed to capture the latest material events. Reports are refreshed annually, and interim updates are made when approvals, safety actions, or major commercial changes can materially shift the market direction.
Mordor Intelligence's Needle Free Drug Delivery Devices Market Size Versus Other Published Estimates
Published market values for needle-free drug delivery devices often vary because the scope line is drawn differently and the base year choices are not the same. Differences also come from how device categories are grouped, how reusable versus disposable value is treated, and how quickly assumptions are updated after regulatory or launch events.
In some publications, the value pool can expand by folding in adjacent needle-based injectors or by using aggressive adoption curves for microneedle and patch formats without enough checks against real purchasing behavior. The main spread also shows up when older base-year values are carried forward with a high CAGR, even though pricing and approval timing do not always move in a straight line.
Benchmark comparison
| Source | Market Size | Gaps in Research Methodology |
|---|---|---|
| Mordor Intelligence | USD 16.70 B (2026) | |
| Global Consultancy A | USD 14.68 B (2024) | Uses an earlier base year and a faster growth profile, which can understate near-term value if ASPs and adoption rose later, and it does not clearly separate reusable systems from recurring disposable components. |
| Industry Publisher B | USD 15.50 B (2024) | Applies a broader needle-free devices umbrella across technologies and end uses, so comparability depends on whether adjacent device revenues are included and how currency timing and inflation adjustments are handled. |
The table shows that year choice and what is counted as needle-free device revenue can move the headline number by a noticeable amount. Keeping the model tied to observable demand signals like vaccination activity and chronic disease treatment patterns, and excluding needle-based injectors from the value pool, helps explain why the 2026 figure lands where it does for Mordor Intelligence.


Key Questions Answered in the Report
What is the current size of the needle free drug delivery devices market?
The market is valued at USD 16.70 billion in 2026 and is projected to reach USD 23.48 billion by 2031.
Which region is growing fastest for needle free devices?
Asia-Pacific shows the highest growth, registering a 10.02% CAGR through 2031 due to expanding healthcare access and chronic-disease prevalence.
Why are microneedle patches attracting investment?
Patches deliver drugs painlessly, can reduce antigen load by 40%, and are forecast to grow at a 10.15% CAGR—the fastest among device types.
How do reusable systems support sustainability goals?
Reusable injectors can cut medical-waste volume by up to 85% compared with disposable counterparts, aligning with global eco-targets.
What is the biggest restraint on market expansion?
Stringent, region-specific regulatory requirements add time and cost to product development, curbing swift entry of novel technologies
Which application segment is projected to expand most rapidly?
Oncology therapies are set to record a 9.98% CAGR as precision-medicines demand delivery methods that boost adherence and minimize systemic exposure
Page last updated on:





