
Vendor Management Software Market Size and Share
Market Overview
| Study Period | 2020 - 2031 |
|---|---|
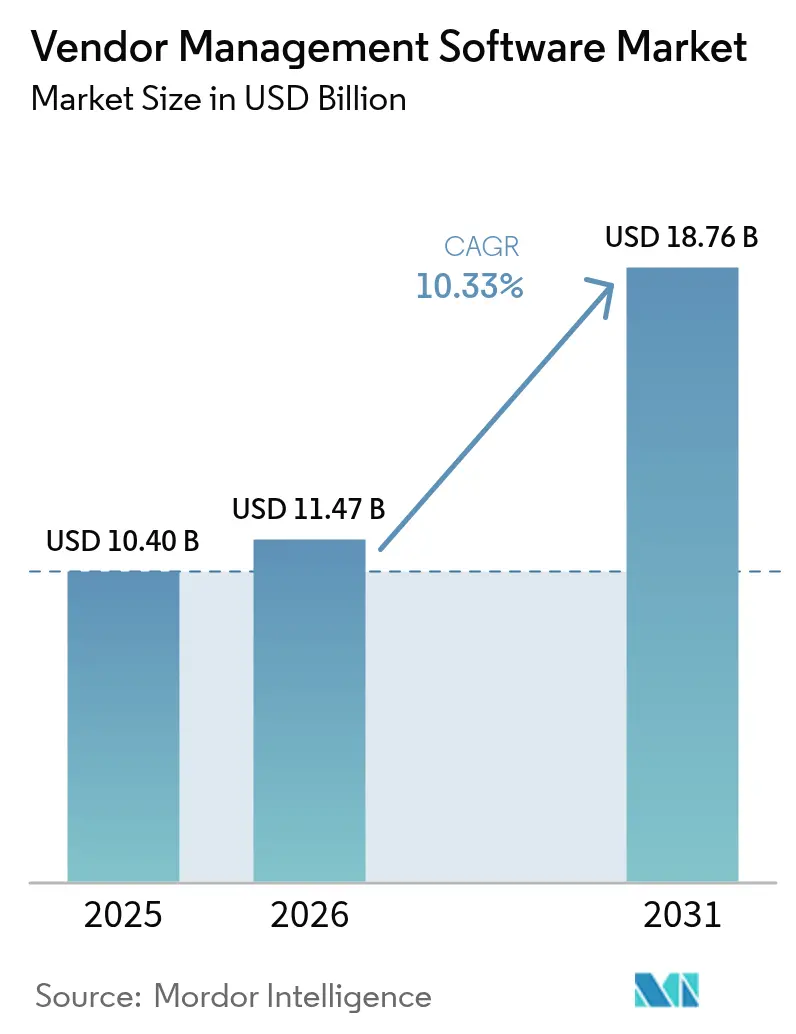
| Market Size (2026) | USD 11.47 Billion |
| Market Size (2031) | USD 18.76 Billion |
| Growth Rate (2026 - 2031) | 10.33 % |
| Fastest Growing Market | Asia Pacific |
| Largest Market | North America |
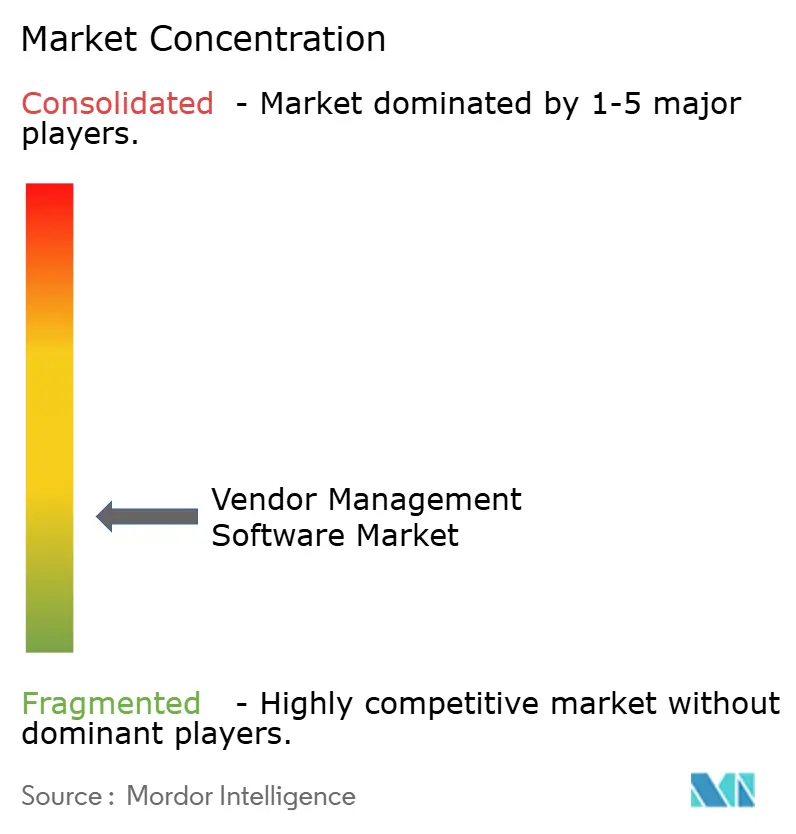
| Market Concentration | Low |
Major Players *Disclaimer: Major Players sorted in no particular order Image © Mordor Intelligence. Reuse requires attribution under CC BY 4.0. | |
Vendor Management Software Market Analysis by Mordor Intelligence
The vendor management software market size was valued at USD 10.40 billion in 2025 and estimated to grow from USD 11.47 billion in 2026 to reach USD 18.76 billion by 2031, at a CAGR of 10.33% during the forecast period (2026-2031). Strong momentum reflects enterprises’ need to digitize supplier relationships as supply-chain complexity, material-cost inflation, and regulatory scrutiny converge. Cloud-native deployment, AI-driven analytics, and embedded compliance monitoring now set the baseline for new purchases, while integrated source-to-pay suites are steadily replacing point tools. Platform vendors that streamline onboarding, centralize supplier data, and surface predictive insights win preference because manual oversight cannot scale across hundreds of third parties. Competitive conditions remain moderate; established ERP providers, best-of-breed specialists, and AI-native entrants share the field, creating ample scope for niche differentiation without any single firm dominating.
Key Report Takeaways
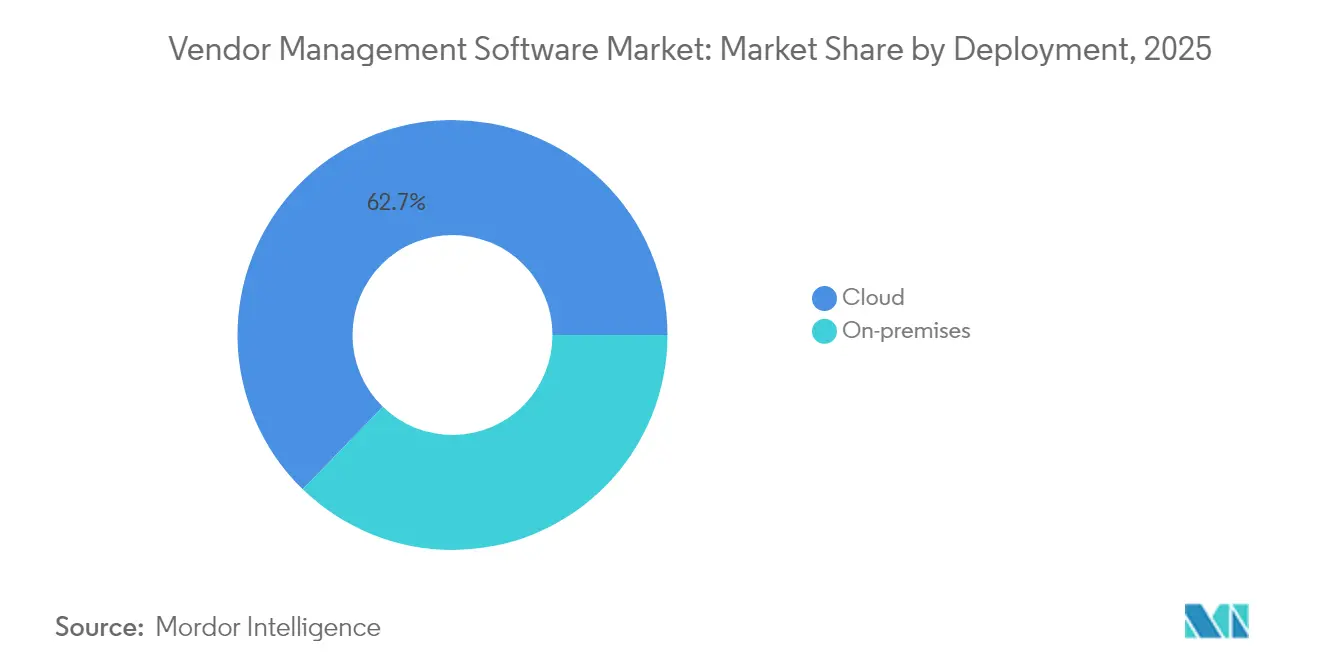
- By deployment, cloud platforms led with 62.74% revenue share in 2025; the segment is advancing at a 12.65% CAGR to 2031.
- By end-user industry, manufacturing held 36.64% of the vendor management software market share in 2025, while retail is projected to expand at an 10.98% CAGR through 2031.
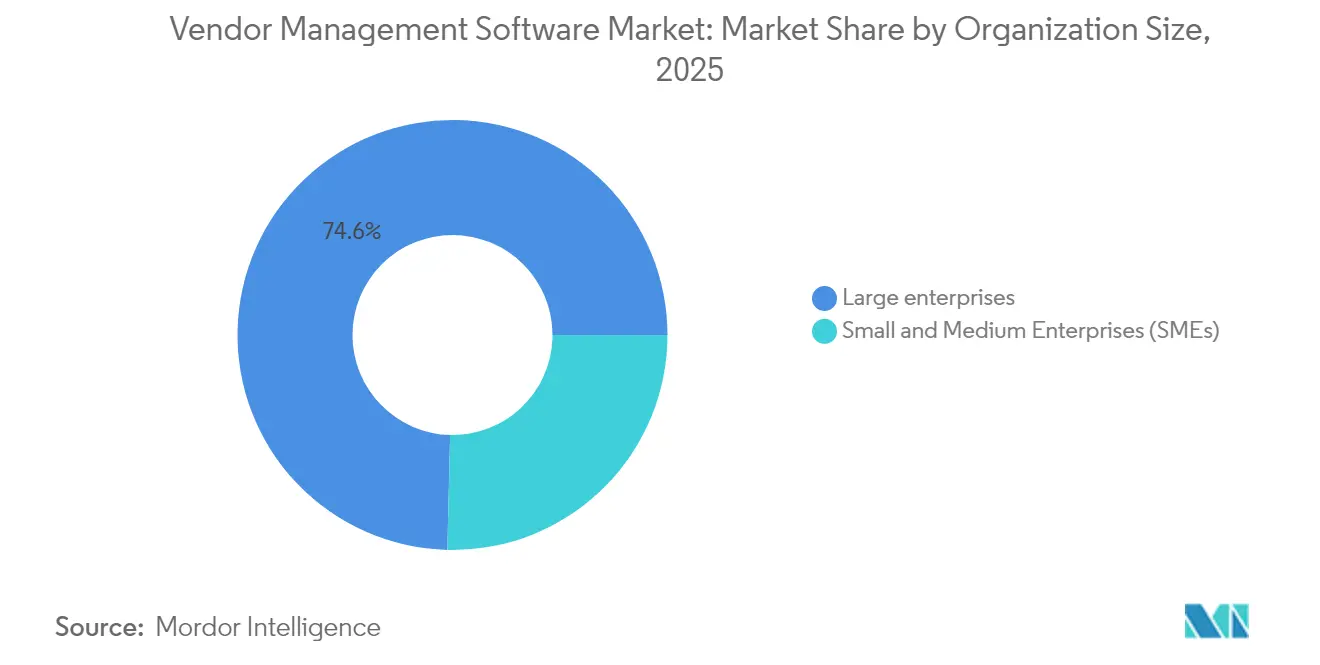
- By organization size, large enterprises accounted for 74.62% share of the vendor management software market size in 2025; small and medium enterprises register the highest forecast CAGR at 11.71% to 2031.
- By module, vendor onboarding and information management captured 31.98% of 2025 revenues; analytics and reporting is growing fastest at a 10.54% CAGR.
- By geography, North America led with 27.42% share in 2025; Asia-Pacific is set to grow at a 12.94% CAGR to 2031.
Note: Market size and forecast figures in this report are generated using Mordor Intelligence’s proprietary estimation framework, updated with the latest available data and insights as of 2026.
Market Trends and Insights
Drivers Impact Analysis of Vendor Management Software Market*
| Driver | (~) % Impact on CAGR Forecast | Geographic Relevance | Impact Timeline |
|---|---|---|---|
| Need to minimize administrative costs | +2.1% | Global, with higher impact in cost-sensitive SME markets | Short term (≤ 2 years) |
| Rapid adoption of cloud deployment | +2.8% | North America and EU leading, Asia-Pacific accelerating | Medium term (2-4 years) |
| Regulatory emphasis on third-party risk compliance | +1.9% | Global, with EU and US driving strictest requirements | Long term (≥ 4 years) |
| Globalized, multi-tier supply chains complexity | +1.7% | Global, with manufacturing-heavy regions most affected | Medium term (2-4 years) |
| AI-driven predictive vendor risk scoring | +1.2% | North America and Asia-Pacific core, spill-over to EU | Long term (≥ 4 years) |
| ESG and Scope-3 transparency mandates | + 0.9% | EU leading, North America following, Asia-Pacific emerging | Long term (≥ 4 years) |
| Source: Mordor Intelligence | |||
Need to Minimize Administrative Costs
Automating repetitive supplier tasks reduces procurement overhead and frees teams for strategic sourcing. Wefunder saved 1,350 hours annually and USD 416,000 in lifetime costs after automating contract renewals through CloudEagle’s platform. Similar deployments typically cut processing expenses by 20-30% within year one, a result BetterCloud formalizes through its 3x ROI guarantee. As inflation narrows margins, the cost-take-out motive accelerates adoption across industries.
Rapid Adoption of Cloud Deployment
Cloud-native platforms shorten implementation cycles, lower capital outlay, and offer elastic scalability that aligns fees with transaction volume. Choice Hotels International achieved 98.8% accurate cost allocation soon after going live on Finout’s SaaS environment. Real-time collaboration, API-based ERP connectivity, and automatic security patching turn cloud into the default option, especially where IT talent is scarce.
Regulatory Emphasis on Third-Party Risk Compliance
Global rulebooks now demand auditable oversight of suppliers and subcontractors. The Basel Committee’s 12 principles and the EU’s Corporate Sustainability Due Diligence Directive push financial and manufacturing firms toward automated evidence collection.[1]Venminder, “Basel Committee Principles Explained,” venminder.comUS Med-Equip halved HIPAA audit preparation time after rolling out Vanta’s continuous controls monitoring. Meeting such obligations at scale without software has become untenable.
Globalized, Multi-Tier Supply-Chain Complexity
Geopolitical instability and tariff shifts force companies to diversify sourcing, which multiplies onboarding events and real-time performance checks. Johnson Controls connected 800 suppliers across 14 sites using LeanDNA to maintain visibility into inventory risk.[2]LeanDNA, “Johnson Controls Selects LeanDNA,” leandna.com University of California research shows 60% of suppliers worry about tariffs, underscoring demand for dynamic vendor scorecards.
Restraints Impact Analysis of Vendor Management Software Market*
| Restraint | (~) % Impact on CAGR Forecast | Geographic Relevance | Impact Timeline |
|---|---|---|---|
| High implementation and maintenance costs | -1.8% | Global, with higher impact in price-sensitive SME markets | Short term (≤ 2 years) |
| Data-security and privacy concerns | -1.2% | Global, with EU GDPR and US state privacy laws driving concerns | Medium term (2-4 years) |
| Integration complexity with legacy ERP suites | -1.5% | Global, with established enterprises most affected | Medium term (2-4 years) |
| Shortage of vendor-risk talent | -0.7% | Global, with developed markets experiencing acute shortages | Long term (≥ 4 years) |
| Source: Mordor Intelligence | |||
High Implementation and Maintenance Costs
Conexis VMS notes that integration, customization, and data migration can double initial budgets, pushing small firms toward phased rollouts.[3]Conexis VMS, “Hidden Costs of Vendor Management Systems,” conexisvms.comAnnual operational spend covers software development, support, and cybersecurity, yet return on investment typically arrives within 18 months as automated workflows unlock savings.
Integration Complexity with Legacy ERP Suites
Data inconsistency and system compatibility plague older ERP estates. HICX’s supplier-information layer helps widen SAP landscapes without point-to-point spaghetti. Hybrid on-premises and cloud architectures frequently extend timelines, although API-ready SaaS offerings gradually lower the hurdle.
*Our forecasts treat driver/restraint impacts as directional, not additive. The impact forecasts reflect baseline growth, mix effects, and variable interactions.
Vendor Management Software Market Segment Analysis
By Deployment:
Cloud Dominance AcceleratesCloud deployment captured 62.74% of the vendor management software market in 2025 and is forecast to expand at a 12.65% CAGR to 2031. Broad acceptance follows lower upfront spend, faster time-to-value, and the ability to push real-time updates that keep security controls current. Finout’s success at Choice Hotels illustrates the quick wins enterprises expect. In contrast, on-premises models now appeal mainly to organizations with sensitive sovereignty mandates. Integration workloads and AI compute requirements tip the cost-benefit equation further toward cloud. Hybrid paths persist, letting firms retain critical data in-house while exploiting SaaS collaboration and analytics layers. The vendor management software market continues to shift budgets accordingly, a dynamic reinforced by subscription pricing that scales with transaction throughput.
Second-generation SaaS suites also bundle AI engines that predict supplier risk, recommend cost savings, and automate compliance evidence gathering. These capabilities rely on cloud elasticity, encouraging users to sunset bespoke instances. As upgrades arrive automatically, IT teams redirect effort toward strategic data stewardship instead of routine patching. Consequently, cloud remains the anchor as the vendor management software market advances.



By End-User Industry:
Manufacturing Leads Digital TransformationManufacturing held 36.64% of 2025 revenues, reflecting multi-tier supply chains that demand granular visibility into quality, delivery, and ESG metrics. LeanDNA’s rollout at Johnson Controls shows how plant networks benefit from synchronized part, supplier, and inventory data. Inflationary raw-material swings and geopolitical events push producers to diversify sourcing, raising onboarding volumes and reinforcing platform necessity. Retail, while smaller, posts the fastest 10.98% CAGR on the back of omnichannel growth, private-label expansion, and the need to align assortments with consumer demand.
Financial-services uptake accelerates as regulators scrutinize fintech collaborations. Ncontracts found 73% of institutions staffing vendor risk functions with two or fewer employees even while managing 300+ vendors. Healthcare providers prioritize HIPAA-aligned oversight; Vanta’s deployment at US Med-Equip reduced audit prep by 50%. Governments gradually modernize procurement to heighten transparency and supplier diversity, aided by solutions such as BidNet Direct.
By Organization Size:
SMEs Drive Future GrowthLarge enterprises accounted for 74.62% revenue in 2025 because extensive vendor ecosystems and compliance duties require robust feature sets. Still, the SME segment grows fastest at 11.71% CAGR to 2031. Cloud pricing that mirrors usage, pre-configured workflows, and intuitive interfaces remove historical barriers for smaller firms. TYASuite targets this cohort with templated processes that curb implementation times. As supply-chain volatility affects firms of all sizes, owner-managed businesses increasingly recognize that structured vendor management differentiates service levels and cost control. The vendor management software market therefore widens its focus beyond Fortune 1000 accounts.
Smaller teams also value automation to offset limited headcount. Self-service onboarding portals, contract-renewal alerts, and AI-driven spend dashboards allow SMEs to match large-enterprise sophistication without ballooning payroll. Over the forecast horizon, continued feature consumerization and marketplace integrations will embed vendor management into adjacent finance and HR suites, cementing adoption among growth companies.
By Component/Module:
Analytics Drives Strategic ValueVendor onboarding and information management held 31.98% share in 2025. Centralizing supplier master data remains the first step toward effective oversight, making this module a non-negotiable purchase. However, analytics and reporting is the growth star, advancing at 10.54% CAGR through 2031. Omnea’s ROI calculator pegs potential savings at USD 236,591 from analytics-enabled renegotiations. Advanced modules combine predictive risk scoring, spend leakage detection, and scenario modeling, elevating procurement from transactional to strategic.
Contract and performance management gains traction as AI extracts obligations and renewal triggers from unstructured PDFs, reducing legal workload. Compliance modules automate evidence collection for ESG, data-privacy, and industry-specific mandates. Invoice and payment management capabilities close the loop by matching orders, receipts, and invoices, eliminating manual reconciliations. As modules converge, suite providers bundle functionality yet allow incremental activation, letting customers derive value quickly while expanding over time. Such flexibility underpins healthy expansion of the vendor management software market.
Geography Analysis
North America Vendor Management Software Market
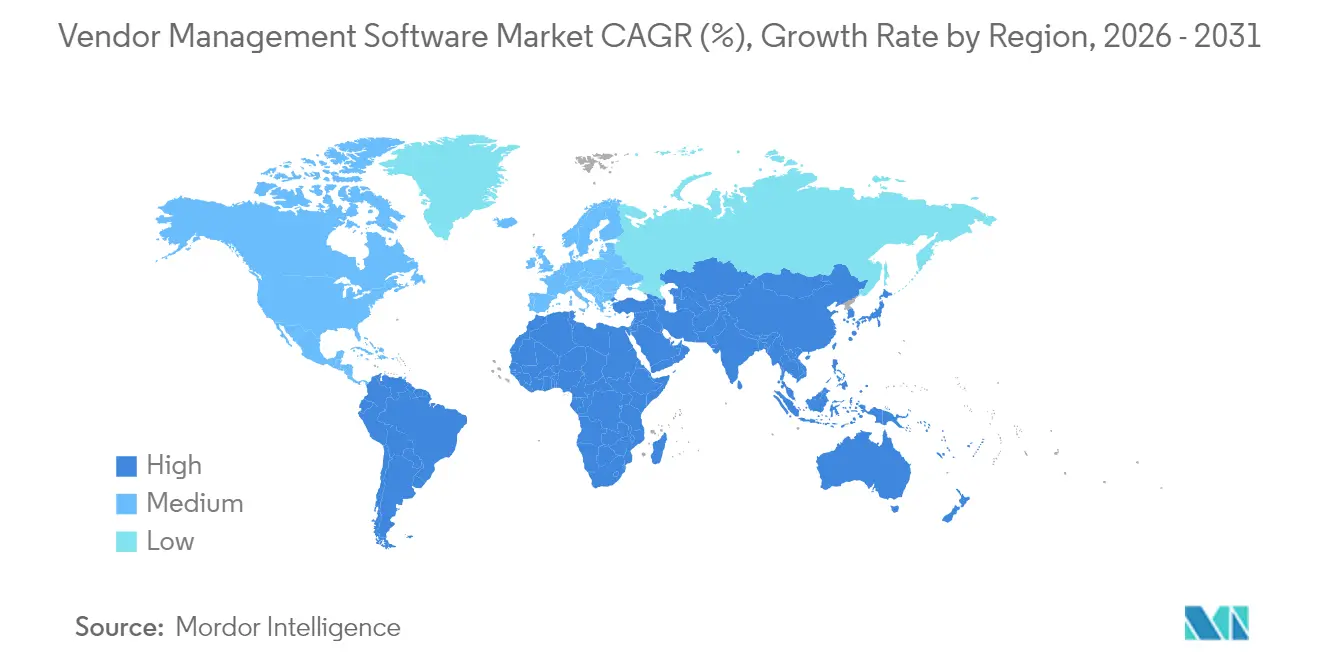
North America retained 27.42% share in 2025 owing to early digital procurement maturity, deep cloud infrastructure, and stringent banking and healthcare regulations that institutionalize vendor-risk workflows. Financial services, in particular, adopt platforms to navigate OCC and CFPB guidance. Continuous innovation from domestic SaaS vendors sustains refresh cycles, further anchoring the region’s lead.
EMEA, APAC and South America Vendor Management Software Market
Asia-Pacific rises as the growth engine with a 12.94% CAGR through 2031. Government-backed digitization programs, burgeoning manufacturing exports, and increasing cyber incidents push organisations to professionalize third-party oversight. Singaporean firms reported over 70% supply-chain cyber breaches, spurring 90% of them to raise risk-management budgets. India’s MSMEs contribute 48% of national exports and rely on modern vendor portals to compete globally. China’s forced-labor compliance drives demand for screening tools that trace sub-tier suppliers. Europe maintains steady growth as ESG and due-diligence directives necessitate automated disclosures. Firms deploy platforms to capture Scope-3 emissions and ethical-sourcing attestations across supply chains. Middle East and Africa along with South America trail in absolute value but display rising adoption as cloud connectivity improves and public-sector modernization funds flow. Across regions, the vendor management software market demonstrates strong correlation to e-procurement maturity and regulatory mandates, setting a clear roadmap for future penetration.

Regulatory Landscape
Third-party and supplier oversight requirements are tightening across finance, critical infrastructure, and government procurement, which is pushing organizations toward auditable vendor controls. In the European Union, the Digital Operational Resilience Act (DORA, Regulation (EU) 2022/2554) formalizes ICT third-party risk management for financial entities, including requirements to maintain a register of information and define exit strategies for critical functions. The DORA subcontracting RTS (Delegated Regulation (EU) 2025/532) entered into force on July 22, 2025, raising expectations for managing subcontracting chains.
In the United States, vendor-management workflows are increasingly shaped by cybersecurity and supply chain clauses in public-sector contracting. Federal acquisition rules and guidance reference NIST SP 800-53 Rev. 5 and supply-chain risk controls, with the GSA maintaining C-SCRM policy under GSAM Subpart 504.70. In 2026, the Department of Veterans Affairs issued VA Directive 6519 (February 2026) to establish Cyber-Supply Chain Risk Management policy for ICTS vendors, and the Department of Defense updated DFARS 252.239-7018 effective May 7, 2026, reinforcing contractor obligations to mitigate supply chain risks for covered IT systems.
Competitive Landscape
The playing field remains moderately fragmented. ERP giants SAP, Oracle, and Microsoft capitalize on embedded customer bases to upsell supplier-management add-ons. Best-of-breed providers like Coupa, Jaggaer, and GEP differentiate through depth, user experience, and rapid innovation cadences. AI-native entrants such as Prevalent, Certa, and AdaptOne challenge incumbents by weaving predictive analytics and generative assistants into core workflows; Prevalent’s “Alfred” virtual advisor embodies this shift.
Consolidation intensifies as customers prefer unified suites. Unimarket’s January 2025 merger with VendorPanel expands source-to-pay breadth, signaling a new round of tuck-ins. Funding inflows sustain disruptive agendas: Tipalti’s USD 150 million raise under JPMorgan backing fuels AI expansion across finance automation. Meanwhile, sector-specific specialists thrive by solving niche pain points—Symplr in hospital compliance, Avetta in contractor safety, and BidNet Direct in public procurement.
Pricing models trend toward usage-based subscriptions with outcome guarantees, exemplified by BetterCloud’s 3x ROI pledge. Vendors invest heavily in API ecosystems, no-code connectors, and certified ERP adaptors to ease integration friction, a key buying criterion amid heterogeneous IT landscapes. Intellectual-property differentiators concentrate on AI explainability, ESG data ingest, and embedded analytics that deliver real-time supplier health indices. Overall, bargaining power remains balanced between buyers and sellers, ensuring continuous innovation without predatory lock-in.
Vendor Management Software Industry Leaders
Intelex Technologies Inc.
MasterControl, Inc.
MetricStream Inc.
SAP SE
IBM Corporation
- *Disclaimer: Major Players sorted in no particular order
Vendor Management Software Market Companies Covered in this Report
- IBM Corporation
- SAP SE
- Coupa Software Inc.
- MasterControl, Inc.
- Intelex Technologies Inc.
- HICX Solutions
- Gatekeeper
- MetricStream Inc.
- Ncontracts LLC
- LogicManager Inc.
- SalesWarp
- Quantivate LLC
- Ivalua
- Jaggaer
- GEP Worldwide
- Oracle Corporation
- Workday Inc.
- Beeline
- Precoro
- Zycus

Market Opportunities and Future Outlook
Multi-framework compliance consolidation is creating whitespace for vendor management platforms that map a single assessment and evidence set across DORA, NIS2, GDPR, and ISO-aligned controls, which helps reduce duplicate questionnaires and fragmented audit trails. In 2026, product activity reflects this direction. Njordium Cyber Group launched a vendor management system positioned to consolidate third-party risk assessments across multiple frameworks (March 2026), and FlowForma introduced FlowAssure to automate vendor risk assessments, route low-risk vendors through automated approvals, and check evidence against frameworks such as NIST CSF 2.0 and SOC 2 (July 2026). These launches point to continued demand for configurable controls libraries, continuous monitoring, and automated evidence capture embedded in onboarding and renewal workflows.
Telecom and large enterprise procurement functions are also investing in supplier risk intelligence and master data governance layers to establish a single source of truth for vendor compliance status across ERP and source-to-pay environments. Exiger being selected by Vodafone Telenor Procurement Company for supplier risk intelligence and third-party risk transformation on its 1Exiger AI platform (May 2026) is a concrete signal of active buying for scalable third-party risk analytics in complex, multi-vendor ecosystems. In parallel, integration-centric programs such as Programmed using Boomi Enterprise Platform and Data Hub to centralize vendor data and compliance records (reported July 2026) highlight an opportunity for vendors with strong API ecosystems, data hubs, and no-code connectors to reduce ERP integration friction while improving audit readiness.
Recent Industry Developments in Vendor Management Software Market
- June 2026: MetricStream announced it was named the top-ranked Category Leader in Enterprise GRC in Chartis Research’s Integrated Governance, Resilience and Compliance Solutions for Financial Services, 2026 report. The positioning reinforces demand for platforms that unify risk, compliance, and resilience workflows, which overlaps with vendor risk and third-party governance requirements in regulated industries.
- March 2026: Intelex partnered with Safety Function and launched the High Energy Control Assessment (HECA) application to support serious injury and fatality prevention programs. The release expands Intelex’s digital compliance content and workflow coverage, strengthening its platform value for organizations managing contractor and supplier safety requirements alongside broader vendor compliance controls.
- March 2025: MasterControl acquired Qualer, a cloud-native asset management company, to add asset tracking, calibration, and maintenance capabilities to its quality and manufacturing platform. The acquisition supports regulated customers that need tighter linkage between supplier quality processes, equipment compliance records, and audit-ready documentation within integrated software environments.


Vendor Management Software Market Report Scope and Research Methodology
Market Definition and Coverage
For this study, the vendor management software market is defined as revenue earned from software platforms that help organizations onboard, evaluate, contract with, and monitor third-party vendors through one system across the vendor life cycle.
Scope exclusions: We exclude pure staffing services, BPO spend, and general-purpose ERP licenses when they are not sold or used as a vendor management software solution.
Segments Covered in This Report
- By Deployment
- Cloud
- On-premise
- By End-user Industry
- Retail
- BFSI
- Manufacturing
- IT and Telecommunications
- Healthcare
- Government and Public Sector
- Other Industries
- By Organization Size
- Large Enterprises
- Small and Medium Enterprises (SMEs)
- By Component / Module
- Vendor Onboarding and Information Management
- Vendor Risk and Compliance Management
- Contract and Performance Management
- Invoice and Payment Management
- Analytics and Reporting
- Other Modules
- By Geography
- North America
- United States
- Canada
- Mexico
- South America
- Brazil
- Argentina
- Rest of South America
- Europe
- Germany
- United Kingdom
- France
- Italy
- Spain
- Rest of Europe
- Asia-Pacific
- China
- Japan
- India
- South Korea
- Australia
- Southeast Asia
- Rest of Asia-Pacific
- Middle East and Africa
- Middle East
- Saudi Arabia
- United Arab Emirates
- Turkey
- Rest of Middle East
- Africa
- South Africa
- Nigeria
- Egypt
- Rest of Africa
- Middle East
- North America
Data Sources, Market Sizing, and Validation
Desk Research
Desk work starts with pinning down the demand pool and the buying triggers for vendor tools, since the term can get mixed up with procurement or risk software. We reviewed public indicators such as US SEC filings, annual reports, investor decks, and product documentation to map typical pricing models, customer types, and module bundling.
To ground the model in repeatable signals, we also used non-paywalled sources such as US Bureau of Labor Statistics data on staffing and HR services activity, World Bank and OECD digital economy indicators, NIST and ISO publications that set expectations for third-party governance, and articles in peer-reviewed supply chain and information systems journals. For cross-checks on company footprint and deal momentum, we used a paid subscription for company financials and intelligence, and a paid patent database to observe filing intensity around supplier analytics and compliance workflow automation. These desk sources are not exhaustive, and many other public references were used for data collection, validation, and clarification during the work.
Primary Interviews and Surveys
Primary inputs came from interviews and surveys with solution users, procurement and third-party risk teams, IT buyers, and implementation partners who see budgets and deployment patterns firsthand. For a global market view, we covered mature buyers and fast-adopting regions so we could test assumptions on renewal rates, cloud migration timing, and module attach across different compliance environments.
Distribution of primary research fieldwork respondents
| Company type | Respondent position | Region |
|---|---|---|
| Top tier: 34% | CXOs: 13% | APAC: 38% |
| Mid tier: 48% | Functional/Unit leaders: 35% | EMEA: 35% |
| Smaller Players: 18% | Managers: 52% | Americas: 27% |
Market-Sizing & Forecasting
The core sizing model uses a top-down build that reconstructs software spend by starting from enterprise adoption levels for vendor governance workflows, and then applying typical per-customer subscription and usage pricing observed in the market. We sized demand by region and rolled it up after checking that the implied spend aligns with the addressable base of organizations that manage large vendor ecosystems.
Key inputs include the share of enterprises formalizing third-party onboarding and performance reviews, cloud versus on-premises deployment mix, average contract length and renewal behavior, module attach rates for contract and compliance workflows, and expected annual price progression for SaaS subscriptions. Where data was thin, we filled gaps using primary guidance on what a normal rollout looks like (number of users, time to value, and phased module activation) and then stress-tested the totals with selective bottom-up checks based on sampled pricing bands multiplied by likely customer counts.
For forecasting, we relied on scenario analysis supported by short time series smoothing on the historical run-rate, since adoption can step up after regulatory or supply chain disruptions. Growth assumptions were adjusted using our calls on budget cycles, vendor risk scrutiny, and the pace of replacing spreadsheets and legacy tools.
Data Validation & Update Cycle
Outputs are checked against independent signals, such as reported software subscription growth patterns, deal sizes discussed in public filings, and the regional spread of buyer activity heard in interviews. If a region or end market shows an outlier jump, the driver is traced back to one assumption, and then it is reworked and re-validated with at least one additional expert touchpoint.
Before sign-off, the model goes through a multi-step review so calculations, currency treatment, and year definitions stay consistent across the workbook. Reports are refreshed annually, and interim updates are made when a material event changes adoption or pricing expectations. Right before delivery, we do a final pass to ensure clients receive the most current view available.
Mordor Intelligence's Vendor Management Software Market Size Compared Against Other Published Estimates
Published market sizes for vendor management software can look far apart, even when they point to the same growth story. In our work, the spread usually comes from what is counted as vendor management software versus adjacent procurement, staffing, or broader governance tools, and from the year used as the starting point.
Key gaps also come from how pricing is treated over time and how geography is rolled up, since currency timing and cloud subscription ramp can shift the yearly snapshot. Renewal assumptions, the mix of large versus mid-sized customers, and whether services revenue is included can also shift the total before forecasting even starts. Deal-size ranges and renewal signals are the evidence checks that keep Mordor Intelligence's estimate anchored to recurring software revenue tied to vendor onboarding, performance, and compliance workflows.
Benchmark comparison
| Source | Market Size | Gaps in Research Methodology |
|---|---|---|
| Mordor Intelligence | USD 11.47 B (2026) | |
| Independent Research Publisher A | USD 5.70 B (2024) | Uses an earlier base year and appears to apply a narrower revenue capture, which can undercount enterprise subscription renewals and module expansions that show up after initial rollout. |
| Trade Journal B | USD 8.99 B (2023) | Relies on a historical snapshot that may blend vendor management software with nearby categories differently, and the higher growth rate assumption can change what is implied for later years. |
Looking at the three figures together, most of the difference is explained by timing and by where each source draws the line around adjacent software and related services. Our approach stays traceable because the total is rebuilt from adoption, pricing, and renewal logic that can be checked and re-tested as new market signals appear.


Key Questions Answered in the Report
What is the current value of the vendor management software market?
The vendor management software market size stands at USD 11.47 billion in 2026 and is projected to reach USD 18.76 billion by 2031.
Which deployment model is growing fastest?
Cloud deployment leads both in share and growth, posting a 12.65% CAGR through 2031 due to lower upfront costs and faster implementation.
Why are manufacturing firms' major adopters?
Manufacturers manage complex, multi-tier supply chains that require real-time supplier performance data, giving them 36.64% market share in 2025.
What factors restrain adoption among small companies?
High implementation costs and integration complexity with legacy ERP suites remain key hurdles, though SaaS pricing models are narrowing the gap.
Which region will drive future demand?
Asia-Pacific is forecast to expand at a 12.94% CAGR, propelled by government digitization initiatives, rising exports, and heightened cyber-risk awareness.
Page last updated on:


 Your data is secure and never sold or shared.


