Software Development Market Size and Share
Market Overview
| Study Period | 2020 - 2031 |
|---|---|
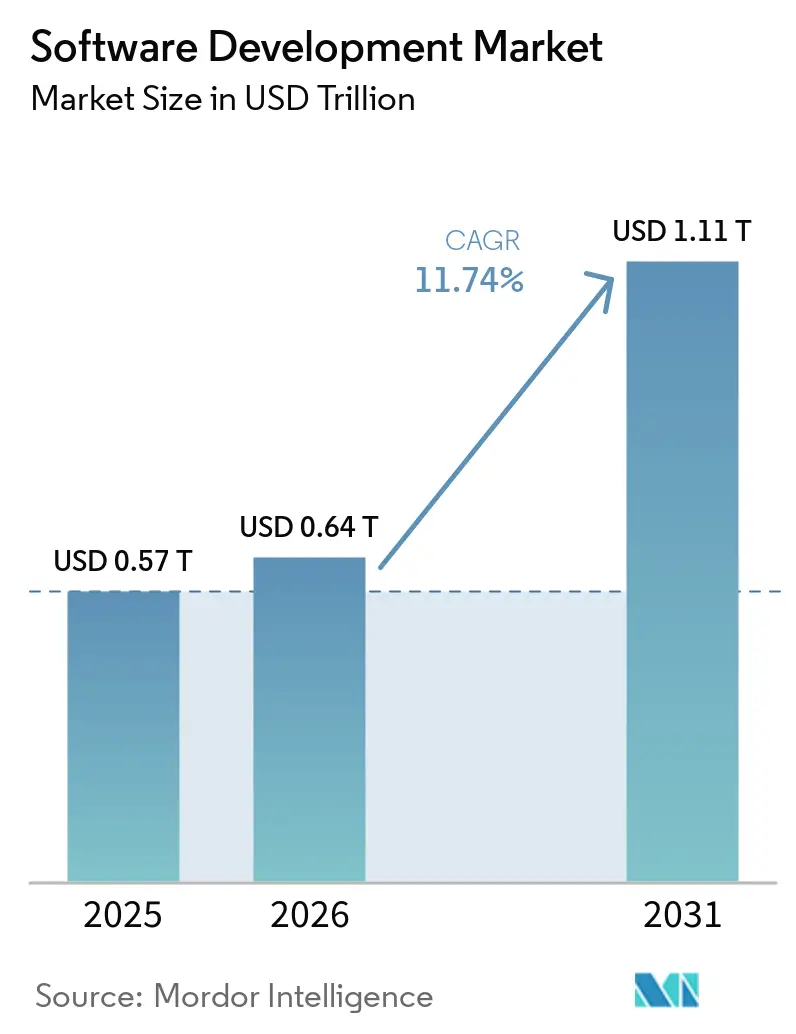
| Market Size (2026) | USD 0.64 Trillion |
| Market Size (2031) | USD 1.11 Trillion |
| Growth Rate (2026 - 2031) | 11.74% CAGR |
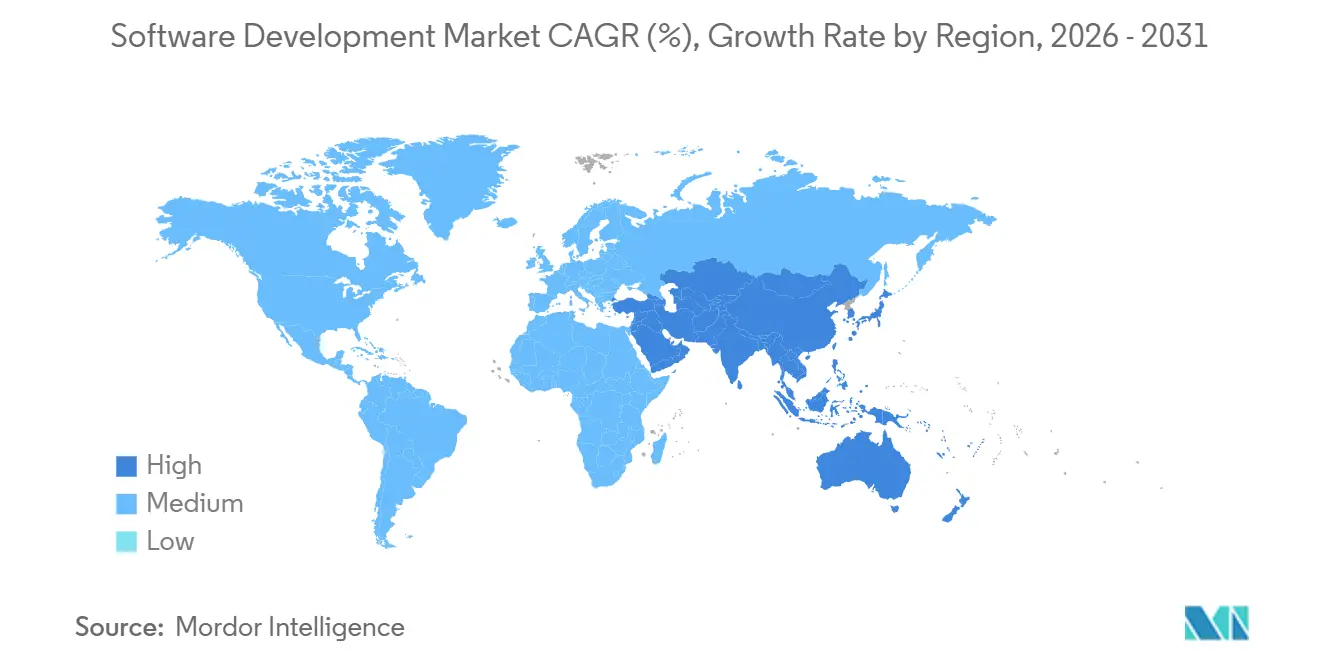
| Fastest Growing Market | Asia Pacific |
| Largest Market | North America |
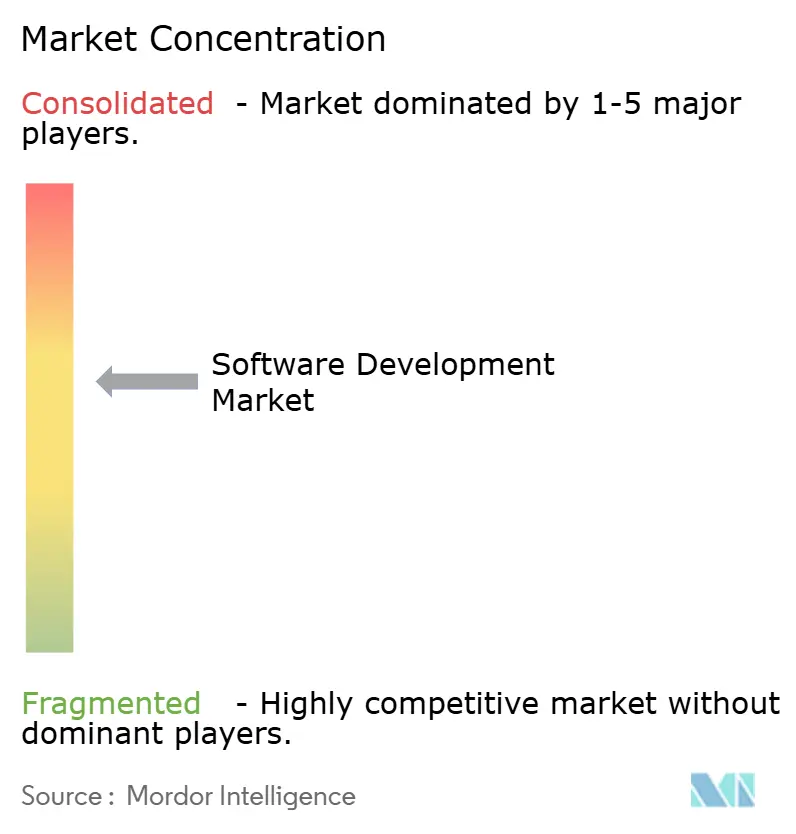
| Market Concentration | Medium |
Major Players *Disclaimer: Major Players sorted in no particular order Image © Mordor Intelligence. Reuse requires attribution under CC BY 4.0. | |
Software Development Market Analysis by Mordor Intelligence
The Software Development Market size is expected to grow from USD 0.57 trillion in 2025 to USD 0.64 trillion in 2026 and is forecast to reach USD 1.11 trillion by 2031 at 11.74% CAGR over 2026-2031. The acceleration stems from structural changes in how enterprises architect, secure, and deploy applications rather than from incremental tooling upgrades. Generative AI code assistants absorb routine boilerplate tasks, moving senior engineers toward higher-order system design, while cloud-native frameworks remove the capital burden tied to on-premise infrastructure. At the same time, escalating cyber-security threats aimed at continuous-integration and continuous-deployment pipelines compel organizations to embed security controls at each stage, raising both development velocity and compliance costs. Taken together, these forces redefine value creation across the software development market.
Key Report Takeaways
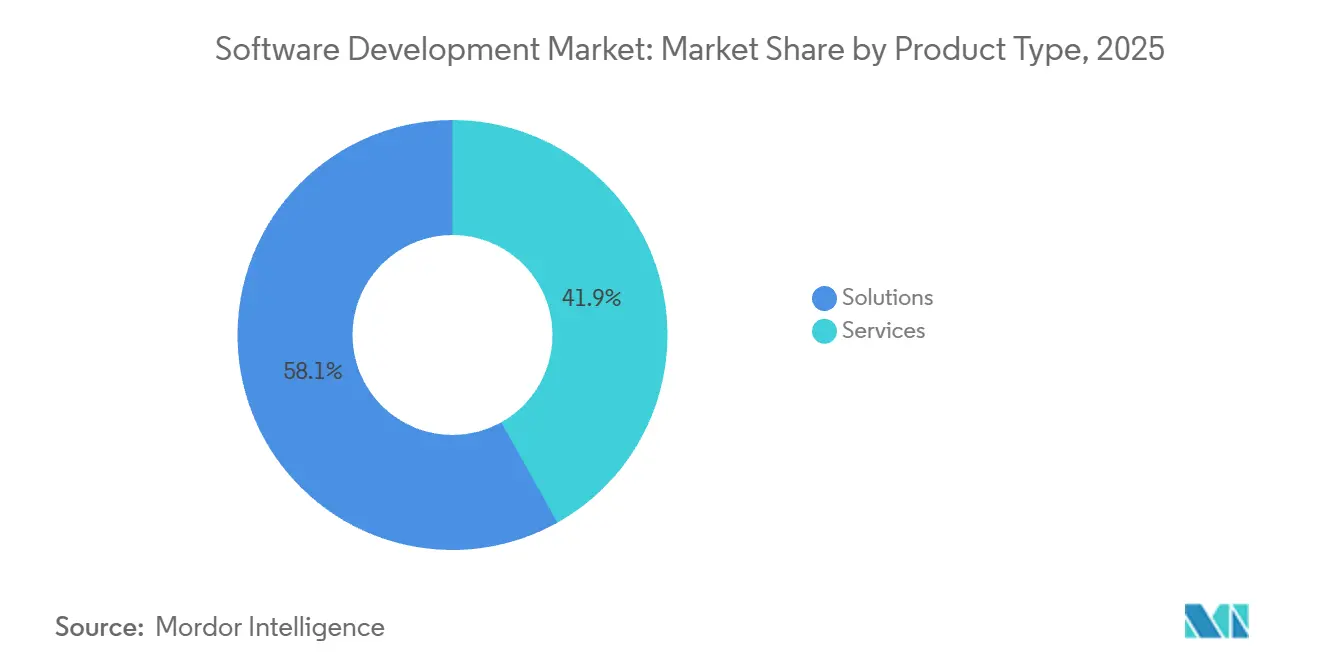
- By product type, Solutions commanded 58.12% of revenue in 2025, whereas Services are expanding at a 13.35% CAGR to 2031.
- By deployment type, Cloud accounted for 71.26% of revenue in 2025, and the segment is forecast to expand at a 12.17% CAGR through 2031.
- By organization size, Large enterprises held 62.41% of spending in 2025, while small and medium enterprises are advancing at a 13.54% CAGR.
- By end-user vertical, IT and telecommunication led with a 21.36% share in 2025; healthcare is forecast to expand at a 13.28% CAGR.
- By geography, North America captured 38.13% revenue in 2025, whereas Asia Pacific is on course for a 12.47% CAGR to 2031.
Note: Market size and forecast figures in this report are generated using Mordor Intelligence’s proprietary estimation framework, updated with the latest available data and insights as of January 2026.
Global Software Development Market Trends and Insights
Drivers Impact Analysis*
| Driver | (~) % Impact on CAGR Forecast | Geographic Relevance | Impact Timeline |
|---|---|---|---|
| Low-code and no-code adoption surge | +2.3% | Global, early traction in North America and Europe | Medium term (2-4 years) |
| Cloud-native and serverless development | +2.8% | Global, led by North America and Asia Pacific | Short term (≤ 2 years) |
| Enterprise digital-transformation budgets | +2.1% | North America, Europe, select Asia Pacific markets | Medium term (2-4 years) |
| Gen-AI code assistants scaling productivity | +2.5% | Global, concentrated in North America and Europe | Short term (≤ 2 years) |
| Sustainability-driven green-coding mandates | +0.9% | Europe and North America, emerging in Asia Pacific | Long term (≥ 4 years) |
| AI-augmented DevSecOps integration | +1.8% | Global, regulatory push in Europe and North America | Medium term (2-4 years) |
| Source: Mordor Intelligence | |||
Low-Code and No-Code Adoption Surge
Enterprises deploy low-code and no-code platforms to close the widening gap between application demand and available developer capacity. Microsoft Power Platform surpassed 20 million monthly active users in 2024, proving that business analysts can now build workflow automations without hand-coding.[1]Microsoft Corporation, “Investor Relations,” MICROSOFT.COM Capital is flowing in the same direction. OutSystems secured USD 150 million in Series D financing in early 2024 to enlarge its low-code portfolio, signaling durable investor confidence. These platforms abstract infrastructure complexity and auto-generate boilerplate, accelerating prototyping. Governance risk persists, however, because “citizen developers” sometimes bypass IT controls, creating shadow applications that security teams then need to audit. Even with that drawback, low-code provides a net 2.3 percentage-point lift to the market CAGR, most visible within mid-market firms that lack deep engineering resources.
Cloud-Native and Serverless Development
Cloud-native architectures decouple application logic from hardware, letting teams scale workloads elastically and pay strictly for consumed compute. AWS Lambda processed trillions of requests in 2024, marking the mainstream shift toward event-driven, serverless functions. Kubernetes adoption also remains strong, with more than seven million developers contributing to its ecosystem in 2024. Financial institutions re-architect monolithic systems into microservices to meet real-time payment requirements, a multi-year journey demanding cloud-native expertise. The result is a 2.8 percentage-point boost to the CAGR that blends infrastructure savings with elevated services spending on migration and observability.
Enterprise Digital-Transformation Budgets
Digital-transformation spending continues despite macro headwinds because executives view software modernization as strategic, not discretionary. Accenture generated USD 17.7 billion in technology consulting revenue for fiscal 2024, heavily weighted toward cloud migration and application re-platforming. In parallel, the European Union’s Digital Decade targets 75% of enterprises using cloud, AI, and big data by 2030, tightening the policy tailwind. Sector-specific mandates add momentum; open-banking APIs in finance and interoperability rules in healthcare both require modular software. Collectively, those forces contribute 2.1 percentage points to the CAGR, with North America and Europe bearing the largest impact.
Gen-AI Code Assistants Scaling Productivity
Generative AI assistants now autocomplete functions, propose refactors, and create unit tests, compressing the rhythm of day-to-day coding. GitHub Copilot exceeded 1.8 million paid subscribers in 2024, and internal trials showed a 55% faster task completion rate for users. AWS CodeWhisperer offers real-time security scans alongside suggestions, blending productivity with compliance. While models trained on public repositories can surface code carrying restrictive licenses, layered validation mitigates that risk. The net result is a 2.5 percentage-point lift in the CAGR, driven by higher developer throughput and faster release cadences.
Restraints Impact Analysis*
| Restraint | (~) % Impact on CAGR Forecast | Geographic Relevance | Impact Timeline |
|---|---|---|---|
| Escalating cyber-security threats | -1.4% | Global, acute in North America and Europe | Short term (≤ 2 years) |
| Global shortage of senior developers | -1.7% | Global, most severe in North America and Europe | Medium term (2-4 years) |
| Rising compute energy-costs for AI builds | -0.6% | Global, higher in regions with elevated electricity costs | Medium term (2-4 years) |
| License-model shifts in open-source ecosystems | -0.8% | Global, affecting enterprises with heavy open-source usage | Short term (≤ 2 years) |
| Source: Mordor Intelligence | |||
Escalating Cyber-Security Threats
Supply-chain attacks now target continuous-integration pipelines and third-party dependencies. The SolarWinds breach, disclosed in 2020 but still echoing through 2024, showed how compromised build tools can infect thousands of downstream customers. The Log4j vulnerability forced emergency patching across millions of Java applications, underscoring the fragility of ubiquitous open-source libraries. Enterprises now mandate software bill of materials attestations and cryptographic signing of artifacts, adding steps that lengthen release cycles. Compliance frameworks like the EU Cyber Resilience Act further raise liability, imposing a 1.4 percentage-point drag on CAGR.
Global Shortage of Senior Developers
Demand for seasoned engineers consistently outpaces supply. The U.S. Bureau of Labor Statistics forecasts 25% employment growth for software developers between 2022 and 2032, far above the national average.[2] U.S. Bureau of Labor Statistics, “Occupational Outlook Handbook,” BLS.GOV Median pay hit USD 127,260 in 2024, and senior architects command even higher compensation. European companies face parallel shortages, exacerbated by restrictive immigration policies. Firms offset gaps through offshoring and AI pair-programming, yet complex system design still requires human expertise, translating into a 1.7 percentage-point CAGR headwind.
*Our forecasts treat driver/restraint impacts as directional, not additive. The impact forecasts reflect baseline growth, mix effects, and variable interactions.
Segment Analysis
By Product Type: Services Outpace Solutions on Integration Complexity
Solutions generated 58.12% revenue in 2025, spanning mobile-based and web-based platforms that enterprises license or subscribe to. Mobile-oriented offerings ride global smartphone penetration, letting field technicians, sales teams, and consumers transact on handheld devices. Progressive web applications blur boundaries between native apps and browser experiences, lowering the cost of supporting multiple operating systems. Web-based solutions remain the backbone for back-office functions such as enterprise resource planning and customer relationship management, leveraging mature frameworks and rich plugin ecosystems.
Services, however, are expanding at a 13.35% CAGR to 2031. Purchasing software increasingly marks only the first stage; integration with legacy estates, data migration, user training, and security hardening demand specialized expertise. Consulting giants and regional system integrators absorb that workload, bundling managed services, infrastructure oversight, and continuous improvement into multi-year contracts. The cadence underscores a shift where differentiation rests less on feature checklists and more on implementation quality across the broader software development market.


By Deployment Type: Cloud Dominance Accelerates as On-Premise Shrinks
Cloud deployment captured 71.26% revenue in 2025 and is advancing at 12.17% as enterprises pivot toward elastic scalability and lower capital expense. Hyperscalers (Amazon Web Services, Microsoft Azure, and Google Cloud Platform) collectively invested more than USD 150 billion in data-center infrastructure during 2024, unlocking global regions and superior network latency. Managed services handle patching, backup, and disaster recovery, allowing internal teams to zero in on application logic. The software development market share tied to cloud is therefore poised to deepen every year.
On-premise estates continue to recede as firms exit data-center leases, yet hybrid models endure in sectors requiring ultra-low latency or strict data residency. Sovereign clouds satisfy public-sector rules by locating hardware within national borders. Even so, the cloud trajectory remains unmistakable, buttressed by re-platforming of legacy workloads and a wave of greenfield applications born directly in serverless or containerized form.
By Organization Size: SMEs Close the Capability Gap with Cloud-Native Tools
Large enterprises retained 62.41% of spending in 2025, using deep budgets to fund custom development and negotiate volume discounts. Yet small and medium enterprises, expanding at 13.54% CAGR, increasingly harness subscription pricing and pay-as-you-go infrastructure to bypass upfront capital hurdles. Platforms such as Shopify and Salesforce Essentials democratize advanced commerce and CRM workflows within days. The software development market size allocated to SMEs thus grows faster than any other organization bracket.
Remote-work norms further lower adoption barriers; a regional distributor can spin up cloud collaboration suites without complex virtual-private-network configurations. Embedded finance APIs widen revenue streams, letting retailers natively offer payments or lending, while AI-powered forecasting tools bring enterprise-grade analytics to the long tail. As a result, SMEs are no longer mere followers; they are now active contributors to innovation curves that used to be defined by Fortune 500 budgets.

By End-User Vertical: Healthcare Leads Growth on Interoperability Mandates
IT and telecommunication entities led with 21.36% spending in 2025, investing in network-function virtualization and software-defined networking to manage 5G traffic surges. However, healthcare is the fastest-growing vertical at a 13.28% CAGR through 2031, fueled by electronic health record modernization and telemedicine adoption. The U.S. 21st Century Cures Act enforces standardized APIs for data exchange, driving a structural shift toward modular, FHIR-compliant systems.[3]U.S. Department of Health and Human Services, “21st Century Cures Act,” HHS.GOV Telehealth volumes remain well above pre-pandemic baselines, sustaining demand for secure video, e-prescription, and remote monitoring solutions.
Financial-service organizations re-platform to support real-time payments and open-banking frameworks, maintaining dual stacks during migration. Manufacturing invests in Industrial Internet of Things software for predictive maintenance, reducing unplanned downtime and maximizing asset life. Media and entertainment companies streamline content delivery and digital rights management to counter piracy. Government and defense agencies modernize mission-critical systems under zero-trust mandates, evidencing that every vertical now treats software as a core strategic lever.
Geography Analysis
North America commanded 38.13% revenue in 2025 and continues to benefit from a dense concentration of Fortune 500 headquarters, venture capital, and hyperscale cloud infrastructure. Zero-trust architecture mandates by the United States federal government create steady procurement opportunities. Canada leverages favorable immigration policies to attract skilled talent, while Mexico’s near-shore outsourcing sector gains traction for U.S. clients seeking minimal time-zone friction. Data-privacy statutes like the California Consumer Privacy Act ripple through product design, enforcing consent management and data-subject rights across the region.
Asia Pacific is poised to grow at 12.47% through 2031, the fastest regional CAGR. India’s software services exports hit USD 194 billion in fiscal 2024, with firms such as Tata Consultancy Services and Infosys fulfilling cloud migration and AI-integration needs. Digital-government programs expand broadband and digital-payment usage, expanding domestic demand for cloud applications. China’s emphasis on sovereign software drives investment in homegrown databases and development tools, reducing Western dependency. Japan pursues smart-manufacturing, while Australia and South Korea pour capital into 5G and smart-city infrastructure. Diverse regulatory landscapes—from China’s data-localization laws to Australia’s privacy frameworks—compel vendors to localize compliance modules, yet the region remains the largest incremental growth engine within the software development market.
Europe, South America, Middle East, and Africa comprise the remainder. Europe’s General Data Protection Regulation and proposed AI Act impose privacy-by-design and algorithmic transparency requirements, raising compliance costs but also stimulating demand for security-focused development tooling. South America benefits from rising internet penetration, with Brazil leading regional SaaS uptake. Middle-Eastern economies like Saudi Arabia and the United Arab Emirates launch ambitious smart-city and e-government programs. Africa’s market remains nascent but accelerates as mobile broadband extends to underserved populations, with Kenya and South Africa forming regional innovation hubs.

Competitive Landscape
The software development market shows moderate fragmentation. Hyperscalers Microsoft, Amazon Web Services, and Google control the underlying infrastructure and offer integrated development environments, AI code assistants, and managed Kubernetes, effectively locking customers into single-vendor ecosystems. Enterprises adopting Azure or AWS enjoy unified authentication, storage, and analytics, yet face rising switching costs as workloads multiply.
DevOps specialists Atlassian and GitLab focus on collaboration, version control, and CI/CD orchestration, competing on simplicity and open-source compatibility. Salesforce and ServiceNow target line-of-business users with verticalized low-code platforms that embed workflow automation. Oracle and SAP preserve strongholds in enterprise resource planning, though both re-architect legacy suites into microservices and pursue subscription revenue. NVIDIA, despite limited direct software revenue, holds strategic influence via CUDA and machine-learning frameworks, shaping the direction of AI-enhanced development.
White-space opportunities cluster around AI-powered security automation and sustainability tooling that measures code energy consumption. Start-ups embed threat detection directly into repositories, offering real-time remediation. License turbulence in open-source ecosystems, illustrated by HashiCorp’s 2023 switch to a business-source license and the subsequent OpenTofu fork, introduces uncertainty, encouraging vendors to provide commercially supported alternatives. Competitive intensity will escalate as generative AI assistants commoditize routine coding, shifting differentiation toward system design, governance, and cross-cloud interoperability.
Software Development Industry Leaders
Microsoft Corporation
Amazon.com Inc. (AWS)
Google LLC
IBM Corporation
Accenture plc
- *Disclaimer: Major Players sorted in no particular order

Recent Industry Developments
- January 2026: Microsoft started rolling out a preview of its Azure Quantum Elements platform, aiming to accelerate quantum-inspired optimization workflows for complex supply-chain simulations.
- October 2025: Microsoft made GitHub Copilot Enterprise generally available, adding organization-wide code suggestions, security scanning, and compliance reporting.
- September 2025: Amazon Web Services launched Amazon Q Developer, a generative AI assistant embedded across AWS consoles.
- August 2025: Salesforce finalized a USD 1.9 billion acquisition of Own Company, expanding data-protection capabilities for SaaS customers.


Research Methodology Framework and Report Scope
Market Definitions and Key Coverage
Our study defines the software development market as all revenue generated worldwide from planning, designing, coding, testing, deploying, and maintaining bespoke or packaged application software, inclusive of project-based professional services and ongoing managed development contracts. Activities tied purely to hardware supply, stand-alone software license resale, or generic IT support sit outside this boundary.
Pure play hardware sales, shrink-wrapped off-the-shelf licenses, and generic help-desk outsourcing are not counted.
Segmentation Overview
- By Product Type
- Solutions
- Mobile-based
- Web-based
- Services
- Solutions
- By Deployment Type
- On-premise
- Cloud
- By Organization Size
- Small and Medium Enterprises (SMEs)
- Large Enterprises
- By End-User
- BFSI
- Media and Entertainment
- Government and Defense
- IT and Telecommunication
- Healthcare
- Manufacturing
- Other End-Users
- By Geography
- North America
- United States
- Canada
- Mexico
- South America
- Brazil
- Argentina
- Rest of South America
- Europe
- United Kingdom
- Germany
- France
- Spain
- Italy
- Rest of Europe
- Asia-Pacific
- China
- India
- Japan
- Australia
- South Korea
- Rest of Asia-Pacific
- Middle East
- Saudi Arabia
- United Arab Emirates
- Turkey
- Rest of Middle East
- Africa
- South Africa
- Kenya
- Rest of Africa
- North America
Detailed Research Methodology and Data Validation
Primary Research
We supplement desk work through structured conversations with software engineering leads, procurement managers, and regional trade-body representatives in North America, Europe, Asia-Pacific, and key emerging hubs. These interviews test price assumptions, project duration norms, cloud adoption inflection points, and talent availability, letting us tighten model variables flagged as uncertain during secondary review.
Desk Research
Mordor analysts begin with publicly available macro and industry datasets from organizations such as the World Bank ICT indicators, Eurostat's Digital Economy statistics, the US Bureau of Labor Statistics, GitHub's Octoverse developer census, and UN COMTRADE software-related trade codes, which outline employment, wage, and export baselines across regions. Company filings, investor presentations, and association portals (for example, NASSCOM, BSA, and OECD digital economy briefs) add context on pricing models, contract structures, and regional policy.
Paid repositories are tapped sparingly. D&B Hoovers supplies revenue splits for listed and privately held vendors, while Dow Jones Factiva helps us follow large project wins and M&A signals that influence average deal values. This list is indicative; many other sources support data collection and validation.
Market-Sizing & Forecasting
A top-down build starts with national software output and IT-services spend; these pools are then filtered by the share attributable to custom development, product engineering, and enhancement contracts. Select bottom-up cross-checks, supplier roll-ups, sampled average selling price × project volume, and channel checks ensure internal consistency before final adjustments. Key drivers in the model include developer wage inflation, enterprise digital-transformation budgets, cloud-native workload penetration, low-/no-code adoption rates, and the share of AI-assisted coding hours. Multivariate regression combined with scenario analysis projects each driver to 2030; parameters are stress-tested with our expert panel before locking the forecast.
Data Validation & Update Cycle
Outputs pass a three-layer review: automated variance scans flag anomalies, senior analysts reconcile gaps, and a final peer audit precedes sign-off. Reports refresh annually, with mid-cycle updates whenever M&A, regulatory, or macro shocks alter the baseline; a fresh validation sweep is performed just before client delivery.
Why Mordor's Software Development Baseline Commands Reliability
Published figures often diverge because firms carve different slices of the broader IT pie, apply varying pricing ladders, or refresh their models on dissimilar cadences.
Key gap drivers include some studies that bundle packaged software license revenue, others that restrict scope to custom projects, a few that apply aggressive cloud cost-deflation curves, while Mordor adopts a balanced wage-plus-productivity trajectory, and refresh cycles range from biennial to annual, whereas Mordor revisits inputs every twelve months with interim triggers.
Benchmark comparison
| Market Size | Anonymized source | Primary gap driver |
|---|---|---|
| USD 0.57 Tn (2025) | Mordor Intelligence | - |
| USD 0.73 Tn (2024) | Global Consultancy A | Includes packaged software licensing and maintenance revenue |
| USD 0.50 Tn (2025) | Trade Journal B | Counts only project-based services, excludes managed enhancement contracts |
| USD 0.053 Tn (2025) | Industry Association C | Focuses solely on custom solutions, omits off-the-shelf adaptation and tooling work |
The comparison shows that once scope and variable choices are aligned, Mordor's disciplined mix of timely desk evidence, field validation, and recurring audits offers decision-makers a balanced, transparent baseline they can confidently build upon.


Key Questions Answered in the Report
What is the projected size of the software development market by 2031?
The software development market size is expected to reach USD 1.11 trillion by 2031.
Which region is forecast to grow the fastest through 2031?
Asia Pacific is projected to post a 12.47% CAGR, the highest among all geographies.
Why are services growing faster than solutions in software development?
Enterprises increasingly need integration, migration, and security hardening expertise after purchasing software, driving services to a 13.35% CAGR through 2031.
Which vertical shows the quickest expansion in spending?
Healthcare leads growth with a 13.28% CAGR as electronic health record modernization and telehealth adoption accelerate.
How significant is cloud deployment within current spending?
Cloud captured 71.26% of revenue in 2025 and continues to grow at a 12.17% CAGR as organizations migrate away from on-premise data centers.
What are the main challenges restraining market growth?
Escalating cyber-security threats and a global shortage of senior developers together subtract roughly 3.1 percentage points from the forecast CAGR.
Page last updated on:


