Market Overview
| Study Period | 2020 - 2031 |
|---|---|
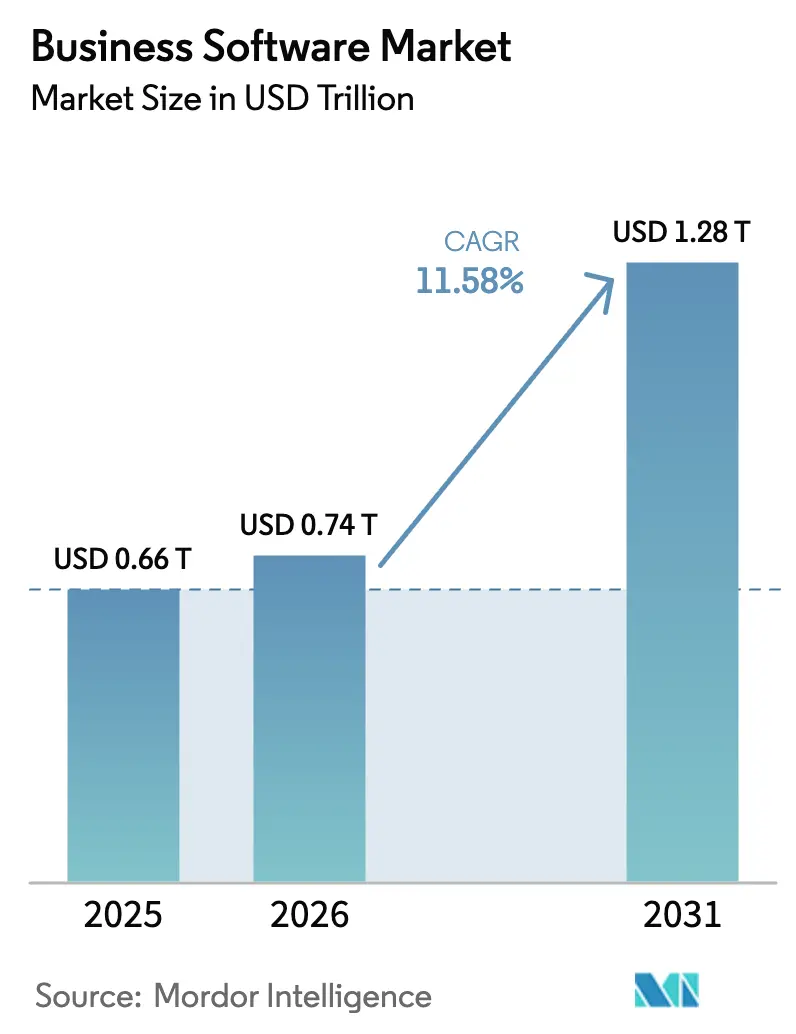
| Market Size (2026) | USD 0.74 Trillion |
| Market Size (2031) | USD 1.28 Trillion |
| Growth Rate (2026 - 2031) | 11.58% CAGR |
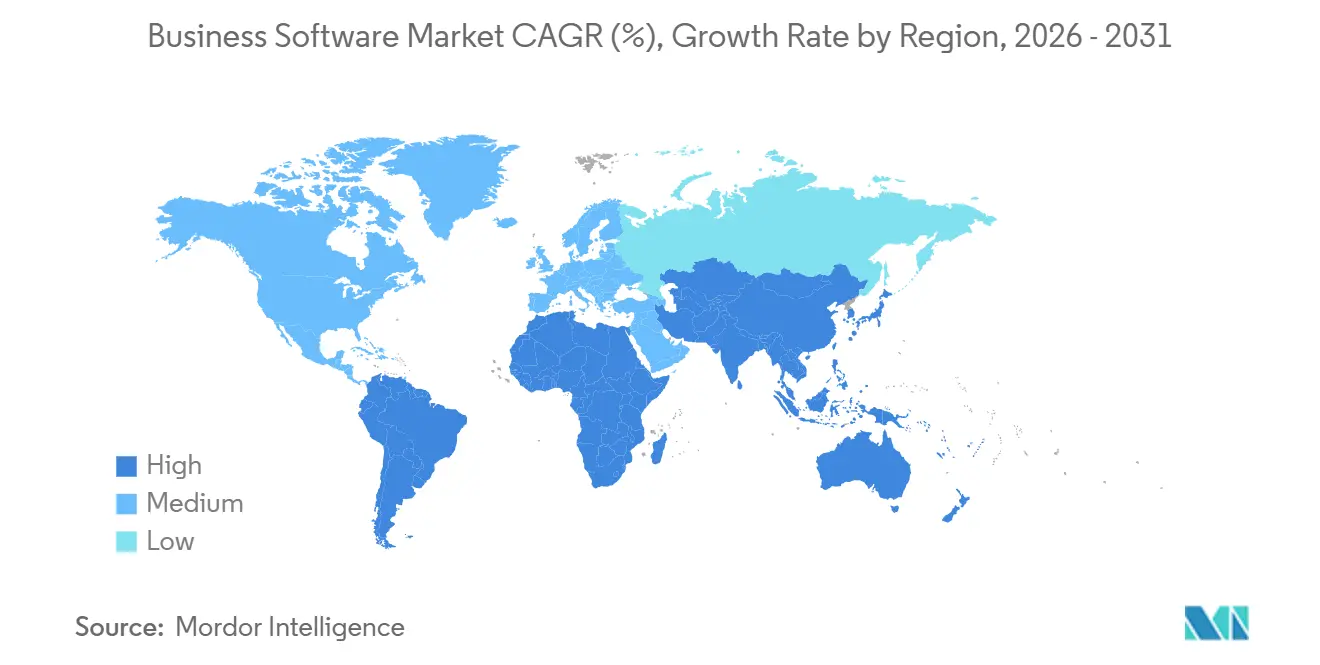
| Fastest Growing Market | Africa |
| Largest Market | North America |
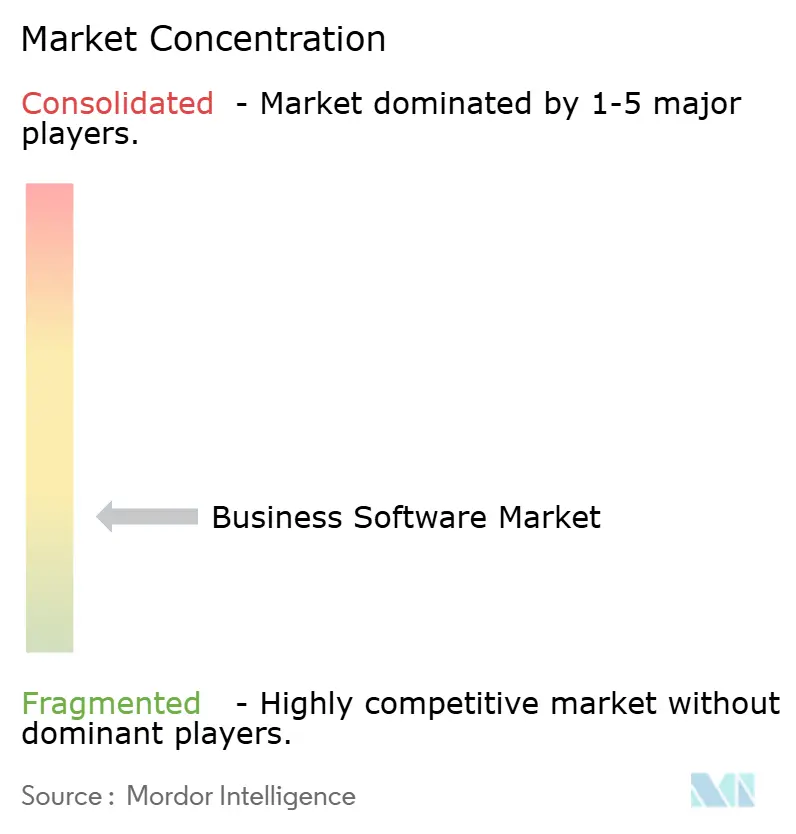
| Market Concentration | Low |
Major Players *Disclaimer: Major Players sorted in no particular order Image © Mordor Intelligence. Reuse requires attribution under CC BY 4.0. | |
Business Software Market Analysis by Mordor Intelligence
The Business Software Market size was valued at USD 0.66 trillion in 2025 and is estimated to grow from USD 0.74 trillion in 2026 to reach USD 1.28 trillion by 2031, at a CAGR of 11.58% during the forecast period (2026-2031). Strong demand for consumption-based subscriptions, the shift to cloud-first deployments, and rapid advances in embedded artificial intelligence are reshaping procurement from capital expenditure to operating expense. Vendors are racing to bundle generative copilots into everyday workflows, which is tightening lock-in for incumbents while opening white-space opportunities for vertical specialists. Low-code platforms are spreading citizen development beyond IT, while unified data fabrics are resolving integration bottlenecks that previously slowed analytics programs. At the same time, price pressure from open-source alternatives and cloud-cost optimization programs is forcing vendors to justify every feature through measurable productivity or compliance gains.
Key Report Takeaways
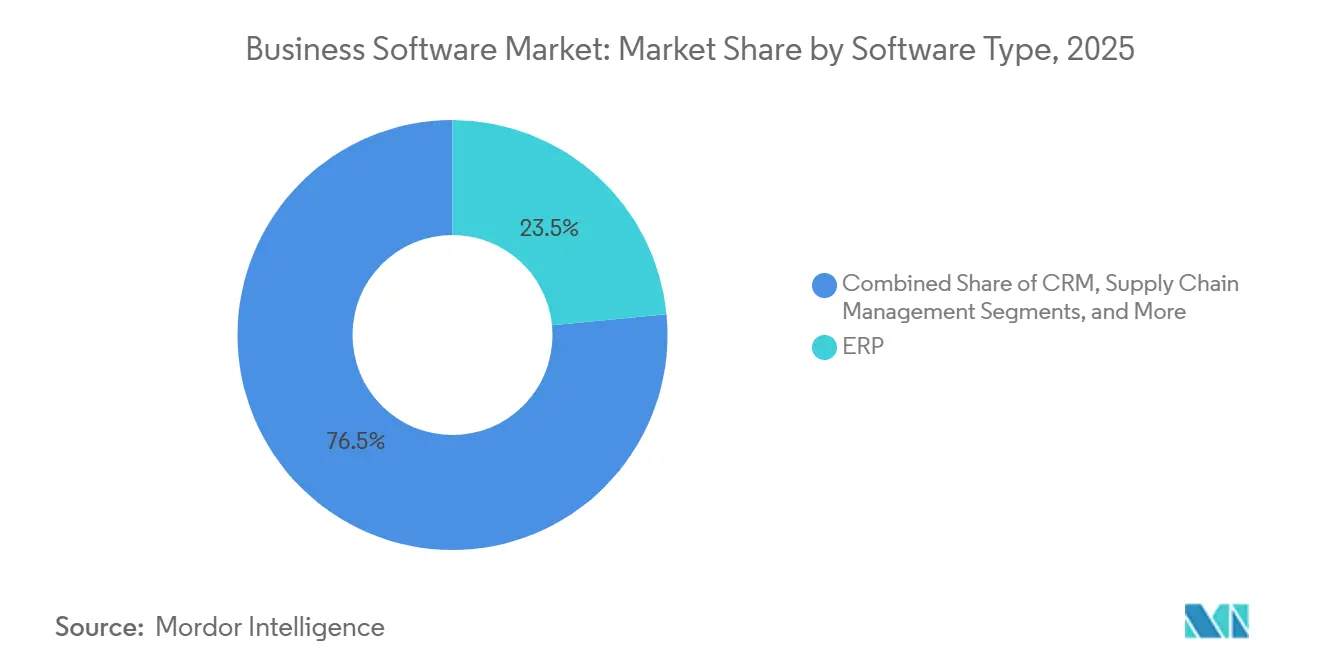
- By software type, enterprise resource planning led with 23.46% of the Business software market share in 2025, while low-code platforms are forecast to expand at a 12.01% CAGR through 2031.
- By deployment, cloud commanded 82.14% of the Business software market size in 2025; edge-enabled deployments are projected to log the highest CAGR at 14.2% over 2026-2031.
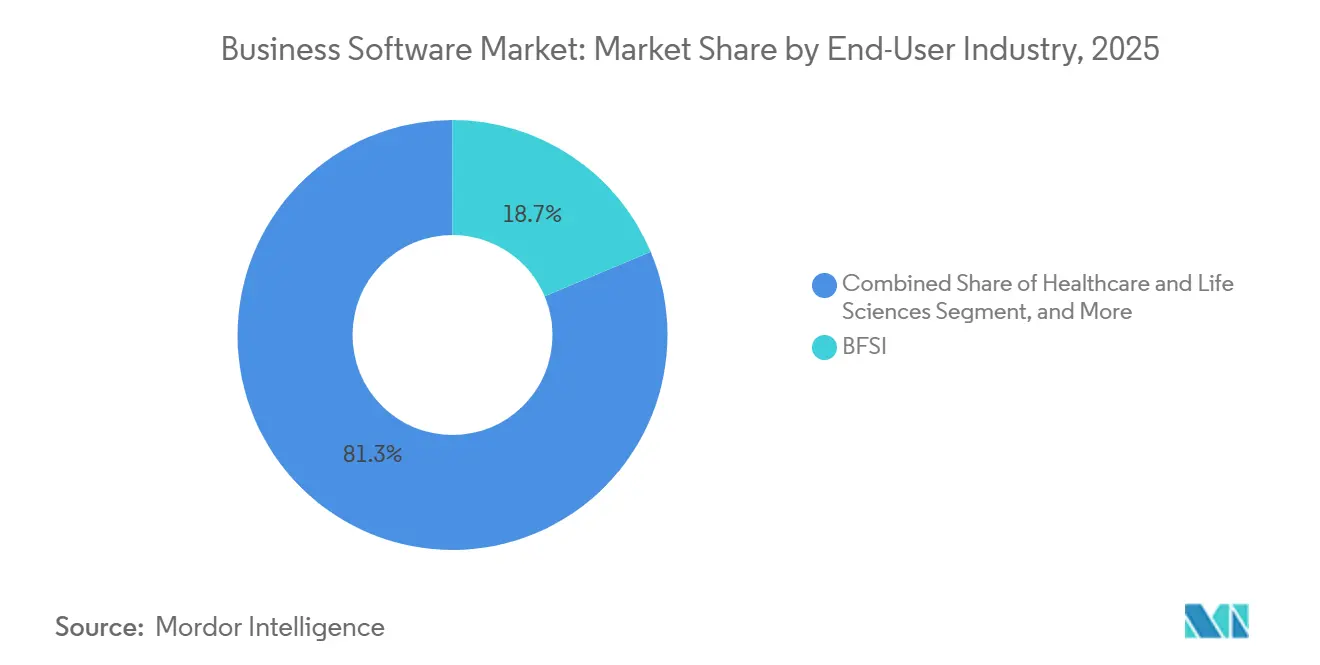
- By end-user industry, banking, financial services, and insurance held 18.67% revenue share in 2025, whereas healthcare and life sciences are advancing at a 13.18% CAGR to 2031.
- By organization size, large enterprises accounted for 61.83% of the Business software market size in 2025, but small and medium enterprises are growing faster at 12.14% CAGR through 2031.
- By Geography, North America retained 36.92% share in 2025, while Africa is projected to register the strongest regional CAGR at 12.89% during 2026-2031.
Note: Market size and forecast figures in this report are generated using Mordor Intelligence’s proprietary estimation framework, updated with the latest available data and insights as of 2026.
Global Business Software Market Trends and Insights
Drivers Impact Analysis*
| Driver | (~) % Impact on CAGR Forecast | Geographic Relevance | Impact Timeline |
|---|---|---|---|
| AI-Powered Workflow Automation Adoption | +2.8% | Global, weighted to North America and Europe | Medium term (2-4 years) |
| Shift to Subscription SaaS Revenue Models | +2.5% | Global | Long term (≥ 4 years) |
| Demand for Unified Data Fabrics | +1.9% | North America, Europe, core APAC markets | Medium term (2-4 years) |
| Low-Code No-Code Platforms in Citizen Development | +1.7% | Global with acceleration in SME-dense regions | Short term (≤ 2 years) |
| Emerging Vertical-Specific Copilots | +1.4% | North America, Europe, APAC healthcare and BFSI hubs | Medium term (2-4 years) |
| Algorithmic ESG Cost Optimizers | +1.2% | Europe and North America with APAC spillover | Long term (≥ 4 years) |
| Source: Mordor Intelligence | |||
AI-Powered Workflow Automation Adoption
Enterprises are embedding agentic AI systems that orchestrate multi-step business processes, extending beyond robotic scripts into judgment-based activities. ServiceNow already resolves 60% of tier-1 incidents without human triage, freeing analysts for higher-value work.[1]ServiceNow Inc., “Generative AI in IT Service Management,” servicenow.com Vendors offering domain-specific pretrained models shorten time-to-value, creating a defensible advantage over generic platforms that need extensive tuning. Adoption is uneven across verticals; legal and consulting firms onboard capabilities up to 50% faster than manufacturing, where physical-digital integration slows rollout. Competitive differentiation is moving from model size to the richness of training data and tight coupling with line-of-business workflows.
Shift to Subscription SaaS Revenue Models
Usage-based pricing now dominates commercial discussions, replacing perpetual licenses with consumption tiers that align cost to utilization. Seventy-eight percent of software vendors offer metered plans, and although gross margins dip in the near term, predictable recurring revenue boosts valuation multiples. Large customers exploit multiyear commitments to negotiate 30-50% discounts, trading higher volume for lower unit economics. Smaller vendors with thin balance sheets face working-capital strain and are pivoting to hybrid models that blend flat subscriptions with overage charges. Market leaders such as Microsoft and Salesforce pair base subscriptions with usage accelerators, ensuring both revenue stability and upside. As customers benchmark price per outcome rather than seat count, analytics that expose direct business value become central to deal renewals.
Demand for Unified Data Fabrics
Fragmented data estates saddle engineers with integration chores that drain 60% of their capacity. Fabric architectures virtualize access across cloud, on-premise, and edge sources, cutting storage duplication costs by up to 60% while maintaining logical separation for compliance. Query federation solves many latency issues, yet real-time analytics for high-frequency fraud detection still requires local caching of hot data. Oracle and Snowflake now bundle intelligence that automatically determines which datasets to persist locally versus query remotely. Regulators add weight to the trend; the EU Data Act’s cross-border portability mandate makes logical separation with unified views an operational necessity by 2027.
Low-Code No-Code Platforms in Citizen Development
Low-code tools compress development cycles by 5-10× and shrink IT backlogs that often stretch 12-18 months. Businesses units built 40% of new applications this way in 2025, up sharply from 25% in 2023. Guardrails such as role-based access and automated testing allow IT to preserve governance while democratizing creation. Microsoft Power Platform and Salesforce Lightning illustrate the hybrid approach that lets advanced developers inject custom code when visual tooling reaches its ceiling. Complexity limits remain; applications needing high-throughput processing revert to traditional stacks, so low-code realistically addresses 60-70% of enterprise demand. Platforms that balance ease of use with “escape hatches” for pro developers are gaining the widest adoption.
Restraints Impact Analysis*
| Restraint | (~) % Impact on CAGR Forecast | Geographic Relevance | Impact Timeline |
|---|---|---|---|
| Escalating Cloud Spend Optimization Pressure | -1.8% | Global, acute in cost-sensitive SME and mid-market segments | Short term (≤ 2 years) |
| Growing Open-Source Alternatives | -1.5% | Emerging markets, price-sensitive SMEs worldwide | Medium term (2-4 years) |
| Data-Sovereignty and Cross-Border Compliance Hurdles | -1.2% | Europe, China, India, Middle East | Long term (≥ 4 years) |
| Scarcity of Prompt-Engineering Talent | -0.9% | Global, sharper shortages in non-English markets | Short term (≤ 2 years) |
| Source: Mordor Intelligence | |||
Escalating Cloud Spend Optimization Pressure
FinOps dashboards now surface line-item waste, enabling procurement teams to trim unused licenses and over-provisioned instances by as much as 30%.[2]Microsoft Corporation, “Dynamics 365 Product Updates,” microsoft.com Renewal rates remain near 88%, yet average contract values fall by 10-15% as enterprises downshift feature tiers and true up seat counts quarterly. Vendors counter through AI-driven return-on-investment calculators that tie pricing to efficiency gains, a tactic now prominent in Oracle Cloud savings plans.
Growing Open-Source Alternatives
Projects such as Odoo and ERPNext serve 7 million organizations, claiming 40-50% of greenfield SME deployments in emerging markets. Proprietary vendors defend through premium support, sophisticated integrations, and embedded AI modules that open-source rivals lack. Freemium editions from Atlassian and GitLab copy open-source economics while preserving upgrade paths to paid functionality. Developer preference also shapes purchasing; engineers steeped in open-source tooling lobby decisively during vendor evaluations. Sustainability risk tempers adoption, however, because many community projects rely on a narrow maintainer base or single corporate sponsor. Enterprises balance lower licensing cost against potential continuity exposures.
*Our forecasts treat driver/restraint impacts as directional, not additive. The impact forecasts reflect baseline growth, mix effects, and variable interactions.
Segment Analysis
By Software Type: ERP Dominates, Low-Code Accelerates
Enterprise resource planning held 23.46% of the Business software market in 2025, anchoring finance, supply chain, and manufacturing workflows. SAP is accelerating cloud migrations through end-of-support deadlines, with 60% of its installed base slated to move by 2027. In contrast, the Business software market size for low-code platforms is projected to grow fastest at a 12.01% CAGR through 2031 as non-technical users build workflows without writing code. Customer relationship management solutions embed generative scoring algorithms that raise lead conversion rates, while business intelligence suites swap batch reports for streaming dashboards. Vertical focus is sharpening; healthcare ERP integrates HIPAA compliance and inventory traceability, whereas manufacturing ERP emphasizes shop-floor analytics, illustrating why industry-specific depth now trumps breadth.
Proprietary vendors are embedding AI directly into core modules, automating reconciliations in finance suites and suggesting optimal reorder points in supply-chain modules. Low-code players position themselves as orchestration layers, stitching together micro-services from multiple systems. The Business software market share for horizontal suites is eroding as best-of-breed vertical players package compliance, analytics, and workflow in a single stack. Vendors that expose robust APIs while offering pre-built connectors can participate in composable architectures without surrendering data control, a capability increasingly demanded by procurement teams wary of lock-in.


By Deployment: Cloud Leads, Edge Emerges
Cloud deployments represented 82.14% of the Business software market in 2025 and are forecast to register a 12.96% CAGR through 2031. Elastic scaling, automatic patching, and pay-as-you-grow billing underpin adoption, especially for seasonal or variable workloads. Multi-cloud postures mitigate platform risk; enterprises certify applications on AWS, Azure, and Google Cloud, compelling independent software vendors to containerize solutions for portability. The Business software market size for on-premise installations continues its gradual decline, although sovereignty and latency considerations preserve niche relevance in defense, healthcare, and certain public-sector workloads.
Edge computing, despite accounting for less than 5% of current deployments, shows outsized momentum in real-time analytics and industrial IoT. Vendors are refactoring modules into lightweight services that run on ruggedized gateways, synchronizing with central clouds when connectivity resumes. Data localization laws in China and the EU add complexity, forcing global providers to invest in regional infrastructure or partner with local champions. Rising cloud spend is prompting 15-20% of mature workloads to repatriate to private data centers or build hybrid estates that blend predictable core processing with burst capacity in the cloud.
By End-User Industry: BFSI Commands, Healthcare Accelerates
Banking, financial services, and insurance captured 18.67% revenue share in 2025, sustained by digital banking mandates and real-time risk analytics. Regulatory capital calculations, anti-money-laundering screening, and omnichannel engagement drive consistent investment. Conversely, healthcare and life sciences will post the fastest expansion at a 13.18% CAGR through 2031, fueled by mandates for electronic health record interoperability and AI-assisted diagnostics. The Business software market size for government and public sector applications is also rising as agencies digitize citizen services, migrate off mainframes, and adopt zero-trust security architectures.
Retail and e-commerce vendors converge on omnichannel inventory visibility, while transportation platforms build predictive maintenance modules to offset driver shortages and fuel volatility. Manufacturing invests in digital twins that simulate production lines ahead of physical changes, trimming changeover downtime and scrap. Vertical specialization enables price premiums; a healthcare-ready CRM that embeds consent management can sell at 30-50% higher license fees than a horizontal CRM that requires custom configuration.
By Organization Size: SMEs Close the Gap
Large enterprises accounted for 61.83% of the Business software market in 2025, reflecting complex global footprints and stringent security requirements. Still, small and medium enterprises are expanding faster, at a 12.14% CAGR, as modular SaaS eliminates six-figure implementation fees. Vendors such as Zoho offer bundled suites priced between USD 50 and USD 100 per user per month, bypassing middleware requirements that previously deterred adoption. Churn risk is higher in SMEs running 15-25% annually, so providers streamline onboarding to achieve payback before attrition.
Enterprise buyers are shifting to composable architectures that assemble best-of-breed components through standardized APIs. This trend benefits niche specialists that excel at a single workflow yet integrate cleanly into broader stacks. Integration complexity, however, still consumes 30-40% of software budgets, motivating platform vendors to embed native connectors and built-in integration-platform-as-a-service capabilities that lower total cost of ownership.
Geography Analysis
North America maintained 36.92% of the Business software market in 2025, due to hyperscale cloud density, deep venture funding, and a mature customer base eager to pilot emerging capabilities. Yet saturation moderates growth as vendors pivot from net-new sales to cross-selling AI and analytics upgrades. Regulatory clarity around data privacy balances innovation with protection, fostering steady albeit slower expansion.
Europe navigates complex oversight, from GDPR to the upcoming AI Act, creating demand for governance and compliance software even as administrative requirements raise the cost of entry for smaller firms. The EU Data Act, effective 2027, will mandate interoperability, potentially commoditizing integration layers and pushing differentiation toward user experience and specialized analytics. Vendors that preemptively expose robust APIs will compete effectively once the rule takes hold.
Asia Pacific divides between advanced economies, Japan, South Korea, Singapore, that mirror Western adoption curves, and high-growth territories such as India, Indonesia, and Vietnam, where mobile-first approaches leapfrog desktop heritage. China, with stringent localization rules, nurtures a parallel ecosystem dominated by domestic providers like Kingdee and Yonyou, emphasizing local hosting and compliance management. Foreign vendors must joint-venture or deploy in-country data centers, inflating cost structures by 20-40%.
The Middle East accelerates digital projects under economic diversification blueprints, notably Saudi Arabia’s Vision 2030 and the UAE’s smart-city push. Limited local talent inflates wages and extends implementation timelines, so vendors often deliver as managed services. South America benefits from new in-region data centers that reduce latency and satisfy residency conditions, though currency volatility forces difficult pricing decisions between local denomination and USD billing. Africa posts the strongest CAGR at 12.89% through 2031, driven by mobile-centric architectures exemplified by Kenya’s M-Pesa ecosystem and surge in cloud-native fintech platforms optimized for intermittent connectivity.

Competitive Landscape
Microsoft, Salesforce, Oracle, SAP, and ServiceNow hold roughly major shares, leaving room for hundreds of vertical or regional challengers. Salesforce’s AppExchange hosts more than 7,000 add-ons, collecting ecosystem fees while partners extend functionality. Microsoft embeds Copilot across Office, Dynamics, and Azure, weaving AI into routine workflows and raising switching costs. ServiceNow filed 127 AI-related patents in 2025, focusing on autonomous workflow orchestration.[3]United States Patent and Trademark Office, “Patent Full-Text Database,” uspto.gov
Vertical specialists exploit domain depth to win against generalists; legal contract-review copilots trained on precedent data achieve higher accuracy than generic language models. Open-source entrants capture budget-constrained segments, especially in emerging markets where vendors must substantiate every premium dollar through differentiated AI, uptime guarantees, and compliance certifications. Composable architectures weaken monolithic advantages by allowing enterprises to interchange components without wholesale rip-and-replace, a dynamic that favors agile innovators with clean APIs.
Incumbents respond through acquisitions and partnerships. SAP’s purchase of WalkMe adds in-app guidance that reduces implementation friction, while ServiceNow collaborates with NVIDIA to fine-tune industry models that elevate incident resolution rates. Oracle’s multibillion-dollar investment in Middle Eastern data centers underscores the importance of regional presence for latency and sovereignty. As ecosystem lock-in replaces pure feature competition, vendors strive to make their platforms the default workspace for daily tasks, embedding collaboration and analytics so thoroughly that switching costs rise even when functional parity exists elsewhere.
Business Software Industry Leaders
Microsoft Corporation
IBM Corporation
Oracle Corporation
SAP SE
Snowflake Inc.
- *Disclaimer: Major Players sorted in no particular order

Recent Industry Developments
- January 2026: Salesforce agreed to acquire Own Company for USD 1.9 billion to bolster multi-cloud backup and compliance capabilities.
- December 2025: Microsoft launched Copilot for Dynamics 365 Finance, reporting 40% faster month-end close cycles among early adopters.
- November 2025: SAP closed its USD 2.3 billion purchase of WalkMe, aiming to shorten S/4HANA cloud onboarding by up to 40%.
- October 2025: ServiceNow partnered with NVIDIA to build domain-specific AI models that improve complex incident resolution accuracy by 50%.


Global Business Software Market Report Scope
Business software is software that is used for business purposes. The term is often used more specifically for software that helps a business to accomplish specific goals through the applied principles that the software supports.
The Business Software Market Report is Segmented by Software Type (ERP, CRM, Business Intelligence and Analytics, Supply Chain Management, Human Resource Management, Finance and Accounting, Project and Portfolio Management, Other Software Types), Deployment (Cloud, On-Premise), End-User Industry (BFSI, Healthcare and Life Sciences, Government and Public Sector, Retail and E-Commerce, Transportation and Logistics, Manufacturing, Telecommunications and Media, Other End-User Industries), Organization Size (Large Enterprises, Small and Medium Enterprises), and Geography (North America, South America, Europe, Asia Pacific, Middle East, Africa). The Market Forecasts are Provided in Terms of Value (USD).
By Software Type
| ERP |
| CRM |
| Business Intelligence and Analytics |
| Supply Chain Management |
| Human Resource Management |
| Finance and Accounting |
| Project and Portfolio Management |
| Other Software Types |
By Deployment
| Cloud |
| On-Premise |
By End-User Industry
| BFSI |
| Healthcare and Life Sciences |
| Government and Public Sector |
| Retail and E-Commerce |
| Transportation and Logistics |
| Manufacturing |
| Telecommunications and Media |
| Other End-User Industries |
By Organization Size
| Large Enterprises |
| Small and Medium Enterprises |
By Geography
| North America | United States |
| Canada | |
| Mexico | |
| South America | Brazil |
| Argentina | |
| Rest of South America | |
| Europe | Germany |
| United Kingdom | |
| France | |
| Italy | |
| Spain | |
| Rest of Europe | |
| Asia Pacific | China |
| Japan | |
| India | |
| South Korea | |
| Southeast Asia | |
| Rest of Asia Pacific | |
| Middle East | Saudi Arabia |
| United Arab Emirates | |
| Turkey | |
| Rest of Middle East | |
| Africa | South Africa |
| Nigeria | |
| Egypt | |
| Rest of Africa |
| By Software Type | ERP | |
| CRM | ||
| Business Intelligence and Analytics | ||
| Supply Chain Management | ||
| Human Resource Management | ||
| Finance and Accounting | ||
| Project and Portfolio Management | ||
| Other Software Types | ||
| By Deployment | Cloud | |
| On-Premise | ||
| By End-User Industry | BFSI | |
| Healthcare and Life Sciences | ||
| Government and Public Sector | ||
| Retail and E-Commerce | ||
| Transportation and Logistics | ||
| Manufacturing | ||
| Telecommunications and Media | ||
| Other End-User Industries | ||
| By Organization Size | Large Enterprises | |
| Small and Medium Enterprises | ||
| By Geography | North America | United States |
| Canada | ||
| Mexico | ||
| South America | Brazil | |
| Argentina | ||
| Rest of South America | ||
| Europe | Germany | |
| United Kingdom | ||
| France | ||
| Italy | ||
| Spain | ||
| Rest of Europe | ||
| Asia Pacific | China | |
| Japan | ||
| India | ||
| South Korea | ||
| Southeast Asia | ||
| Rest of Asia Pacific | ||
| Middle East | Saudi Arabia | |
| United Arab Emirates | ||
| Turkey | ||
| Rest of Middle East | ||
| Africa | South Africa | |
| Nigeria | ||
| Egypt | ||
| Rest of Africa | ||


Key Questions Answered in the Report
How large is the Business software market expected to become by 2031?
It is projected to reach USD 1.28 trillion by 2031 at an 11.58% CAGR from 2026.
Which deployment model is growing fastest in the Business software market?
Cloud remains dominant and is expanding at a 12.96% CAGR, while edge-enabled scenarios show the highest relative acceleration.
What segment shows the quickest growth within Business software?
Low-code platforms lead growth with a projected 12.01% CAGR as organizations broaden citizen development.
Why is healthcare adopting Business software rapidly?
Interoperability mandates and AI-driven clinical workflows push healthcare software spending upward at a 13.18% CAGR.
Which region holds the largest share today?
North America retains 36.92% share thanks to dense cloud infrastructure and a mature customer base.
How fragmented is vendor competition?
The top five providers hold roughly 35% of revenue, signaling moderate fragmentation that favors niche specialists as well as platform giants.
Page last updated on:


