Supply Chain Management Software Market Size and Share
Market Overview
| Study Period | 2020 - 2031 |
|---|---|
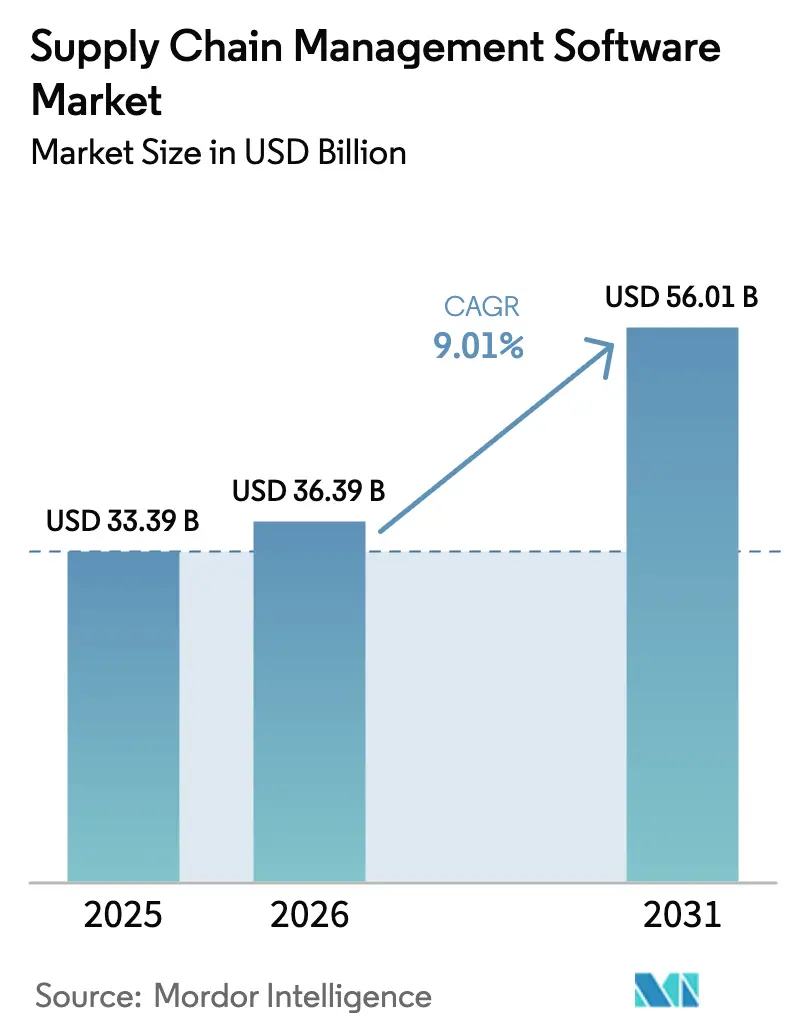
| Market Size (2026) | USD 36.39 Billion |
| Market Size (2031) | USD 56.01 Billion |
| Growth Rate (2026 - 2031) | 9.01% CAGR |
| Fastest Growing Market | Asia Pacific |
| Largest Market | North America |
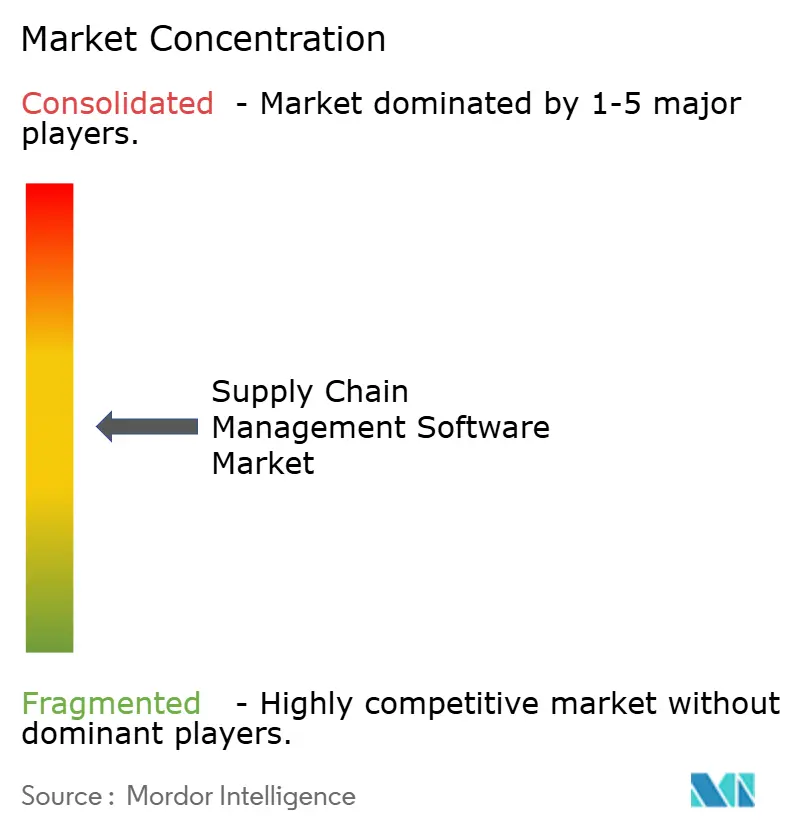
| Market Concentration | Medium |
Major Players *Disclaimer: Major Players sorted in no particular order Image © Mordor Intelligence. Reuse requires attribution under CC BY 4.0. | |
Supply Chain Management Software Market Analysis by Mordor Intelligence
The supply chain management software market size in 2026 is estimated at USD 36.39 billion, growing from 2025 value of USD 33.39 billion with 2031 projections showing USD 56.01 billion, growing at 9.01% CAGR over 2026-2031. Digital transformation mandates, regulatory traceability rules, and artificial intelligence (AI) integration are the primary forces propelling this growth. Cloud-first strategies among small and medium enterprises (SMEs) are widening access to advanced functionality, while regulations such as the Uyghur Forced Labor Prevention Act (UFLPA) and the Corporate Sustainability Reporting Directive (CSRD) accelerate the need for end-to-end visibility. AI-driven predictive analytics that optimize inventory and logistics networks are rapidly becoming standard modules. At the same time, cybersecurity concerns, legacy system integration complexity, and total cost of ownership scrutiny during volatile freight cycles temper adoption speed but have not derailed the positive trajectory that defines the supply chain management software market.
Key Report Takeaways
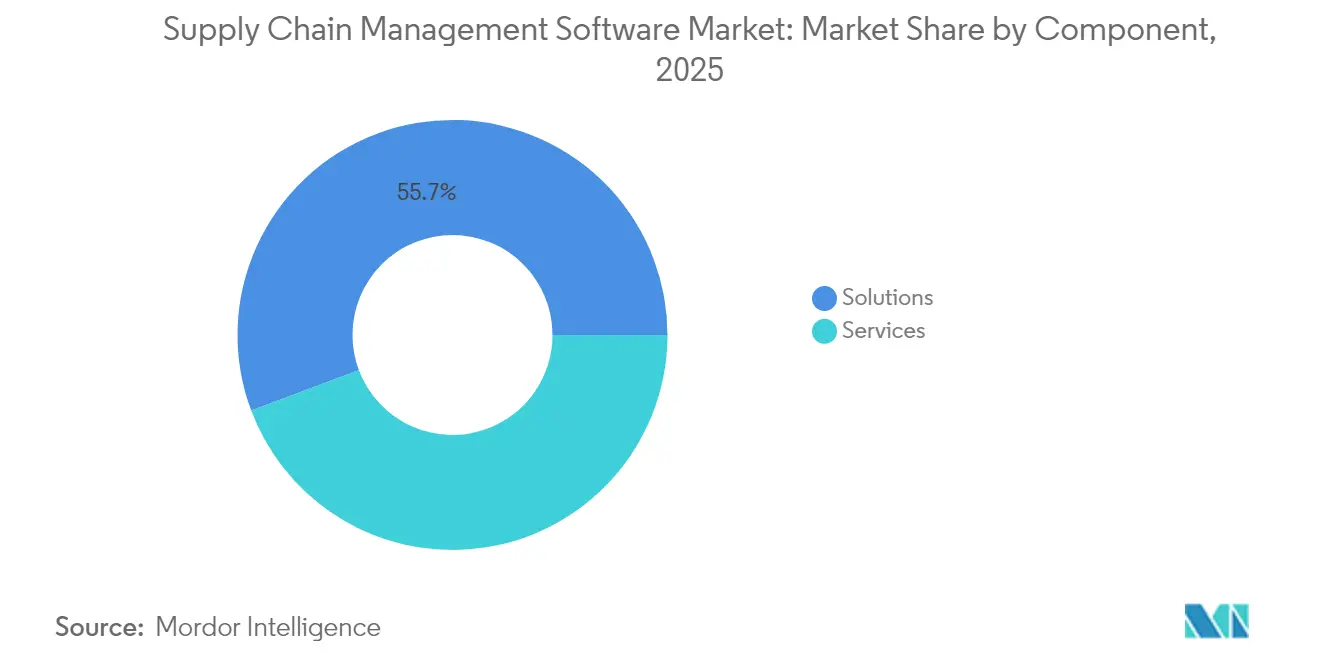
- By component, solutions held 55.72% of the supply chain management software market share in 2025, whereas services are set to record the fastest expansion at a 12.16% CAGR through 2031.
- By deployment mode, cloud platforms captured 55.05% of the supply chain management software market size in 2025 and are projected to grow 14.63% per year to 2031.
- By end-user enterprise size, large companies controlled 64.45% of 2025 revenue, but the SME segment is forecast to post a 13.92% CAGR to 2031.
- By end-user industry, manufacturing accounted for 26.02% of the 2025 supply chain management software market size, while healthcare and life sciences are on course for a 13.12% CAGR.
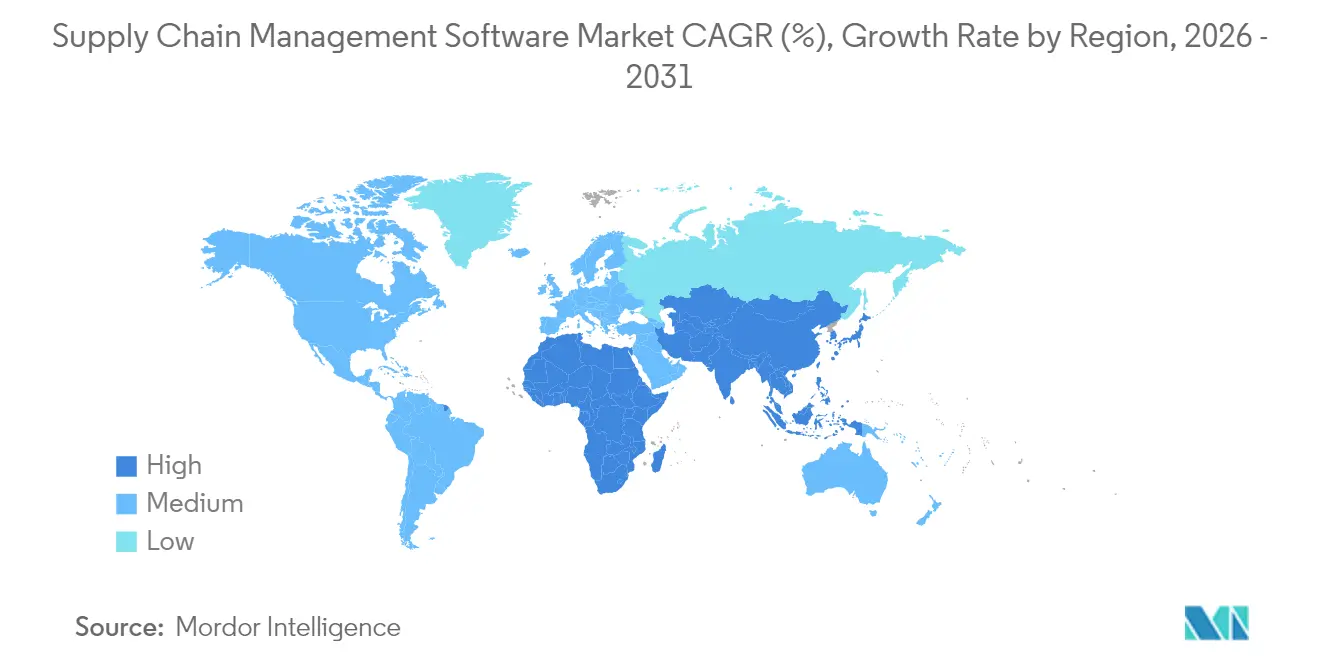
- By geography, North America led with 38.25% revenue share in 2025, and Asia-Pacific is poised to advance at a 12.18% CAGR through 2031.
Note: Market size and forecast figures in this report are generated using Mordor Intelligence’s proprietary estimation framework, updated with the latest available data and insights as of 2026.
Global Supply Chain Management Software Market Trends and Insights
Drivers Impact Analysis*
| Driver | (~) % Impact on CAGR Forecast | Geographic Relevance | Impact Timeline |
|---|---|---|---|
| Rising cloud-first adoption among SMEs | +2.1% | Global, strongest in Asia-Pacific and emerging markets | Medium term (2-4 years) |
| E-commerce demand for real-time visibility | +1.8% | North America, Europe, spreading in Asia-Pacific | Short term (≤ 2 years) |
| AI-driven predictive analytics | +2.3% | North America and developed Asia-Pacific | Medium term (2-4 years) |
| Regulatory push for end-to-end traceability | +1.4% | North America, Europe; cascading to global supply chains | Long term (≥ 4 years) |
| Volatility APIs for freight optimization | +0.9% | Global, early uptake in logistics-intensive regions | Short term (≤ 2 years) |
| Digital product passport mandates | +1.1% | Europe, with global export ramifications | Long term (≥ 4 years) |
| Source: Mordor Intelligence | |||
Rising Cloud-First Adoption Among SMEs
Cloud platforms remove up-front capital barriers and supply elastic computing power, allowing SMEs to access advanced analytics and AI once limited to large enterprises. OECD findings show that cost and skills gaps have long delayed SME digitization; cloud subscriptions directly address both issues. Widespread SME onboarding is especially visible in Asia-Pacific manufacturing clusters, amplifying supplier connectivity within multinational value chains. As more SMEs join unified ecosystems, the supply chain management software market enjoys a multiplier effect that accelerates innovation and levels competitive landscapes.
E-Commerce Demand for Real-Time Fulfillment Visibility
Explosive e-commerce volumes have raised consumer expectations for instant transparency. General Mills built a cloud platform that cut logistics waste by 30% and heightened forecast precision, demonstrating the operational payoff from end-to-end visibility initiatives. Retailers and brand manufacturers now insist on API-centric architectures that connect marketplace portals, third-party logistics providers, and last-mile carriers in near real time. The requirement is most pronounced in North America and Europe but is spreading quickly through Asia-Pacific mobile-commerce channels.
AI-Driven Predictive Analytics for Inventory and Logistics
AI applications have progressed beyond descriptive dashboards to autonomous decision engines. Kinaxis introduced its Maestro orchestration platform, embedding machine learning that drives touchless planning and continuous network optimization [1]Kinaxis Inc., “Kinaxis Launches Maestro,” kinaxis.com. Early adopters report inventory cuts of 35% and service-level gains that free working capital. As data quality improves and algorithm libraries mature, AI is becoming a standard differentiator throughout the supply chain management software market.
Regulatory Push for End-to-End Traceability
Compliance pressure is intensifying. UFLPA enforcement blocked USD 3.17 billion in shipments, with detentions rising 45% during 2024. Meanwhile, CSRD widens mandatory ESG disclosures to more than 50,000 companies, prompting firms to document environmental and social impacts deep into their supplier networks. Software providers are responding with modules that map multi-tier partners, collect validated source data, and maintain immutable audit trails.
Restraints Impact Analysis*
| Restraint | (~) % Impact on CAGR Forecast | Geographic Relevance | Impact Timeline |
|---|---|---|---|
| Cyber-security and data-privacy concerns | -1.7% | Global; strongest in regulated industries | Short term (≤ 2 years) |
| Complex legacy ERP/SCE integration costs | -1.3% | North America and Europe where legacy stacks dominate | Medium term (2-4 years) |
| Subscription TCO scrutiny in freight cycles | -0.8% | Global, heightened during economic uncertainty | Short term (≤ 2 years) |
| Multi-cloud latency and interoperability gaps | -0.6% | Global enterprises with dispersed IT estates | Medium term (2-4 years) |
| Source: Mordor Intelligence | |||
Cyber-Security and Data-Privacy Concerns
High-profile breaches have tightened scrutiny around cloud deployments. The European Union Agency for Cybersecurity found only 47% of surveyed firms allocate budgets that match stated policy ambitions [2]European Union Agency for Cybersecurity, “ENISA Supply Chain Cybersecurity Survey 2025,” enisa.europa.eu. Attackers increasingly target smaller suppliers to penetrate larger ecosystems. Enterprises are moving toward zero-trust models and continuous monitoring, but elevated security requirements prolong procurement cycles and raise implementation costs.
Complex Legacy ERP/SCE Integration Costs
Many manufacturers operate mission-critical legacy systems without modern APIs. Custom middleware, data transformation layers, and extensive validation testing can consume up to 60% of project budgets, extending rollouts and dampening ROI expectations. These hidden costs sometimes push firms toward incremental upgrades rather than transformative platform replacements.
*Our forecasts treat driver/restraint impacts as directional, not additive. The impact forecasts reflect baseline growth, mix effects, and variable interactions.
Segment Analysis
By Component: Services Accelerate as Implementation Complexity Rises
Services revenue is advancing at 12.16% CAGR, outpacing software solutions even though solutions retained 55.72% of 2025 revenue within the supply chain management software market. Consulting and systems integration engagements have increased as enterprises embed AI features, configure regulatory compliance workflows, and orchestrate data pipelines across multi-cloud estates. Support contracts are shifting toward continuous optimization, with vendors refining machine-learning models and performance dashboards in real time. Managed services appeal to organizations that prefer to outsource daily platform administration, avoiding talent shortages in analytics and cybersecurity.
Demand for specialist expertise will keep the services segment on a growth trajectory that strengthens vendor–client partnerships beyond initial go-lives. The Cheesecake Factory’s decision to adopt GEP SMART illustrates how tailored configuration and supplier-collaboration services underpin successful transformation programs . Overall, the expanding services footprint provides vendors with recurring revenue streams that balance cyclical license sales and deepen customer stickiness across the supply chain management software market.


By Deployment Mode: Cloud Dominance Accelerates
Cloud deployments captured 55.05% of the 2025 supply chain management software market size and are forecast to rise 14.63% annually to 2031. Organizations cite scalability, lower capital requirements, and access to cloud-native AI extensions as decisive advantages. Even highly regulated companies are adopting hybrid approaches, keeping sensitive workloads on-premise while moving planning and collaboration modules to the cloud. This transition underpins the broader modernization agenda that is reshaping the supply chain management software market.
On-premise platforms persist where data-sovereignty laws or bespoke customizations lock firms into local infrastructure. However, the feature velocity of cloud solutions, continuous updates, microservice architectures, embedded analytics, remains unmatched. SMEs have capitalized first, but large enterprises now lead multi-cloud orchestration projects that align supply, logistics, and finance applications on a common data backbone.
By End-user Enterprise Size: SME Growth Outpaces Large Enterprise Adoption
Large firms continued to command 64.45% of 2025 revenue, yet the SME segment is accelerating at 13.92% CAGR through 2031. Subscription pricing, rapid deployment, and modular roll-outs help smaller companies benefit from the same capabilities as global corporations. This democratization reshapes supplier–buyer relationships, reducing information asymmetry and fostering collaborative planning across tiers of the supply chain management software market.
Regional dynamics amplify this trend. Asian SMEs, in particular, are migrating core operations to public cloud services that bundle supply chain, finance, and HR in one suite. As their digital maturity rises, these firms can interoperate with multinational customers through standardized APIs, unlocking network efficiencies that ripple across industry ecosystems.

By End-User Industry: Healthcare Leads Growth Amid Regulatory Pressures
Manufacturing remained the largest vertical with 26.02% revenue share in 2025, driven by complex global production footprints that require synchronized planning, sourcing, and quality control. However, healthcare and life sciences are poised for the fastest expansion at a 13.12% CAGR, spurred by serialization mandates under the Drug Supply Chain Security Act. Compliance needs push pharmaceutical companies to deploy traceability and cold-chain monitoring modules that integrate directly with regulators and contract manufacturers.
Retail, automotive, and logistics firms contribute steady demand focused on omnichannel execution, carbon-tracking, and dynamic routing respectively. Each industry’s nuanced requirements encourage vendors to release sector-specific accelerators, broadening the solution portfolio that sustains growth in the supply chain management software market.
Geography Analysis
North America held 38.25% of global revenue in 2025. Mature IT spending, early cloud adoption, and stringent legislation such as UFLPA support continued leadership. The presence of Oracle, Microsoft, SAP, and Manhattan Associates further concentrates innovation and channel capacity inside the region. Cross-border trade under USMCA adds complexity that spurs investment in multi-enterprise collaboration tools.
Asia-Pacific is the fastest-growing territory with a 12.18% CAGR forecast to 2031. China’s Industry 4.0 incentives, Japan’s focus on robotics and AI, and India’s production-linked incentive schemes collectively expand the addressable base for advanced logistics and planning applications. The Asian Development Bank estimates that comprehensive digital trade facilitation could lower transaction costs by 11%, reinforcing the economic rationale for software upgrades.
Europe exhibits steady demand rooted in sweeping sustainability and human-rights legislation. CSRD and the Digital Product Passport initiative oblige firms to maintain rich data trails stretching across supplier networks. Germany champions these efforts through its highly automated manufacturing complexes, while France, Italy, and Spain accelerate deployments to meet disclosure deadlines. Emerging opportunities in South America and the Middle East and Africa hinge on infrastructure readiness and macroeconomic stability, yet expanding export volumes incentivize gradual investment in foundational supply chain solutions.
Mordor Intelligence provides coverage of the supply chain management software market across other key regional markets. Detailed country-level analysis extends to United States incorporating local coverage and market participation, as required.

Competitive Landscape
The supply chain management software market remains moderately fragmented. Enterprise application leaders use integrated suites to defend share against best-of-breed vendors. Oracle’s Fusion Cloud ERP revenue reached USD 1.0 billion during fiscal 2025, up 22% year over year, reflecting strong uptake of embedded supply chain modules [4]Oracle Corporation, “Q4 FY25 Earnings Release,” oracle.com. Microsoft recorded 16% Dynamics 365 growth in Q3 2025, while SAP’s cloud ERP revenue jumped 34% and now represents 85% of total cloud income.
Best-of-breed specialists pursue depth and industry focus. Blue Yonder’s USD 839 million purchase of One Network Enterprises expands its multi-enterprise network footprint and opens new growth channels. Manhattan Associates reported USD 255.8 million Q4 2024 revenue and 25% growth in remaining performance obligations, underscoring demand for warehouse and transportation optimization technology. AI has emerged as a common battleground; Kinaxis embeds generative tools to automate planning, and Manhattan Associates launched AI copilots for customer service scripting.
Customer procurement criteria now balance platform breadth, AI maturity, total cost of ownership, and ecosystem openness. Vendors differentiate through accelerators, partner marketplaces, and industry-specific data models. Consolidation trends indicate that scale and data gravity are increasingly decisive in shaping future competitive dynamics within the supply chain management software market.
Supply Chain Management Software Industry Leaders
Kinaxis Inc.
Blue Yonder Group, Inc.
Manhattan Associates, Inc.
Oracle Corporation
SAP SE
- *Disclaimer: Major Players sorted in no particular order

Recent Industry Developments
- May 2025: E2open was acquired by WiseTech Global, combining two providers of global trade and logistics platforms.
- May 2025: Optimal Dynamics raised USD 40 million in Series C financing led by Koch Disruptive Technologies to scale its AI-driven freight decision platform.
- January 2025: Aptean agreed to purchase Logility, strengthening its demand-planning and inventory-optimization offerings.
- January 2025: Complexica released WaveSCM™, a cloud suite for rail, intermodal, and warehouse operators, already adopted by leading Australian logistics firms.


Research Methodology Framework and Report Scope
Market Definitions and Key Coverage
Our study defines the global supply-chain management software market as every licensed or subscription-based application that plans, executes, or analyzes the movement of goods, information, and cash across networks. Coverage spans demand-planning suites, procurement and sourcing modules, warehouse and transport management, plus performance analytics delivered on-premise or from the cloud to firms of any size and industry.
Scope Exclusions: stand-alone ERP finance modules, barcode/RFID hardware, and one-off custom tools built for a single enterprise.
Segmentation Overview
- By Component
- Solutions
- Demand Planning Software
- Transportation Management System (TMS)
- Warehouse Management System (WMS)
- Procurement and Sourcing
- Supply-Chain Analytics
- Services
- Consulting and Integration
- Support and Maintenance
- Managed Services
- Solutions
- By Deployment Mode
- Cloud
- On-premise
- By End-user Enterprise Size
- Large Enterprises
- Small and Medium Enterprises (SMEs)
- By End-user Industry
- Manufacturing
- Retail and E-commerce
- Healthcare and Life Sciences
- Automotive
- Food and Beverage
- Logistics and Transportation
- Other Industries
- By Geography
- North America
- United States
- Canada
- Mexico
- South America
- Brazil
- Argentina
- Rest of South America
- Europe
- Germany
- United Kingdom
- France
- Italy
- Spain
- Russia
- Rest of Europe
- Asia-Pacific
- China
- Japan
- India
- South Korea
- Australia and New Zealand
- Rest of Asia-Pacific
- Middle East and Africa
- Middle East
- Saudi Arabia
- United Arab Emirates
- Turkey
- Rest of Middle East
- Africa
- South Africa
- Nigeria
- Egypt
- Rest of Africa
- Middle East
- North America
Detailed Research Methodology and Data Validation
Primary Research
Mordor's team interviews supply-chain chiefs, IT buyers, integrators, and distributors across North America, Europe, Asia-Pacific, Latin America, and the Middle East and Africa. These dialogues test penetration rates, contract values, renewal triggers, and emerging pain points, closing gaps left by desk work.
Desk Research
We begin by anchoring spend and usage with tier-1 public datasets such as the US Bureau of Economic Analysis software tables, Eurostat structural business statistics, WTO ICT-services trade, OECD cloud-adoption surveys, and GS1 standards reports. Company 10-Ks, investor decks, and respected trade media refine recent price points and vendor splits, while our access to D&B Hoovers and Dow Jones Factiva lets Mordor analysts benchmark supplier revenues. A second sweep of customs filings, patent databases, and regional association bulletins flags new module launches or price inflections. The sources named are illustrative; many additional references support evidence gathering and validation.
Market-Sizing and Forecasting
Our mainly top-down model starts with national enterprise-software outlays and cloud revenue, then filters them through SCM penetration ratios, seat counts, and blended selling prices. Supplier roll-ups, channel checks, and sampled contracts provide bottom-up reasonableness checks. Key variables we track include global manufacturing PMI, e-commerce share of retail, average cloud cost per user, freight rate indices, and new traceability rules. A multivariate regression projects demand to 2030, and weighted averages reconcile any sample divergence.
Data Validation and Update Cycle
Outputs pass analyst, peer, and quality reviews; anomalies trigger rapid re-contact. Models refresh each year and reopen after material events so clients always receive the latest view.
Why Our Supply Chain Management Software Baseline Commands Reliability
Published estimates often diverge because firms vary module coverage, price deflators, currency conversion, and refresh cadence.
Our disciplined scope, constant-2025 USD conversion, and annual audit trim noise and bias.
Benchmark comparison
| Market Size | Anonymized source | Primary gap driver |
|---|---|---|
| USD 33.39 B (2025) | Mordor Intelligence | - |
| USD 38.51 B (2025) | Global Consultancy A | Counts logistics hardware and service bundles |
| USD 30.41 B (2024) | Industry Research B | Mixes vendor fiscal years, omits SaaS discounts |
| USD 30.73 B (2025) | Trade Journal C | Uses steep price erosion factor, biennial updates |
The table shows how scope creep or dated inputs swing values, whereas our carefully selected variables and yearly audit give decision-makers a transparent, balanced baseline they can trust.


Key Questions Answered in the Report
What is the current size of the supply chain management software market?
The supply chain management software market is valued at USD 36.39 billion in 2026 and is set to reach USD 56.01 billion by 2031.
Which component segment is growing fastest?
Services, particularly consulting and managed services, are forecast to grow at 12.16% CAGR through 2031.
Why are SMEs adopting supply chain platforms so quickly?
Cloud subscriptions eliminate capital costs and deliver instant access to analytics and AI, enabling SMEs to match capabilities previously available only to large enterprises.
How do new regulations influence software demand?
Laws such as UFLPA and CSRD require full supply-chain traceability, pushing companies to deploy platforms that map multi-tier suppliers and store auditable data.
Which region will post the highest growth rate?
Asia-Pacific is projected to advance at a 12.18% CAGR, driven by large-scale manufacturing digitization and government incentives.
What role does AI play in modern supply chain solutions?
AI enables predictive inventory positioning, disruption forecasting, and autonomous decision-making, with early adopters cutting inventory levels by up to 35%.
Page last updated on:


