Trade Management Software Market Size and Share
Market Overview
| Study Period | 2019 - 2030 |
|---|---|
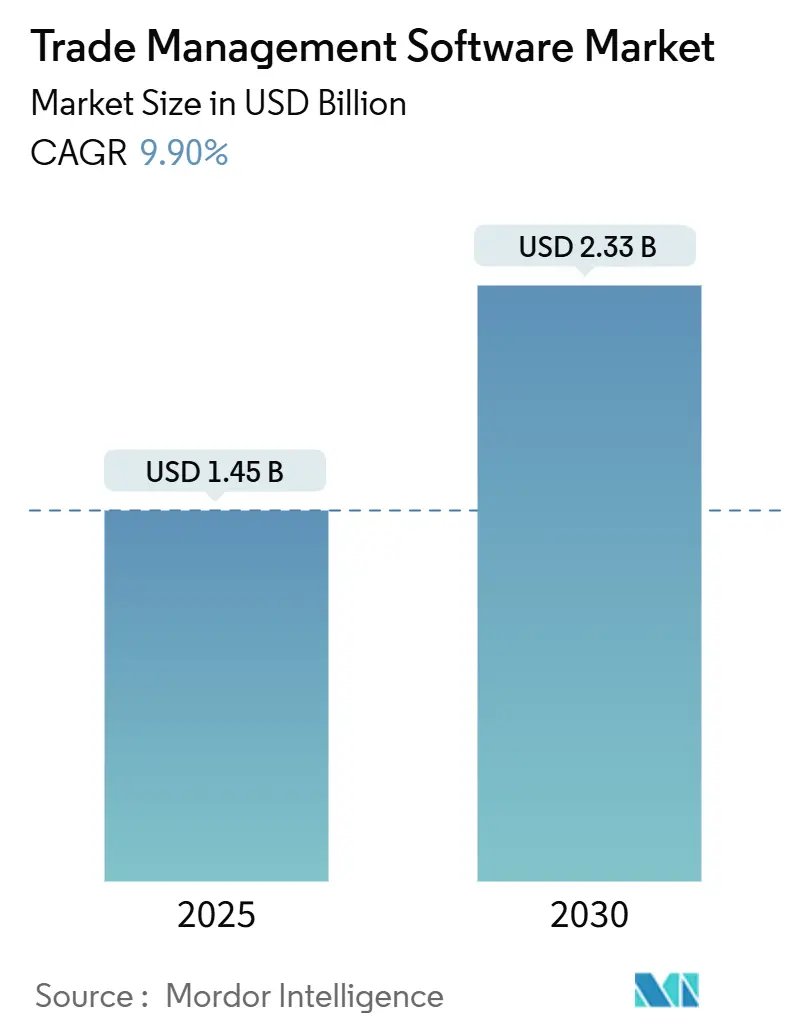
| Market Size (2025) | USD 1.45 Billion |
| Market Size (2030) | USD 2.33 Billion |
| Growth Rate (2025 - 2030) | 9.90% CAGR |
| Fastest Growing Market | Asia Pacific |
| Largest Market | North America |
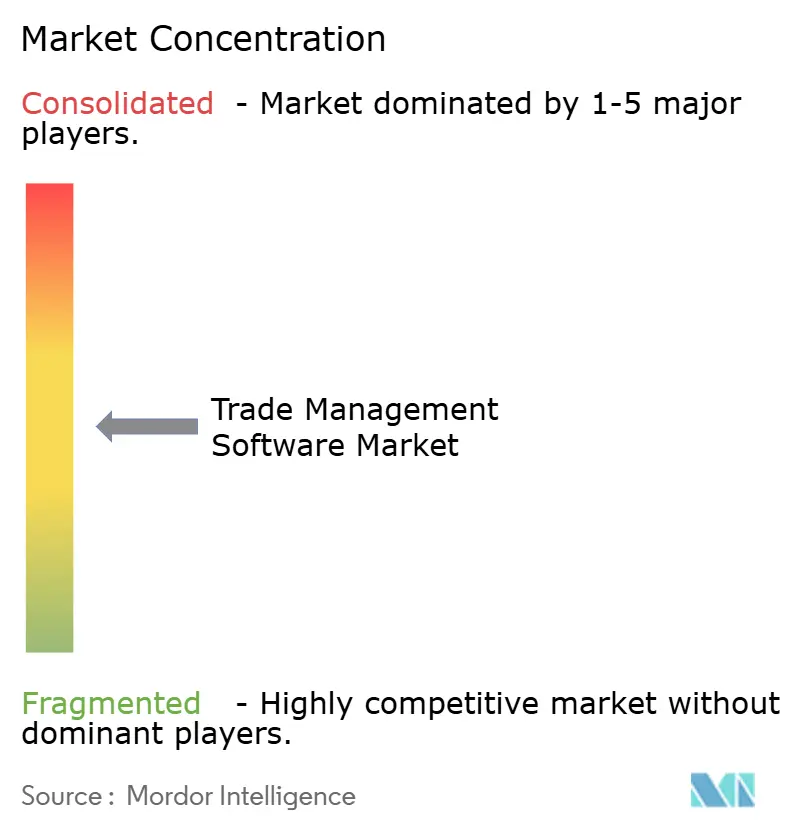
| Market Concentration | Medium |
Major Players *Disclaimer: Major Players sorted in no particular order Image © Mordor Intelligence. Reuse requires attribution under CC BY 4.0. | |
Trade Management Software Market Analysis by Mordor Intelligence
The trade management software market is valued at USD 1.45 billion in 2025 and is expected to reach USD 2.33 billion by 2030, translating into a 9.9% CAGR. The market’s growth stems from tighter international trade rules, widespread deployment of digital twins for tariff planning, and a distinct move toward cloud-first architectures that trim compliance cycles. Regulatory changes such as the U.S. export-control update on advanced computing items and the European Union’s Carbon Border Adjustment Mechanism are compelling firms to modernize compliance tools. At the same time, AI-enabled scenario-planning engines are pushing demand for unified platforms that consolidate screening, document generation, and duty optimization. Vendors are stressing real-time analytics to lower penalties, minimize dwell time at ports, and sustain end-to-end shipment visibility. Industry consolidation is also quickening as larger players acquire niche specialists which is exemplified by WiseTech Global’s 2025 takeover of E2open to build single-stack systems that interlink customs, logistics, inventory, and sustainability reporting.
Key Report Takeaways
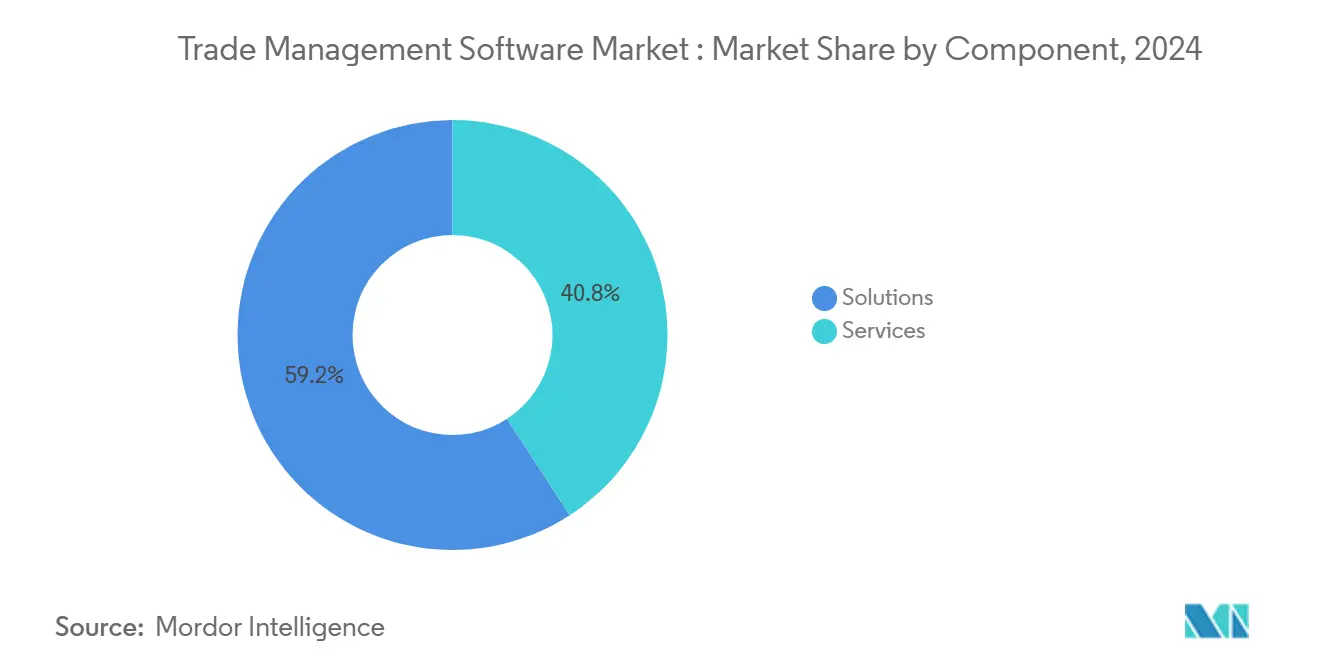
- By component, Solutions led with 65% revenue share in 2024, while Services are projected to expand at a 12.5% CAGR through 2030.
- By deployment model, Cloud captured 68% of the trade management software market share in 2024 and is advancing at a 15.3% CAGR between 2025-2030.
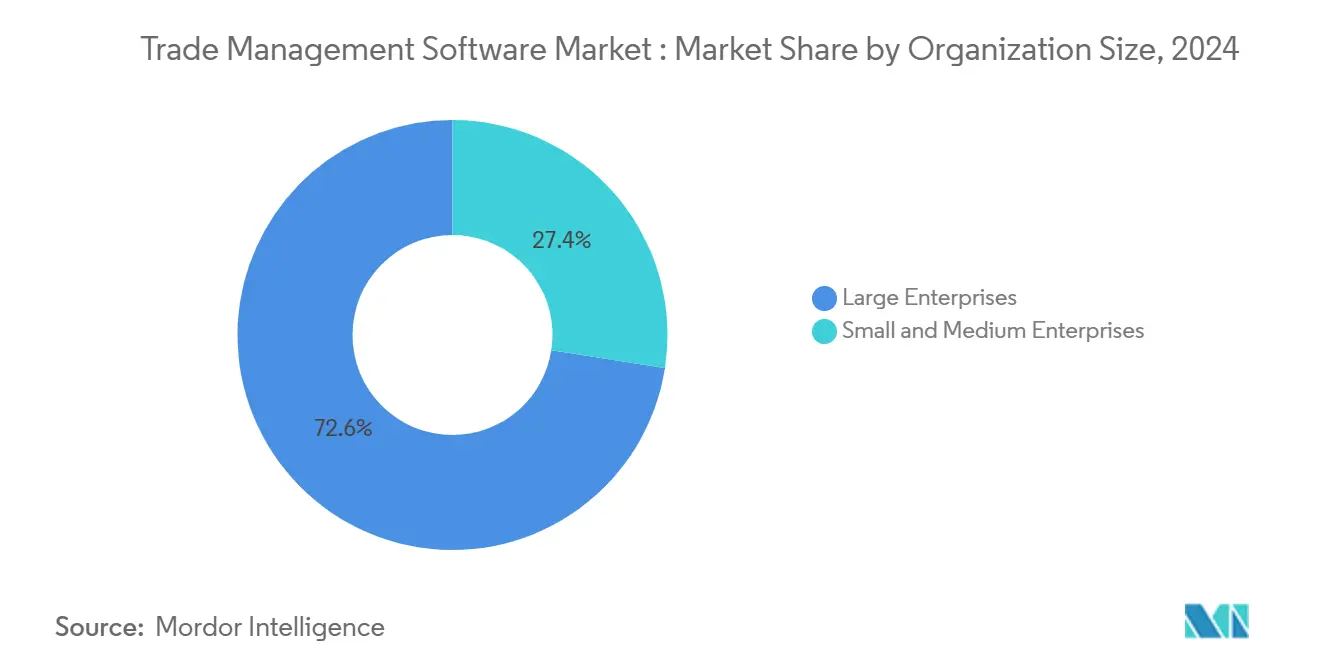
- By organization size, Large enterprises held 72% of the market in 2024; SMEs show the highest projected CAGR at 14.1% to 2030.
- By end-user industry, Transportation and Logistics accounted for a 34% share of the trade management software market size in 2024, whereas Pharmaceuticals is growing fastest at a 13.2% CAGR through 2030.
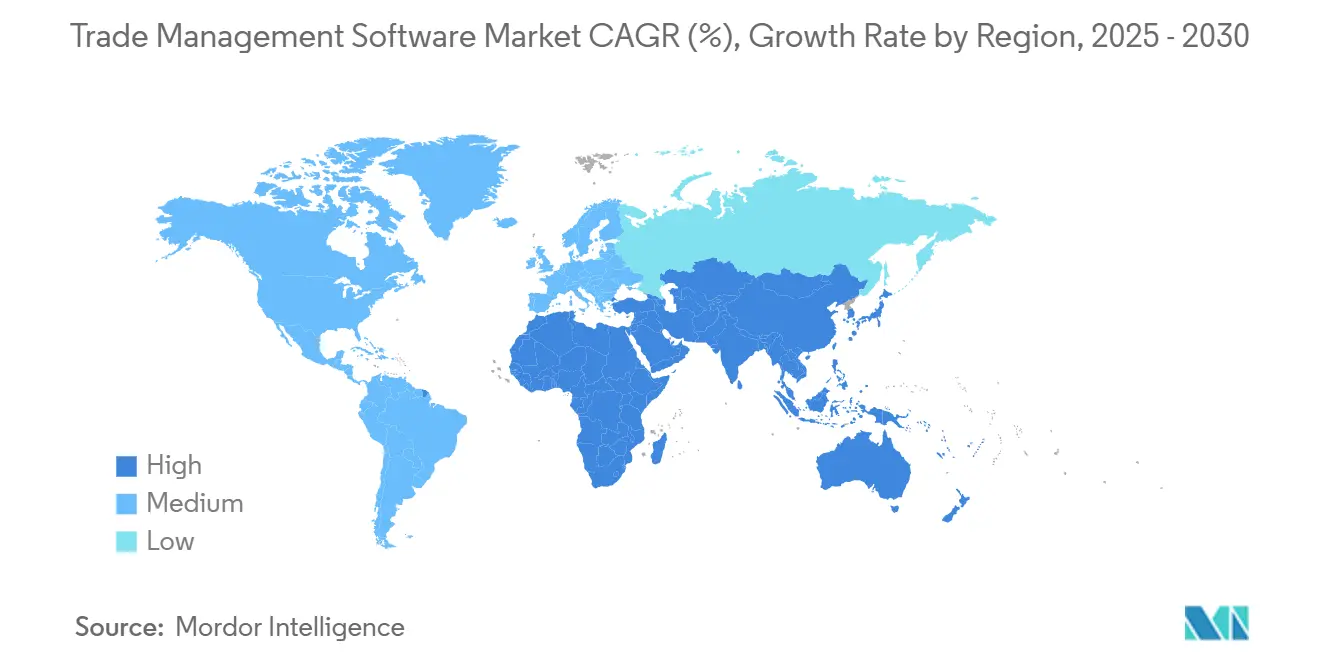
- By geography, North America commanded 40% of revenue in 2024; Asia-Pacific is forecast to lead growth with a 14.8% CAGR to 2030.
Global Trade Management Software Market Trends and Insights
Drivers Impact Analysis*
| Driver | (~) % Impact on CAGR Forecast | Geographic Relevance | Impact Timeline |
|---|---|---|---|
| Cloud-first deployments cut compliance cost | +2.3% | Global, with higher adoption in North America and Europe | Medium term (2–4 years) |
| Tightening export-control regimes spur spending | +2.8% | Global, with significant impact in North America, Europe, and Asia-Pacific | Short term (≤ 2 years) |
| Rise of omni-channel logistics and 3PL integration | +1.5% | Global, particularly strong in regions with developed e-commerce infrastructure | Medium term (2–4 years) |
| Customs-duty digital twins for scenario pricing | +1.8% | Global, with higher relevance in regions with complex tariff structures | Medium term (2–4 years) |
| ESG-linked tariff incentives and carbon border taxes | +1.2% | Europe, North America, with gradual expansion to other regions | Long term (≥ 4 years) |
| Growth in cross-border trade activities | +2.0% | Global, especially emerging markets and trade-intensive economies | Medium term (2–4 years) |
| Source: Mordor Intelligence | |||


Cloud-first deployments cut compliance cost
Cloud platforms remove on-premise hardware and related maintenance outlays, lowering total ownership costs by 30-40% and extending advanced compliance functionality to firms of all sizes.[1]Oracle, “What Is Global Trade Management?,” oracle.comAutomatic content updates keep rule sets current, allowing users to react 45% faster to regulatory changes and cut penalties by 35%. The model aligns with plans by 86% of CIOs to rebalance public-cloud workloads by 2025, signaling demand for flexible hosting patterns. Vendors include rapid API connectors to ERP and TMS suites, shrinking integration timelines and speeding returns on investment. Together, these benefits push importers and exporters to treat cloud deployment as a strategic lever rather than a simple technology swap.
Tightening export-control regimes spur spending
The January 2025 U.S. regulations on advanced computing items and AI model weights broaden license obligations and heighten audit risk.[2]SAP, “SAP Revenue Growth Management | Overview,” sap.com Similar measures under discussion in Europe further enlarge the compliance burden. Firms now require real-time restricted-party screening, dynamic license workflows, and tamper-proof audit trails. Record penalties for non-compliance in 2024 convinced boards to fast-track upgrades, especially in semiconductor, aerospace, and dual-use sectors. Platforms that blend screening, tariff classification, and auto-generated documents gain traction because they cut manual checks and move cargo faster.
Rise of omni-channel logistics and 3PL integration
Retailers and manufacturers juggling direct-to-consumer, marketplace, and wholesale channels depend on seamless data exchange with third-party logistics partners. Modern applications link TMS, YMS, and warehouse systems through open APIs, giving a central view of inbound and outbound flows.[3]TadaNow, “Top 5 Tariff Management Challenges for Multinational Enterprises,” tadanow.comAI engines analyze SKU, route, and duty data to select the least-cost lane in real time, lowering customs delays by 35% and improving on-time deliveries by 28%. Parcel-level compliance checks support exporters shipping small orders to jurisdictions with varied de minimis thresholds. While the trend is most visible in North America and Western Europe, similar needs are rising in Southeast Asia as cross-border e-commerce expands.
Customs-duty digital twins for scenario pricing
Digital twins mirror end-to-end supply chains, letting planners test tariff, carbon fee, and service-level changes before altering physical operations. Enterprises using twins report a 42% faster response to duty shifts and a 25% drop in tariff costs through optimized sourcing and routing. As the EU’s CBAM tightens, twins also forecast emissions-linked charges and guide lower-carbon routing. Integrating twin outputs with trade dashboards enables unified decision-making that balances landed cost, compliance, and ESG goals.
Restraints Impact Analysis*
| Restraint | (~) % Impact on CAGR Forecast | Geographic Relevance | Impact Timeline |
|---|---|---|---|
| Fragmented legacy IT slows system integration | -1.4% | Global, more pronounced in regions with older infrastructure | Medium term (2-4 years) |
| Shortage of trade-compliance data scientists | -0.9% | Global, particularly acute in emerging markets | Short term (≤ 2 years) |
| High upfront cost for SME adoption | -1.2% | Global, with higher impact in developing economies | Medium term (2-4 years) |
| Geopolitical "software-sanctions" risk vendor lock-out | -0.7% | Primarily affecting trade between geopolitical rivals | Long term (≥ 4 years) |
| Source: Mordor Intelligence | |||
Shortage of trade-compliance data scientists
Demand for professionals who blend analytics with export-control expertise is outrunning supply. Emerging markets feel the pinch as talent migrates, leaving local firms to lean on external consultants. The scarcity lengthens model-building cycles for predictive duty engines and limits full-feature adoption in early deployment years. To counter, suppliers embed guided workflows and low-code tools, but labor gaps remain a brake on rapid scaling world.[4]U.S. Department of Commerce, “Export Administration Regulations Update 2025,” commerce.gov
Fragmented legacy IT slows system integration
Many multinationals operate region-specific ERP and freight solutions that evolved independently over decades. When integration projects add modern compliance layers, timelines extend 60-80% beyond initial plans because data is siloed and formats differ. Technical debt inflates total cost as legacy code needs specialized skills, forcing firms to weigh sizeable modernization budgets against rising regulatory risk. Vendors ship pre-built connectors, yet complex mapping still slows rollouts and chips away at single-window visibility.
*Our forecasts treat driver/restraint impacts as directional, not additive. The impact forecasts reflect baseline growth, mix effects, and variable interactions.
Segment Analysis
By Component: Solutions lead while Services accelerate
The Solutions segment held 65.09% of revenue in 2024, reflecting intense demand for tools that automate restricted-party screening, origin management, and duty optimization. The trade management software market size for Solutions stood at USD 0.94 billion in 2024 and continues to expand as exporters seek single dashboards that cut errors and speed clearance workflows. Oracle, SAP, and Descartes are layering taxation, ESG, and security workflows onto core trade data sets.
Service partners manage configuration, change control, and user training. The Services slice is projected at a 12.5% CAGR from 2025-2030. Enterprises buying software-plus-service bundles secure quicker ROI because providers maintain HS code libraries and adapt documents as rules evolve. Advisory add-ons help customers map CBAM emission disclosures, while subscription support covers 24×7 monitoring, portal upkeep, and audit assistance. Collectively, this structure allows smaller importers to access expertise that once sat only in large compliance teams.

By Deployment Model: Cloud dominance accelerates
Cloud deployments captured 68.53% of 2024 spending and are forecast to grow at a 15.3% CAGR through 2030, sustaining the largest slice of the trade management software market. SaaS subscriptions cut capital cost and deliver automatic regulatory updates across every node. Hybrid models emerge among banks and defense contractors seeking data sovereignty, keeping controlled data on-premise while routing less-sensitive functions through scalable clouds.
An industry survey shows 86% of CIOs will repatriate select workloads to private cloud by 2025, aiming for optimized latency and cost. Vendors counter by shipping containerized microservices that run seamlessly on public, private, or edge nodes. Edge deployments at ports process documentation close to customs checkpoints, lowering latency and shrinking dwell time. This multi-modal architecture lets companies fine-tune risk tolerance while holding compliance content in sync across installations, thereby enlarging the addressable trade management software market.
By Organization Size: Large enterprises dominate while SMEs surge
Large enterprises controlled 72.55% of 2024 spending as their global footprints demand complex license validation, bonded-warehouse tracking, and audit logging. They use rule engines that classify goods, verify licenses, and create evidence for each shipment.
SMEs, however, are projected to record a 14.1% CAGR from 2025-2030 as usage-based pricing lowers entry thresholds. Cloud starter kits provide invoice-reader bots and chatbot guides for export declarations, while regional trade associations pilot shared-service hubs that deliver compliance reviews at marginal cost. If these pooled services mature, the trade management software industry could see faster democratization, increasing license counts even in lower-volume corridors.
By End-user Industry: Transportation leads while Pharmaceuticals accelerates
Transport and Logistics generated 34.75% of 2024 revenue because freight forwarders, 3PLs, and carriers need real-time duty engines embedded in routing and tender workflows. Integrated denied-party screening APIs block restricted shipments before pickup, while predictive engines continuously recompute landed cost by lane, improving carrier margins and client satisfaction.
Pharmaceutical and life-science firms hold the fastest growth outlook at a 13.2% CAGR through 2030. Heightened counterfeit risks and stricter cold-chain rules drive adoption of batch-level traceability, digital signatures, and origin certificates. AI models match tariff exemptions for humanitarian shipments, and regulators are harmonizing serial-number reporting across regions, pushing drug makers to implement end-to-end trade suites so that cargo avoids border holds that threaten product integrity.
Geography Analysis
North America retained 40% of trade management software market revenue in 2024, helped by world-class IT infrastructure and ongoing export-control reforms. The 2025 U.S. controls on AI model weights spur technology, aerospace, and semiconductor exporters to install dashboards that audit license coverage in real time. Retailers deploy customs digital twins to test sourcing alternatives and tariff scenarios, while new supply-chain security pacts impose extra reporting layers that strengthen demand for comprehensive compliance engines.
The Asia-Pacific region is projected to grow the fastest, with a 14.8% CAGR through 2030. Deeper RCEP ties, booming cross-border e-commerce, and government subsidies for digital trade are driving investment. SMEs dominate exporter counts yet often lack trained compliance officers. Low-cost, multilingual cloud suites offering wizard-driven classification and instant certificates of origin fill the gap, and single-window customs portals in economies like Singapore and Vietnam link directly to vendor APIs, cutting clearance times for compliant shipments.
Europe is restructuring trade processes around the CBAM, fully enforced from 2026. Importers of steel, cement, and aluminum must track embedded emissions and purchase carbon certificates, prompting investment in systems that link supplier carbon data with customs entries. Digital twins allow planners to test sourcing changes that minimize carbon outlays, while enterprises aim to merge CBAM datasets with Intrastat and Import Control System filings inside a single interface, reducing duplicate effort and data-entry errors.

Competitive Landscape
Roughly 45% of global revenue is held by the top five vendors, placing the trade management software market in a moderately concentrated band. WiseTech Global’s USD 2.1 billion acquisition of E2open in 2025 illustrates the drive to offer an end-to-end operating system covering purchase orders, tariffs, shipment milestones, and broker status updates on one stack. SAP and Oracle rely on extensive ERP footprints to cross-sell trade modules, while Descartes and Thomson Reuters differentiate through expansive content libraries and rapid restricted-party screening.
Suppliers are embedding machine-learning models that recommend optimal HS codes and flag duty-savings programs, trimming landed cost by up to 10%. Vendors also race to patent connectors pulling IoT sensor data into digital-twin engines, which refine duty forecasts for temperature-sensitive cargo. New self-service analytics let shippers model lane changes without consultant help, emphasizing user experience as the next battlefield.
White space remains in SME-focused subscriptions with fixed-fee onboarding. Start-ups offer browser-based classifiers that scan multilingual invoices and raise instant red-flag alerts. The global shortage of compliance data scientists enhances demand for these guided workflows, encouraging established vendors to layer no-code automation on top of deep content libraries.
Trade Management Software Industry Leaders
Oracle Corporation
SAP SE
Descartes Systems Group
Thomson Reuters (ONESOURCE)
E2open LLC
- *Disclaimer: Major Players sorted in no particular order

Recent Industry Developments
- May 2025: WiseTech Global completed its USD 2.1 billion acquisition of E2open, expanding its integrated trade and logistics platform.
- April 2025: Descartes added new sanctions and export-control content plus customs exchange-rate feeds to its Global Trade Intelligence suite.
- March 2025: E2open released AI-driven risk assessment and automated document processing upgrades to its compliance portfolio.
- January 2025: The U.S. Department of Commerce enacted new export controls on advanced computing items and AI model weights, widening license requirements.


Research Methodology Framework and Report Scope
Market Definitions and Key Coverage
Our study defines the trade management software market as every licensed platform or SaaS solution, together with its annual support fees, that lets importers, exporters, and logistics partners file customs data, calculate duties, screen sanctions, and orchestrate cross-border workflows across ocean, air, road, and rail moves.
Scope exclusion: hardware scanners, generic ERP freight modules, and fully bespoke in-house code are not counted.
Segmentation Overview
- By Component
- Solutions
- Vendor Management
- Import/Export Management
- Invoice and Duty Management
- Compliance and Risk Analytics
- Services
- Consulting
- Implementation and Integration
- Support and Maintenance
- Solutions
- By Deployment Model
- Cloud
- On-Premise
- By Organization Size
- Small and Medium Enterprises
- Large Enterprises
- By End-user Industry
- Transportation and Logistics
- Consumer Goods and Retail
- Pharmaceuticals and Life-Sciences
- Energy and Utilities
- Defense and Aerospace
- Electronics and High-Tech
- Other Industries
- By Geography
- North America
- United States
- Canada
- Mexico
- South America
- Brazil
- Argentina
- Rest of South America
- Europe
- Germany
- United Kingdom
- France
- Italy
- Russia
- Spain
- Switzerland
- Rest of Europe
- Asia-Pacific
- China
- India
- Japan
- South Korea
- Malaysia
- Singapore
- Vietnam
- Indonesia
- Rest of Asia-Pacific
- Middle East and Africa
- Middle East
- Saudi Arabia
- United Arab Emirates
- Turkey
- Rest of Middle East
- Africa
- Nigeria
- South Africa
- Rest of Africa
- Middle East
- North America
Detailed Research Methodology and Data Validation
Primary Research
Analysts interviewed customs brokers, trade-compliance heads, 3PL architects, and SaaS channel partners in North America, Europe, and Asia-Pacific. These discussions validated adoption triggers, average subscription fees, renewal cycles, and gap-filled assumptions that desk research could not address.
Desk Research
We began by mining public trade datasets such as UN Comtrade, U.S. Census FT-900, Eurostat COMEXT, and China Customs; these flows anchor shipment volumes that our model ultimately monetizes. Our team then reviewed WCO papers on SAFE standards, company filings, and usage metrics inside D&B Hoovers and Dow Jones Factiva to map active installations, license renewals, and the share of transactions migrating to cloud deployments. The sources named are illustrative only; many additional publications and statistics were referenced during data gathering and cross-checks.
Market-Sizing & Forecasting
A top-down reconstruction starts with global merchandise trade value, converts it to shipment lines, and applies adoption penetration by enterprise size and end industry. We then corroborate outputs with selective bottom-up tests, vendor revenue roll-ups, channel checks, and sampled ASP × volume to fine-tune totals. Key variables include tariff-code filing counts, cloud-subscription fee per shipment, SME cross-border parcel growth, regulatory update cadence, GDP, and container throughput trends. A multivariate regression blends these drivers, while manual gap handling adjusts for undisclosed regional billings.
Data Validation & Update Cycle
All figures pass automated variance scans, peer analyst reviews, and final senior sign-off. Models refresh yearly; interim updates trigger when major tariff shifts, vendor mergers, or new export control rules materially change the outlook.
Why Our Trade Management Software Baseline Commands Reliability
Estimates across publishers rarely align, because each firm selects different revenue components, currency conversions, and refresh cadences.
We include subscription, maintenance, and implementation revenue and roll cloud migration effects forward each year, whereas some studies freeze ASPs or leave services outside scope.
Benchmark comparison
| Market Size | Anonymized source | Primary gap driver |
|---|---|---|
| USD 1.45 B (2025) | Mordor Intelligence | |
| USD 1.31 B (2024) | Global Consultancy A | Omits services and applies flatter cloud premium factors |
| USD 1.18 B (2024) | Industry Association B | Uses legacy on-premise pricing and a narrower compliance function scope |
The comparison shows that Mordor Intelligence delivers a balanced, transparent baseline that decision makers can trace back to real trade flows, validated prices, and clearly explained assumptions.


Key Questions Answered in the Report
What is the current value of the trade management software market
The market is worth USD 1.45 billion in 2025 and is expected to reach USD 2.33 billion by 2030.
Which deployment model is expanding fastest
Cloud deployments hold a 15.3% CAGR through 2030 because subscription pricing lowers capital cost and updates arrive automatically.
Why is APAC the fastest-growing region?
Robust cross-border e-commerce, new trade pacts, and government digital trade incentives are pushing a 14.8% CAGR in APAC.
Which is the fastest growing region in Trade Management Software Market?
Middle East and Africa is estimated to grow at the highest CAGR over the forecast period (2025-2030).
How do export-control updates influence software demand?
Stricter U.S. and EU rules require real-time screening and license management, prompting firms to adopt modern trade management platforms.
Which end-user industry shows the highest growth rate?
Pharmaceuticals and life sciences post a 13.2% CAGR because anti-counterfeiting and traceability mandates demand advanced compliance tools.
Page last updated on:


