Procure To Pay Software Market Size and Share
Market Overview
| Study Period | 2020 - 2031 |
|---|---|
| Market Size (2026) | USD 10.3 Billion |
| Market Size (2031) | USD 16.07 Billion |
| Growth Rate (2026 - 2031) | 9.31% CAGR |
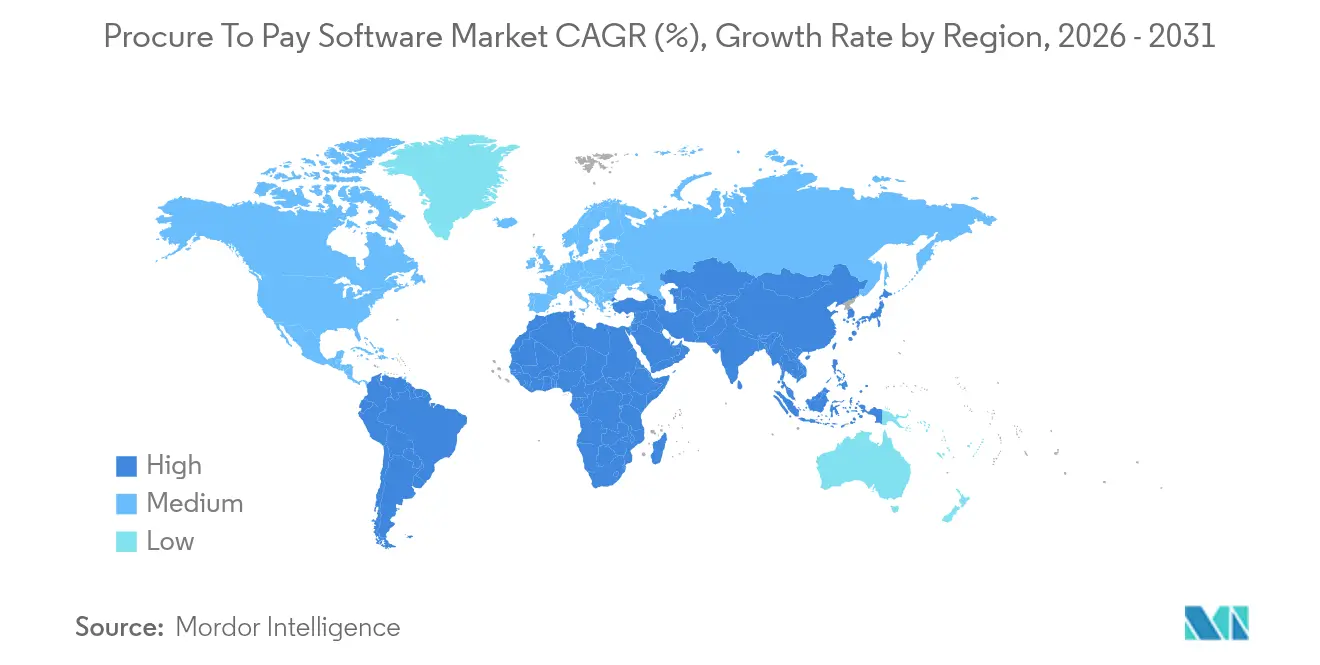
| Fastest Growing Market | Asia Pacific |
| Largest Market | North America |
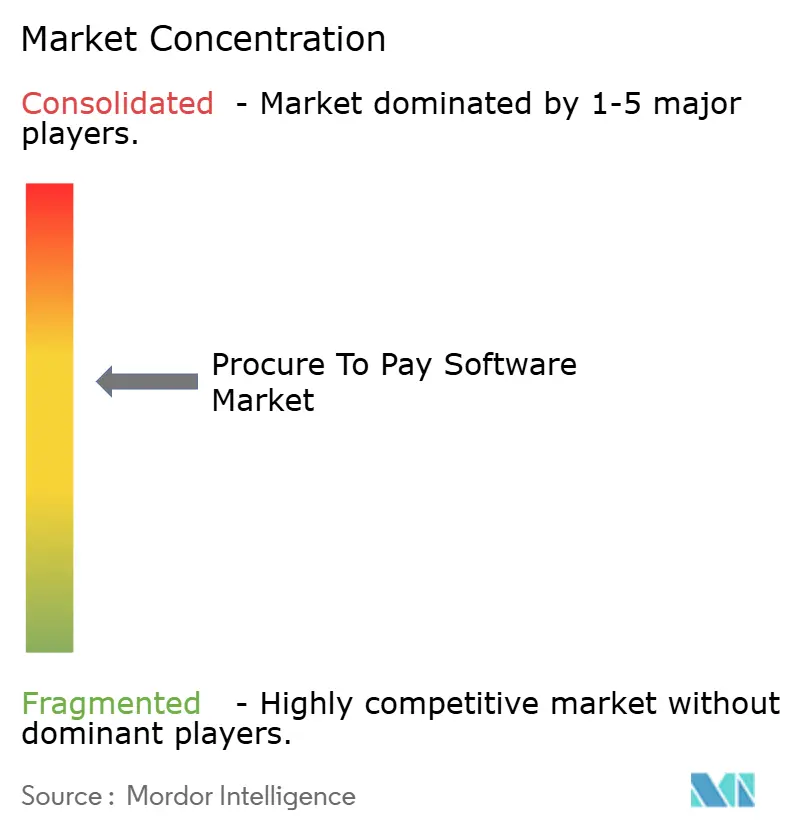
| Market Concentration | Medium |
Major Players *Disclaimer: Major Players sorted in no particular order Image © Mordor Intelligence. Reuse requires attribution under CC BY 4.0. | |
Procure To Pay Software Market Analysis by Mordor Intelligence
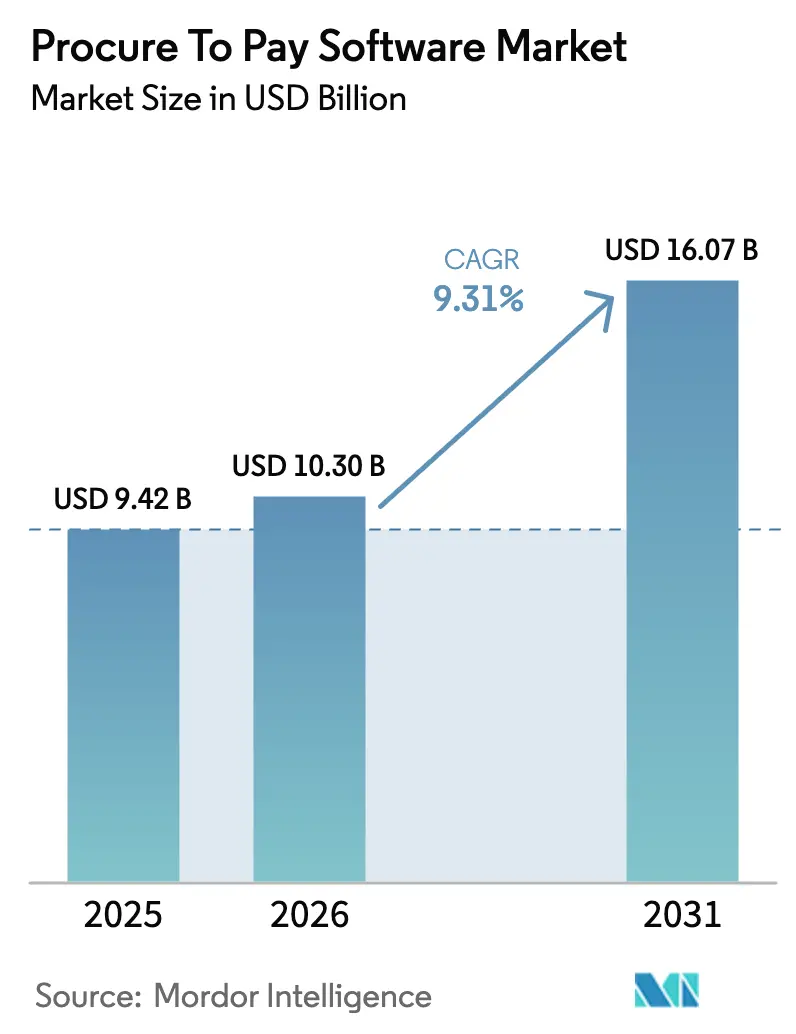
The Procure to Pay software market size is expected to grow from USD 9.42 billion in 2025 to USD 10.3 billion in 2026 and is forecast to reach USD 16.07 billion by 2031 at 9.31% CAGR over 2026-2031. Robust cloud adoption, expanding use of generative AI, and tightening sustainability mandates keep demand elevated across industries. Cloud-native deployments already account for most new projects, while integrated source-to-pay suites gain favor as enterprises consolidate point tools into unified ecosystems. Services-led transformation grows faster than licence sales because organizations want change-management expertise together with technology roll-outs. Regionally, North America retains leadership, yet Asia-Pacific grows faster as local firms modernize legacy ERP estates and leapfrog directly to cloud procurement.
Key Report Takeaways
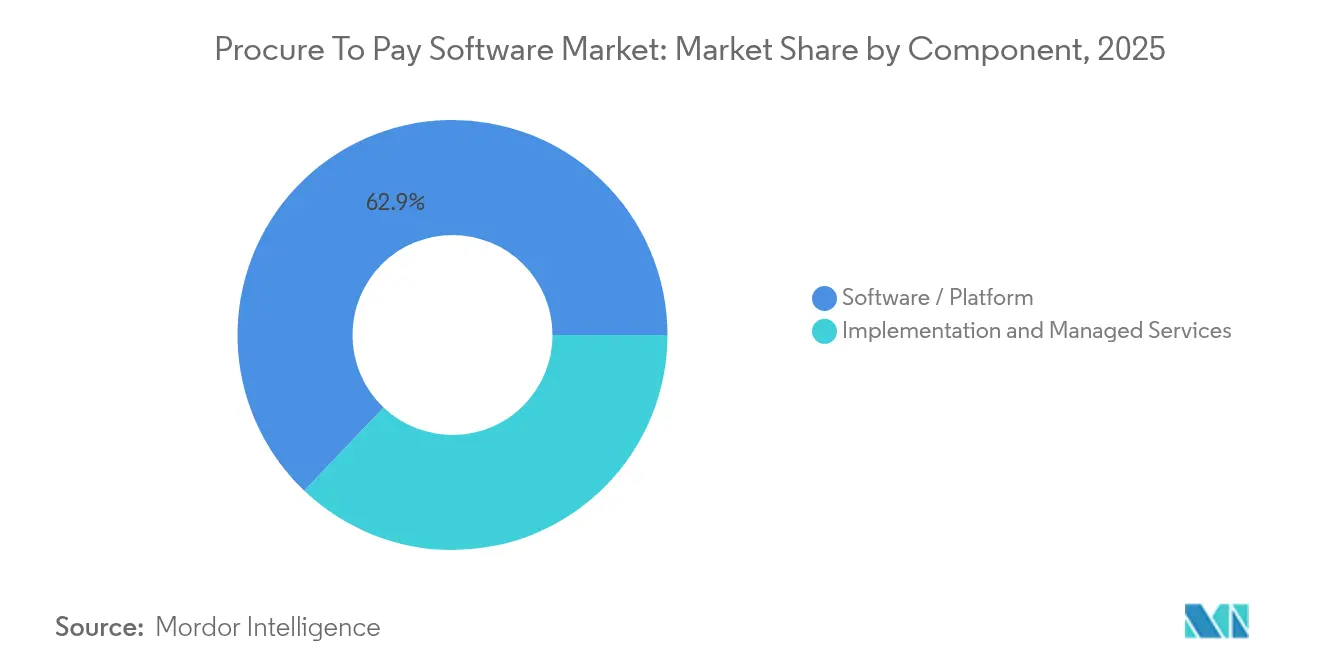
- By component, software platforms captured 62.90% of the Procure to Pay software market share in 2025, yet implementation and managed services are forecast to expand at 13.97% CAGR through 2031.
- By deployment, cloud solutions held 71.10% share of the Procure to Pay software market size in 2025; hybrid and cloud implementations are projected to grow at 12.98% CAGR to 2031.
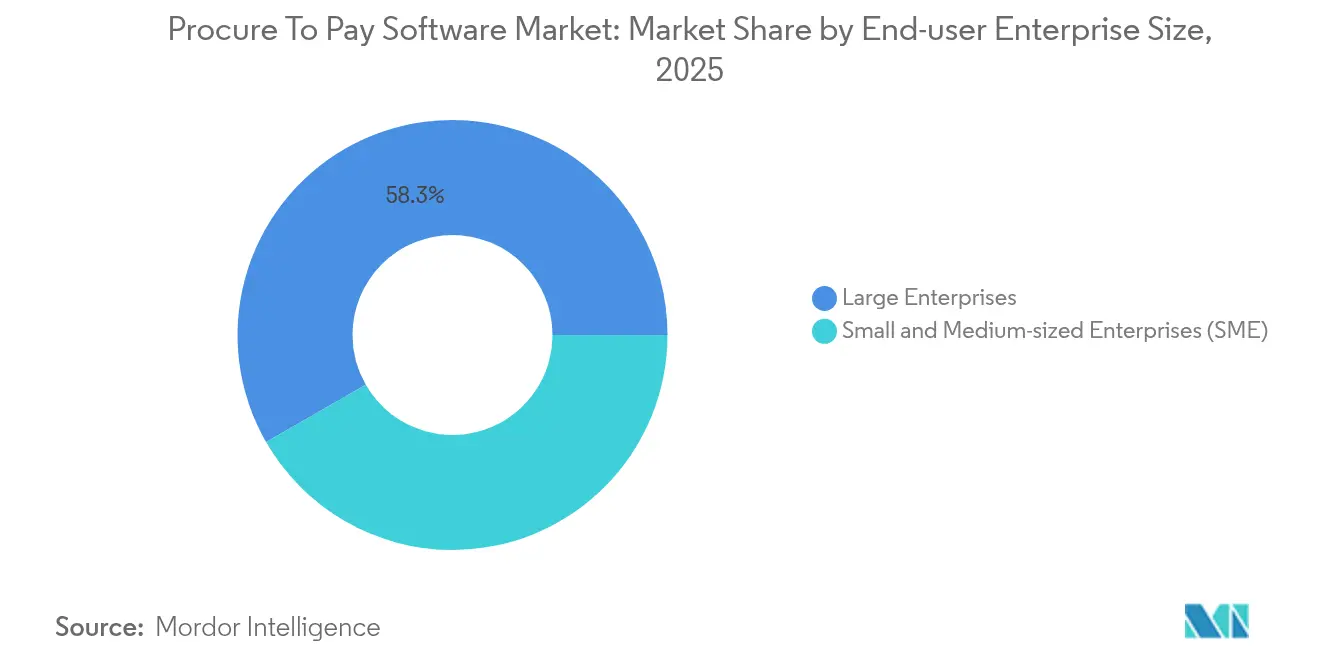
- By end-user enterprise size, large enterprises led with 58.30% revenue share in 2025, while small and medium enterprises are expected to record the fastest 12.31% CAGR between 2026 and 2031.
- By end-user industry, manufacturing accounted for 24.10% share of the Procure to Pay software market size in 2025; healthcare and life sciences are advancing at a 14.36% CAGR through 2031.
- By geography, North America commanded 39.10% of 2025 revenues, whereas Asia-Pacific is projected to grow at 12.22% CAGR to 2031.
Note: Market size and forecast figures in this report are generated using Mordor Intelligence’s proprietary estimation framework, updated with the latest available data and insights as of 2026.
Global Procure To Pay Software Market Trends and Insights
Drivers Impact Analysis*
| Driver | (~) % Impact on CAGR Forecast | Geographic Relevance | Impact Timeline |
|---|---|---|---|
| Escalating cloud adoption for procurement transformation | +2.1% | Global, with North America and Europe leading | Medium term (2-4 years) |
| Expansion of integrated source-to-pay suites | +1.8% | Global, concentrated in developed markets | Long term (≥ 4 years) |
| Rise of Gen-AI copilots for AP invoice data capture | +1.5% | North America and Asia-Pacific core | Short term (≤ 2 years) |
| ESG-linked supplier-spend analytics demand | +1.2% | Europe and North America, expanding to Asia-Pacific | Medium term (2-4 years) |
| Autonomous AP-to-cash convergence in shared services | +0.9% | Global | Long term (≥ 4 years) |
| Services-led procurement transformation demand | +0.7% | Global | Medium term (2-4 years) |
| Source: Mordor Intelligence | |||
Escalating Cloud Adoption for Procurement Transformation
Enterprises migrate procurement systems to cloud-native platforms to gain real-time spend visibility and automated compliance monitoring that on-premises tools lack. The model enables rapid scaling during volume swings and lowers infrastructure costs. Integration with external supplier networks becomes simpler, helping firms manage geopolitical and supply disruptions swiftly. The shift also supports distributed workforces by giving remote users equal access to procurement workflows. As sovereign clouds mature, regulated sectors can meet data-residency rules without sacrificing the operational benefits of public cloud.
Expansion of Integrated Source-to-Pay Suites
Organizations prefer unified suites that link sourcing, contracting, purchasing, and payment because they remove data silos and reduce reconciliation errors. Vendors differentiate through AI-powered spend analytics, supplier risk scoring, and contract intelligence that span the full lifecycle. Consolidation raises switching costs and discourages adoption of isolated point solutions, which lifts average contract value in the Procure to Pay software market.
Rise of Gen-AI Copilots for AP Invoice Data Capture
Generative AI now extracts invoice data, flags exceptions, and routes approvals with minimal manual touch. SAP’s Joule copilot within Ariba lets staff query spend data using natural language, cutting processing time by as much as 85% [1]SAP SE, “Introducing Joule AI Copilot for Business,” sap.com. Healthcare providers gain particular advantage because AI predicts stockouts and automates inventory top-ups. Faster cycle times improve supplier relationships and unlock early-payment discounts, lifting the value proposition of the Procure to Pay software market for cash-constrained buyers.
ESG-Linked Supplier-Spend Analytics Demand
Europe’s Corporate Sustainability Due Diligence Directive obliges companies to track Scope 3 emissions across supply tiers. Buyers therefore need procurement tools that embed emission data into sourcing decisions. JAGGAER’s ESG Goal module lets clients overlay carbon metrics on price comparisons, enabling balanced selections that meet both cost and sustainability targets[2]JAGGAER, “ESG Goals Platform Overview,” jaggaer.com. Vendors capable of furnishing such integrated analytics enjoy a competitive edge in winning long-term contracts.
Restraints Impact Analysis*
| Restraint | (~) % Impact on CAGR Forecast | Geographic Relevance | Impact Timeline |
|---|---|---|---|
| Legacy ERP lock-in among tier-2 manufacturers | -1.4% | Global, concentrated in manufacturing regions | Medium term (2-4 years) |
| Data-sovereignty concerns in public sector cloud | -0.8% | Europe and Asia-Pacific | Long term (≥ 4 years) |
| Shortage of certified implementation talent | -0.6% | Global | Short term (≤ 2 years) |
| Infrastructure limitations in emerging regions | -0.4% | South America and parts of MEA | Medium term (2-4 years) |
| Source: Mordor Intelligence | |||
Legacy ERP Lock-in Among Tier-2 Manufacturers
Many midsized factories still operate heavily customized ERP instances that lack modern APIs. Migrating these environments before SAP’s 2027 support deadline often costs more than USD 2 million, a hurdle that stalls new procurement roll-outs. Data silos further complicate real-time analytics, and production downtime risk deters leadership teams from green-lighting large replacements.
Data-Sovereignty Concerns in Public Sector Cloud
Government buyers must retain data inside national borders, yet only a handful of hyperscalers provide certified local zones. The UK Cabinet Office cited vendor lock-in as a budgeting obstacle when negotiating billions in cloud spend. Procurement projects therefore require lengthy legal reviews, extending cycle times and raising total cost of ownership.
*Our forecasts treat driver/restraint impacts as directional, not additive. The impact forecasts reflect baseline growth, mix effects, and variable interactions.
Segment Analysis
By Component: Services Drive Implementation Complexity
Software platforms maintained a 62.90% share of the Procure to Pay software market in 2025, buoyed by subscription revenues that finance ongoing RandD. Vendors such as Oracle recorded USD 6.7 billion in cloud revenue during fiscal 2025, a 27% year-over-year gain that validated demand for continuous feature expansion. The Procure to Pay software market size tied to services, however, is projected to rise more quickly, advancing at 13.97% CAGR as enterprises call for advisory, configuration, and managed operations support. Implementation partners thus emerge as critical gatekeepers for customer success.
The services premium reflects a recognition that digital procurement is less about deploying code and more about re-engineering approval chains, supplier onboarding, and data governance. SAP’s broader S/4HANA migration ecosystem highlights how integrators monetize long-term value streams via change-management programs. As AI adoption accelerates, demand grows for experts who can retrain models and optimize prompt libraries, reinforcing the importance of services within the Procure to Pay software market.


By Deployment: Cloud Infrastructure Dominates Digital Transformation
Cloud instances held 71.10% of the Procure to Pay software market share in 2025 and are expected to climb further as implementations rise at 12.98% CAGR to 2031. Pay-as-you-go pricing cuts capital outlays, while auto-scaling meets fluctuating invoice volumes during seasonal peaks. Hybrid architectures persist in sectors like financial services where regulators call for on-shore backups. Sovereign clouds are now bridging compliance gaps, enabling defense and public health agencies to shift sensitive procurement workloads off aged mainframes and into modern stacks.
On-premises investments remain in place for factories that rely on deterministic network performance and plant-floor integrations, yet even those users pilot cloud analytics above their transactional layers. Consequently, most new RFPs stipulate containerized microservices to future-proof deployments. This migration unlocks future upgrades such as edge-based AI inference for real-time fraud scoring, further cementing cloud’s dominance within the Procure to Pay software market.
By End-user Enterprise Size: SME Democratization Accelerates
Large enterprises generated 58.30% of total revenue in 2025 because global groups continue to harmonize purchasing across hundreds of sites. Yet small and medium enterprises display the steeper 12.31% CAGR since cloud subscriptions let them bypass hefty infrastructure costs. The Procure to Pay software market size captured by SMEs is expected to widen as low-code configuration reduces reliance on certified administrators. Vendors now bundle guided workflows and chat-based support so lean finance teams can self-deploy within weeks.
At the same time, platform providers target large accounts with AI copilots that analyze multiyear spend data and recommend contract renewals, locking in high-value enterprise renewals. Workday reports that more than 60% of Fortune 500 companies license its procurement functions. Even so, the long-tail SME segment remains attractive because of its sheer volume, prompting suppliers to design modular tiers priced per active supplier instead of blanket enterprise seats.
By End-user Industry: Healthcare Leads Vertical Transformation
Manufacturing possessed 24.10% share of the Procure to Pay software market size in 2025 due to its vast supplier networks and stringent traceability rules. Automotive plants integrate e-Kanban signals into procurement modules to trigger just-in-time orders, while electronics makers run multilevel BOM cost simulations to mitigate supply shocks. Despite this scale, healthcare and life sciences are forecast to record a 14.36% CAGR, the fastest among tracked industries.
Hospitals digitize purchase-to-pay flows to comply with anti-kickback statutes and to squeeze nonclinical costs during reimbursement pressures. AI models flag duplicate charges and recommend formulary substitutions, freeing clinicians to focus on patient care. In parallel, pharmaceutical firms embed ESG metrics into category strategies to satisfy regulators and investors alike. Retail, BFSI, public sector, and logistics each add steady volumes, yet the healthcare upswing signals a pivot toward mission-critical uses where procurement directly affects public safety and compliance exposure.
Geography Analysis
North America contributed 39.10% of global revenue in 2025, aided by an established SaaS culture, wide fiber coverage, and mature venture funding. Public-cloud penetration lets regional buyers trial new modules rapidly, and tight labor markets push firms to automate repetitive accounts payable tasks. The region’s forward stance on generative AI pilots further lifts adoption as early adopters validate ROI metrics for invoice capture.
Europe exhibits steady growth underpinned by ESG legislation that demands supply-chain transparency. Buyers there prioritize procurement suites with built-in sustainability dashboards and rigorous data-sovereignty controls. Germany, France, and the Nordics advance sovereign-cloud initiatives that certify regional data centers, enabling sensitive public-sector buyers to migrate workloads without breaching localization statutes.
Asia-Pacific posts the fastest 12.22% CAGR because firms modernize aging ERPs to participate in global supply-chain programs. Governments from India to Vietnam publish digitization roadmaps that encourage SME onboarding to e-invoicing mandates. Limited legacy lock-in lets many local companies leap directly to mobile-first procurement apps. South America and the Middle East & Africa trail due to bandwidth gaps and currency volatility, but infrastructure projects and trade-zone reforms promise medium-term upside in these underserved segments of the Procure to Pay software market.

Competitive Landscape
The Procure to Pay software market sits in a moderately consolidated state. SAP, Oracle, and Workday leverage end-to-end suites and deep enterprise relationships to defend share. Their embedded analytics, AI copilots, and ecosystem marketplaces present high switching costs for global conglomerates. SAP’s quarterly cloud revenue surpassed USD 9 billion in 2025, a strong signal of entrenched scale.
Specialist vendors meanwhile differentiate through vertical depth or user-experience simplicity. Coupa, now backed by Thoma Bravo, invests in AI-assisted sourcing while JAGGAER under Vista Equity focuses on ESG analytics. Zip and other start-ups position chat-native interfaces that automate intake-to-procure in small teams, creating pressure on incumbents to simplify workflows.
Acquisition activity remains brisk. Thoma Bravo folded Coupa into a broader fintech portfolio, Vista Equity merged Jaggaer assets to streamline R&D, and WiseTech Global acquired e2open to tie logistics execution with upstream procurement [3]WiseTech Global, “Completion of e2open Acquisition,” wisetechglobal.com. As platforms converge, white-space lies in supplier risk scoring, autonomous payment orchestration, and discrete compute at the network edge. Vendors that fuse these capabilities fastest will shape competitive outcomes in the Procure to Pay software market.
Procure To Pay Software Industry Leaders
SAP SE
Oracle Corporation
Coupa Software Incorporated
Basware Oyj
Jaggaer LLC
- *Disclaimer: Major Players sorted in no particular order

Recent Industry Developments
- June 2025: Entegra unveiled EPRO, powered by BirchStreet Systems, giving food-service clients multi-channel ordering and richer spend analytics.
- May 2025: WiseTech Global completed the acquisition of e2open, expanding its supply-chain platform with embedded procurement modules.
- January 2025: Stampli launched Procure to Pay, integrating purchase requests, PO creation, and invoice settlement into one interface.
- October 2024: Unimarket merged with VendorPanel to deliver a stronger source-to-pay suite to mid-market customers.


Global Procure To Pay Software Market Report Scope
The Procure-to-Pay (P2P) process integrates all procurement and payment activities within an organization. It encompasses the complete lifecycle of acquiring goods or services, beginning with requisition and purchase order creation, moving through supplier selection and invoice processing, and culminating in the final payment to suppliers.
Procure to pay software report is segmented by deployment (cloud, on-premises), by enterprise (SME, large enterprise), by end-user industry (BFSI, healthcare, public & institutions, retail, transportation, manufacturing, and other end-user verticals) and by geography (North America, Europe, Asia-Pacific, Latin America, and Middle East & Africa). The market sizes and forecasts are provided in terms of value (USD) for all the above segments.
| Software / Platform |
| Implementation and Managed Services |
| Cloud |
| On-Premises |
| Small and Medium-sized Enterprises (SME) |
| Large Enterprises |
| BFSI |
| Healthcare and Life-Sciences |
| Public Sector and Education |
| Retail and e-Commerce |
| Transportation and Logistics |
| Manufacturing |
| Others (Energy, IT and Telecom, Hospitality) |
| North America | United States | |
| Canada | ||
| Mexico | ||
| South America | Brazil | |
| Argentina | ||
| Rest of South America | ||
| Europe | Germany | |
| United Kingdom | ||
| France | ||
| Italy | ||
| Spain | ||
| Russia | ||
| Rest of Europe | ||
| Asia-Pacific | China | |
| Japan | ||
| India | ||
| South Korea | ||
| Australia and New Zealand | ||
| Rest of Asia-Pacific | ||
| Middle East and Africa | Middle East | Saudi Arabia |
| United Arab Emirates | ||
| Turkey | ||
| Rest of Middle East | ||
| Africa | South Africa | |
| Nigeria | ||
| Egypt | ||
| Rest of Africa | ||
| By Component | Software / Platform | ||
| Implementation and Managed Services | |||
| By Deployment | Cloud | ||
| On-Premises | |||
| By End-user Enterprise Size | Small and Medium-sized Enterprises (SME) | ||
| Large Enterprises | |||
| By End-user Industry | BFSI | ||
| Healthcare and Life-Sciences | |||
| Public Sector and Education | |||
| Retail and e-Commerce | |||
| Transportation and Logistics | |||
| Manufacturing | |||
| Others (Energy, IT and Telecom, Hospitality) | |||
| By Geography | North America | United States | |
| Canada | |||
| Mexico | |||
| South America | Brazil | ||
| Argentina | |||
| Rest of South America | |||
| Europe | Germany | ||
| United Kingdom | |||
| France | |||
| Italy | |||
| Spain | |||
| Russia | |||
| Rest of Europe | |||
| Asia-Pacific | China | ||
| Japan | |||
| India | |||
| South Korea | |||
| Australia and New Zealand | |||
| Rest of Asia-Pacific | |||
| Middle East and Africa | Middle East | Saudi Arabia | |
| United Arab Emirates | |||
| Turkey | |||
| Rest of Middle East | |||
| Africa | South Africa | ||
| Nigeria | |||
| Egypt | |||
| Rest of Africa | |||


Key Questions Answered in the Report
What is the current size of the Procure to Pay software market?
The Procure to Pay software market reached USD 10.3 billion in 2026 and is forecast to grow to USD 16.07 billion by 2031 at a 9.31% CAGR.
Which segment is growing fastest in this market?
Implementation and managed services post the highest 13.97% CAGR because enterprises need advisory and change-management skills to realize procurement transformation.
How dominant are cloud deployments?
Cloud solutions already capture 71.10% of market share and are projected to expand further at a 12.98% CAGR as more organizations prioritize scalability and lower capital outlay.
Which region leads and which grows fastest?
North America leads in revenue with a 39.10% share, while Asia-Pacific registers the fastest 12.22% CAGR thanks to rapid digital-transformation initiatives.
Page last updated on:


