Sales Software Market Size and Share
Market Overview
| Study Period | 2020 - 2031 |
|---|---|
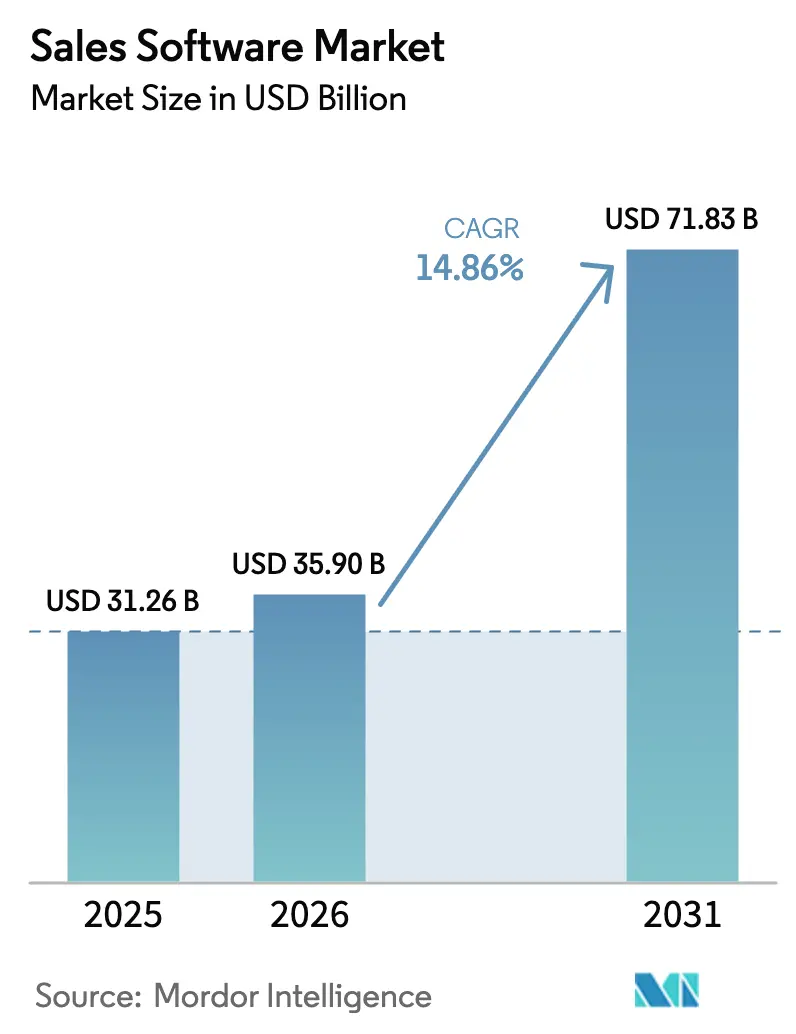
| Market Size (2026) | USD 35.9 Billion |
| Market Size (2031) | USD 71.83 Billion |
| Growth Rate (2026 - 2031) | 14.86% CAGR |
| Fastest Growing Market | Asia Pacific |
| Largest Market | North America |
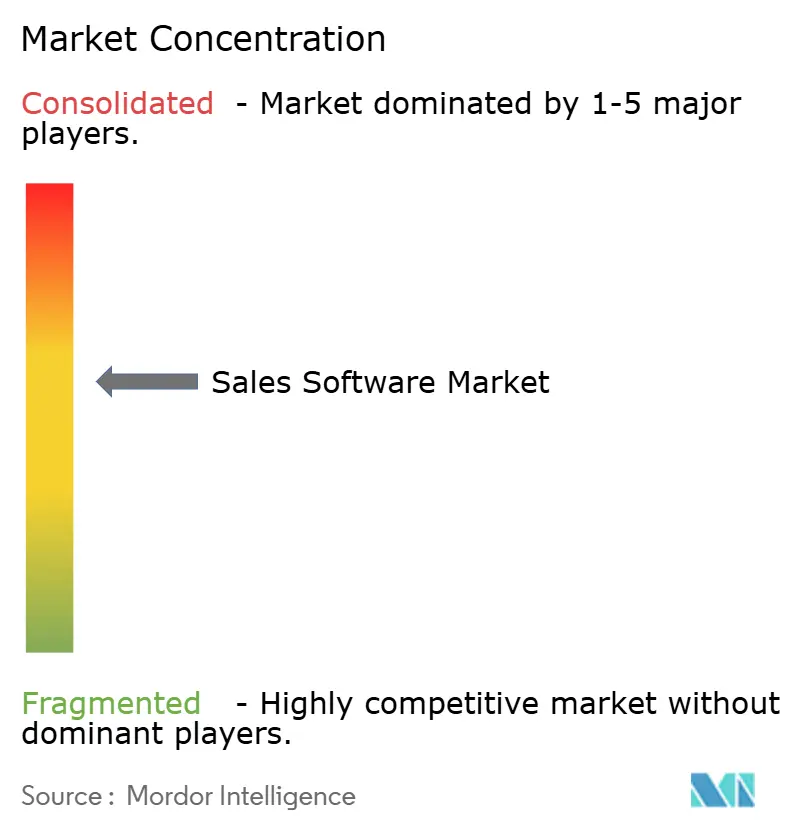
| Market Concentration | Medium |
Major Players *Disclaimer: Major Players sorted in no particular order Image © Mordor Intelligence. Reuse requires attribution under CC BY 4.0. | |
Sales Software Market Analysis by Mordor Intelligence
The sales software market size was valued at USD 31.26 billion in 2025 and estimated to grow from USD 35.9 billion in 2026 to reach USD 71.83 billion by 2031, at a CAGR of 14.86% during the forecast period (2026-2031). Growth rests on three intertwined shifts: near-universal cloud acceptance, accelerated deployment of generative-AI features, and the rise of unified revenue-operations (RevOps) suites that replace disconnected point tools. Enterprises now prioritize platforms that connect sales, marketing, service, and finance data in real time, while small and mid-sized businesses (SMBs) benefit from subscription models that lower entry costs. Vendors also gain from widening regulatory clarity around artificial intelligence and data protection, enabling faster product launches across regions. Competitive dynamics increasingly center on who can embed predictive analytics into everyday seller workflows without adding complexity.
Key Report Takeaways
- By software type, Sales CRM remained dominant with 40.22% of 2025 revenue; AI Sales Assistant and Conversational Intelligence tools are forecast to expand at 23.85% CAGR to 2031.
- By deployment model, cloud platforms commanded 71.95% of 2025 revenue and are growing at 18.78% through the forecast horizon.
- By end-user enterprise size, large companies accounted for 57.65% of 2025 spend, yet SMBs represent the fastest-growing cohort at 12.12% CAGR.
- By end-user industry, IT and Telecom held 23.95% of 2025 revenue, whereas Healthcare and Life Sciences is advancing at a 16.25% CAGR.
- By geography, North America led with 33.95% revenue share in 2025, while Asia-Pacific is projected to post a 13.45% CAGR through 2031.
Note: Market size and forecast figures in this report are generated using Mordor Intelligence’s proprietary estimation framework, updated with the latest available data and insights as of 2026.
Global Sales Software Market Trends and Insights
Drivers Impact Analysis*
| Driver | (~) % Impact on CAGR Forecast | Geographic Relevance | Impact Timeline |
|---|---|---|---|
| Cloud adoption and SaaS penetration | +3.2% | Global, Asia-Pacific fastest | Medium term (2-4 years) |
| Demand for sales-process automation | +2.8% | North America and Europe core, Asia-Pacific expanding | Short term (≤ 2 years) |
| AI-powered predictive and generative tools | +4.1% | North America and EU early, Asia-Pacific following | Long term (≥ 4 years) |
| Convergence toward RevOps platforms | +2.3% | Global enterprise focus | Medium term (2-4 years) |
| Rise of digital sales rooms | +1.9% | Global B2B markets | Short term (≤ 2 years) |
| API-first “in-product” sales tooling for PLG | +1.7% | North America and EU SaaS ecosystems | Medium term (2-4 years) |
| Source: Mordor Intelligence | |||
Cloud Adoption and SaaS Penetration
Cloud deployments already account for 72.6% of the sales software market and are growing at 19.10% CAGR. The migration from perpetual licenses to subscription contracts gives vendors recurring revenue and gives buyers faster access to new features. Europe’s AI Act and Data Act incentivize cloud-native compliance controls, tilting purchase decisions toward vendors that offer in-region data hosting and robust audit trails [1]European Commission, “The Artificial Intelligence Act,” digital-strategy.ec.europa.eu . Leading platforms such as Microsoft recorded USD 40.9 billion in cloud revenue in fiscal-year 2025, a 21% year-on-year gain that underscores the scale advantage of hyperscalers. Real-time synchronization across global teams further cements cloud as the default deployment choice.
Demand for Sales-Process Automation
Enterprises target repetitive tasks that still consume a majority of seller time. Modern workflow engines now trigger automatic data capture, quote generation, and contract routing, tightening hand-offs between marketing, sales, and service. Manufacturers deploying robotic process automation report material reductions in order-to-cash cycles, while retailers cut stockout incidents by layering inventory signals into the quoting process. Board-level pressure to reach aggressive revenue goals fuels continued investment despite broader IT budget scrutiny. Automation is therefore positioned less as cost-saving and more as revenue-expanding technology.
AI-Powered Predictive and Generative Tools
AI Sales Assistant and Conversational Intelligence modules are expanding at 24.60% CAGR, outpacing every other software type within the sales software market. Large language models now draft personalized emails, summarize call transcripts, and forecast win probabilities with far higher speed than manual methods. A single vendor update can push new algorithms to thousands of tenants overnight, magnifying reach and return on RandD spend. Microsoft’s Dynamics 365 business grew 19% last fiscal year, largely due to Copilot capabilities embedded across its product portfolio [2] Microsoft Corporation, “Q3 FY 2025 Earnings Press Release,” microsoft.com. Robust governance frameworks, including human-in-the-loop validation, mitigate hallucination risks in regulated industries.
Convergence Toward RevOps Platforms
Revenue-operations products blend CRM, marketing automation, and customer-success data into one shared workspace. Adoption accelerates as CFOs demand a single source of truth for pipeline, bookings, and renewals. Alphabet’s exploration of a USD 34 billion HubSpot purchase illustrates the strategic premium placed on platforms with end-to-end revenue capabilities. Integrated suites curb “tool sprawl,” reduce license overhead, and simplify analytics by eliminating manual data stitching.
Restraints Impact Analysis*
| Restraint | (~) % Impact on CAGR Forecast | Geographic Relevance | Impact Timeline |
|---|---|---|---|
| High subscription and integration costs | -2.1% | Global, most acute for SMBs | Short term (≤ 2 years) |
| Data-privacy / cross-border compliance | -1.8% | EU, Asia-Pacific | Medium term (2-4 years) |
| AI hallucination and brand-risk concerns | -1.3% | Global, regulated sectors | Long term (≥ 4 years) |
| Tool-sprawl and CRM fatigue | -1.6% | North America and Europe | Medium term (2-4 years) |
| Source: Mordor Intelligence | |||
High Subscription and Integration Costs
Procurement teams now examine payback periods with greater rigor, extending renewal cycles and compressing deal sizes. Integration projects routinely require external consultants to connect sales platforms with ERP, finance, and customer-service systems, inflating total cost of ownership. SMBs feel the pinch most acutely when upfront services rival annual license fees, slowing adoption even in segments eager for automation.
Data-Privacy and Cross-Border Compliance Hurdles
Regulations such as GDPR mandate strict handling of personal data, forcing vendors to build region-specific hosting environments and granular consent controls. Asia-Pacific nations add their own data-localization rules that complicate multi-country rollouts. Health-care and financial-services buyers often insist on in-country storage, adding infrastructure expense and compliance overhead that can offset the efficiency gains of cloud deployments.
*Our forecasts treat driver/restraint impacts as directional, not additive. The impact forecasts reflect baseline growth, mix effects, and variable interactions.
Segment Analysis
By Software Type: AI Tools Reshape CRM Leadership
Sales CRM held 40.22% revenue in 2025, sustaining the largest slice of the sales software market. Meanwhile, AI Sales Assistant and Conversational Intelligence categories are forecast to grow at 23.85% CAGR through 2031. This surge highlights a pivot from record-keeping to real-time guidance that elevates seller productivity. Sales Engagement suites now layer intent data onto CRM records, narrowing prospect lists and recommending next best actions. CPQ modules solve margin leakage by automating complex pricing scenarios and surfacing cross-sell packages. The “Others” cluster—digital sales rooms and API-first PLG add-ons—contains nascent offerings that often plug gaps left by legacy CRM products. Collectively, these innovations shift competition toward outcome-based value rather than feature counts.
The AI cohort also influences purchasing criteria. Buyers increasingly rate conversational intelligence not by word-cloud outputs but by its ability to enrich opportunity records automatically. Vendors that own both the engagement layer and the CRM database can train models on proprietary conversation data, forming high-entry-barrier flywheels. As a result, the sales software market size for AI-native modules will expand much faster than the core CRM base, though CRM maintains utility as the master record system.


By Deployment Model: Cloud Supremacy Deepens
Cloud deployment commands 71.95% market share in 2025 with 18.78% CAGR through 2031, driven by enterprises' need for real-time data synchronization, API integrations, and scalable infrastructure that supports global sales operations. Microsoft's cloud revenue reached USD 40.9 billion with 21% growth, demonstrating the platform economics that favor cloud-native solutions over on-premise alternatives. On-premise deployments persist in regulated industries and enterprises with specific data sovereignty requirements, though this segment contracts as cloud providers enhance security and compliance capabilities. Hybrid models emerge as a transitional approach for large enterprises managing legacy systems while adopting cloud-based functionality for new use cases and geographic expansion.
The cloud advantage extends beyond cost savings to encompass innovation velocity, as vendors can deploy new features and AI capabilities without requiring customer infrastructure upgrades. This deployment shift also enables product-led growth models where users can access functionality immediately without IT procurement processes, reducing sales cycles and improving user adoption rates.
By End-user Enterprise Size: SMB Uptake Accelerates
Large organizations contributed 57.65% of 2025 revenue, giving them the largest share in the sales software market. Yet SMB spending is rising at 12.12% CAGR, outpacing enterprise budgets on a percentage basis. Freemium entry tiers remove procurement friction, letting teams trial capabilities with minimal oversight. When value becomes evident, usage-based tiering converts free accounts into paid subscriptions, creating a scalable growth funnel. For vendors, customer-acquisition cost falls as product-led self-service replaces lengthy direct-sales cycles.
Enterprise buyers, by contrast, negotiate multi-year deals that include complex integrations and service-level guarantees. This mix stabilizes revenue but lengthens sales cycles. Interestingly, large enterprises are adopting PLG tactics internally, encouraging individual contributors to pilot new modules before IT formalizes a rollout. The convergence of buying behaviors underscores how user experience now matters as much as executive alignment in closing seven-figure contracts.

By End-User Industry: Healthcare Overtakes Growth Leadership
IT and Telecom remained the biggest vertical at 23.95% of 2025 revenue, reflecting historic early adoption and higher spend per employee. Healthcare and Life Sciences, however, is set to grow at 16.25% CAGR as providers digitize patient-engagement workflows and meet stringent audit requirements. Sales software helps life-science firms manage complex stakeholder networks, from payers and clinicians to regulators.
Financial-services institutions continue to widen usage for wealth-management and commercial-lending teams that rely on clear pipeline visibility and regulatory audit trails. Manufacturing companies use CPQ and digital-sales-room modules to speed quoting cycles and capture engineer-to-order variations. Retail and e-commerce players integrate CRM data with inventory systems to power omnichannel promotions. Across sectors, the sales software market size tied to compliance-heavy industries outpaces that of discretionary spend categories, as governance features become purchase prerequisites.
Geography Analysis
North America kept its 33.95% hold on global revenue in 2025. A critical mass of software vendors, systems integrators, and venture funding fuels rapid product iteration, giving local buyers earlier access to AI features. The United States remains the single largest country market, while Canadian and Mexican firms capitalize on cross-border frameworks such as USMCA to adopt similar technology stacks.
Asia-Pacific is the fastest-growing region, set to expand at 13.45% CAGR through 2031. China’s push for indigenous cloud platforms and India’s thriving global-services economy lift adoption across both domestic champions and multinational subsidiaries. Southeast Asian nations invest in digital trade infrastructure that favors cloud-native sales platforms. Localization mandates encourage regional data centers, driving partnerships between global vendors and local hyperscalers to satisfy sovereignty rules.
Europe advances steadily, with Germany, France, and the United Kingdom accounting for over half of regional spend. The European Commission’s Digital Decade program aims for 75% of enterprises to deploy cloud-edge solutions by 2030, giving sales software a clear policy tailwind . Vendors differentiate through multilingual interfaces, GDPR-compliant data handling, and industry-specific templates aligned to sectoral guidelines. Market entrants that underestimate local integration and support needs often struggle to build sustainable share.


Competitive Landscape
The market is moderately concentrated. Salesforce, Microsoft, Oracle, and SAP anchor the top tier, while fast-growing challengers such as HubSpot and Freshworks specialize in SMB and mid-market segments. Microsoft’s Dynamics 365 posted 19% revenue growth last fiscal year on the strength of its Copilot AI layer embedded across productivity and ERP suites. Platform vendors are executing multi-cloud strategies to satisfy data-residency rules and reduce single-cloud dependency.
Strategic acquisitions intensify platform depth. Alphabet’s interest in HubSpot signals a drive to connect advertising data with downstream revenue metrics. Salesforce’s reported bid for Informatica underscores demand for unified data-integration backbones. Vendors also invest heavily in open APIs and low-code tooling to foster third-party app ecosystems that lock in customers through network effects.
Specialist suppliers carve profitable niches by addressing vertical requirements—for example, HIPAA-compliant patient engagement in healthcare or MiFID II record-keeping in capital markets. Many later license their intellectual property to larger platforms, monetizing innovation without scaling global sales teams. The result is a continuously evolving competitive mix where partnership networks and ecosystem mindshare matter as much as direct feature parity.
Sales Software Industry Leaders
Microsoft Corporation
Salesforce, Inc.
Oracle Corporation
SAP SE
HubSpot, Inc.
- *Disclaimer: Major Players sorted in no particular order

Recent Industry Developments
- April 2025: ServiceNow signed a definitive agreement to acquire Logik.ai, expanding its Configure-Price-Quote capabilities and strengthening its Sales and Order Management portfolio.
- April 2025: Actifai and GOCare launched a partnership that merges real-time sales intelligence with advanced customer-communication tools for broadband service providers.
- March 2025: SoftwareOne opened new Digital Sales Hubs in Bogotá and São Paulo in collaboration with Microsoft to extend AI-driven sales support to SMBs across the Americas and Europe.
- February 2025: Banzai International completed the USD 53.2 million acquisition of Act-On Software, enhancing its AI-driven marketing suite and positioning to compete with integrated revenue-platform leaders.


Research Methodology Framework and Report Scope
Market Definitions and Key Coverage
Our study defines the sales software market as all license-based or subscription SaaS applications that help frontline and inside teams identify prospects, manage pipelines, configure price quotes, forecast revenue, and monitor individual or team performance across physical and digital channels.
Scope Exclusion: Stand-alone marketing-only suites, customer-service ticketing tools, and professional implementation services are excluded from the value model.
Segmentation Overview
- By Software Type
- Sales CRM
- Sales Engagement/Enablement
- AI Sales Assistant and Conversational Intelligence
- CPQ and Proposal Automation
- Sales Analytics/Forecasting
- Auto-Dialer and Outreach
- Others
- By Deployment Model
- Cloud
- On-premise
- Hybrid
- By End-user Enterprise Size
- Large Enterprises
- Small and Medium Enterprises (SMEs)
- By End-user Industry
- Retail and E-commerce
- IT and Telecom
- BFSI
- Healthcare and Life Sciences
- Manufacturing
- Automotive
- Professional Services
- Others
- By Geography
- North America
- United States
- Canada
- Mexico
- South America
- Brazil
- Argentina
- Rest of South America
- Europe
- Germany
- United Kingdom
- France
- Italy
- Spain
- Russia
- Rest of Europe
- Asia-Pacific
- China
- Japan
- India
- South Korea
- Australia and New Zealand
- Rest of Asia-Pacific
- Middle East and Africa
- Middle East
- Saudi Arabia
- United Arab Emirates
- Turkey
- Rest of Middle East
- Africa
- South Africa
- Nigeria
- Egypt
- Rest of Africa
- Middle East
- North America
Detailed Research Methodology and Data Validation
Primary Research
Mordor analysts interviewed product managers at global and regional software vendors, RevOps leaders in large enterprises, and founders of fast-growing SMB users in North America, Europe, Asia-Pacific, and Latin America. These conversations confirmed typical seat counts, AI-feature attach rates, and regional discounting, filling gaps found in secondary material.
Desk Research
Our team first mapped the enterprise spending pool using publicly available data sets such as the US Census ICT survey, Eurostat cloud uptake dashboard, OECD ICT Development Index, and India's NSS ICT access tables. We complemented these with industry views from the Sales Enablement Society, International Data Corporation's public notes, and RevOps Alliance white papers, which clarify adoption curves and seat penetration patterns across company sizes.
Company 10-Ks, quarterly cloud revenue disclosures, venture-funding databases, and news archives in D&B Hoovers and Dow Jones Factiva then helped us benchmark vendor-level run rates, average selling prices, and churn. The sources listed are illustrative; numerous other open and subscription resources informed data collection and validation.
Market-Sizing & Forecasting
A top-down model starts with regional business-software outlays, isolating the sales-software share through production and trade data re-casts, then allocates by company size and deployment mode. Select bottom-up checks, public vendor revenue roll-ups, sampled ASP x active seats, and channel-partner shipment logs align totals. Key variables fed into the model include cloud-migration rate, average spend per revenue-facing employee, AI-driven upsell uplift, SMB formation trends, and vendor net-expansion rates. Forecasts use multivariate regression that links these drivers to historic spend while scenario analysis stress tests macro shocks; expert panel consensus guides the final mid-case. Gaps in granular bottom-up inputs are bridged by weighted regional proxies and verified during stakeholder callbacks.
Data Validation & Update Cycle
Triangulation, variance thresholds, and peer review precede sign-off. Analysts compare outputs with independent indicators such as SaaS stock cohort growth and software producer price indices, revisiting anomalies before publication. We refresh every twelve months and issue interim tweaks when material vendor M&A or regulatory shifts occur, ensuring clients always receive the latest calibrated view.
Why Mordor's Sales Software Baseline Earns Decision-Makers' Confidence
Published estimates vary because firms pick different functional scopes, price-capture rules, and refresh cadences. Some count only lead-generation or inside-sales tools, while others lump sales, marketing, and service suites together, leading to sizable spread.
Key gap drivers are scope width, treatment of AI add-ons, and whether shadow IT spend is captured. For example, a niche study that tracks only inside-sales workstations lands far below our total, whereas a broad platform study that folds marketing automation inflates numbers. Currency translation points and forecast aggressiveness add further separation, especially when publishers leave assumptions untested.
Benchmark comparison
| Market Size | Anonymized source | Primary gap driver |
|---|---|---|
| USD 31.26 B (2025) | Mordor Intelligence | - |
| USD 7.18 B (2024) | Global Consultancy A | Tracks only inside-sales functions; excludes AI upsell modules and revenue operations suites. |
| USD 73.5 B (2025) | Industry Publisher B | Bundles marketing and service software, applies single top-down ratio without bottom-up validation. |
In short, Mordor's disciplined scope, dual-approach modeling, and annual refresh cadence deliver a balanced, transparent baseline that executives and investors can trace to clear variables and repeat with confidence.


Key Questions Answered in the Report
What is the current value of the sales software market?
The market is valued at USD 35.9 billion in 2026 and is on course to reach USD 71.83 billion by 2031.
Which region is growing fastest?
Asia-Pacific leads with a forecast 13.45% CAGR through 2031, driven by large-scale digital-transformation programs.
What deployment model dominates sales software?
Cloud accounts for 71.95% of 2025 revenue and is expanding at 18.78% CAGR as enterprises favor rapid feature delivery and lower infrastructure overhead.
Which software segment will grow quickest?
AI Sales Assistant and Conversational Intelligence solutions are projected to rise at 23.85% CAGR, reflecting demand for predictive insights and generative content.
Why are RevOps platforms gaining traction?
They unify sales, marketing, and customer-success data, providing executives with a single view of revenue and removing inefficiencies caused by tool sprawl.
How are rising compliance requirements affecting adoption?
Regulations such as GDPR and Asia-Pacific data-localization laws increase demand for region-specific hosting and advanced governance controls, raising implementation effort but also encouraging vendors to offer compliant cloud options.
Page last updated on:


