Voluntary Carbon Market Size and Share
Market Overview
| Study Period | 2020 - 2031 |
|---|---|
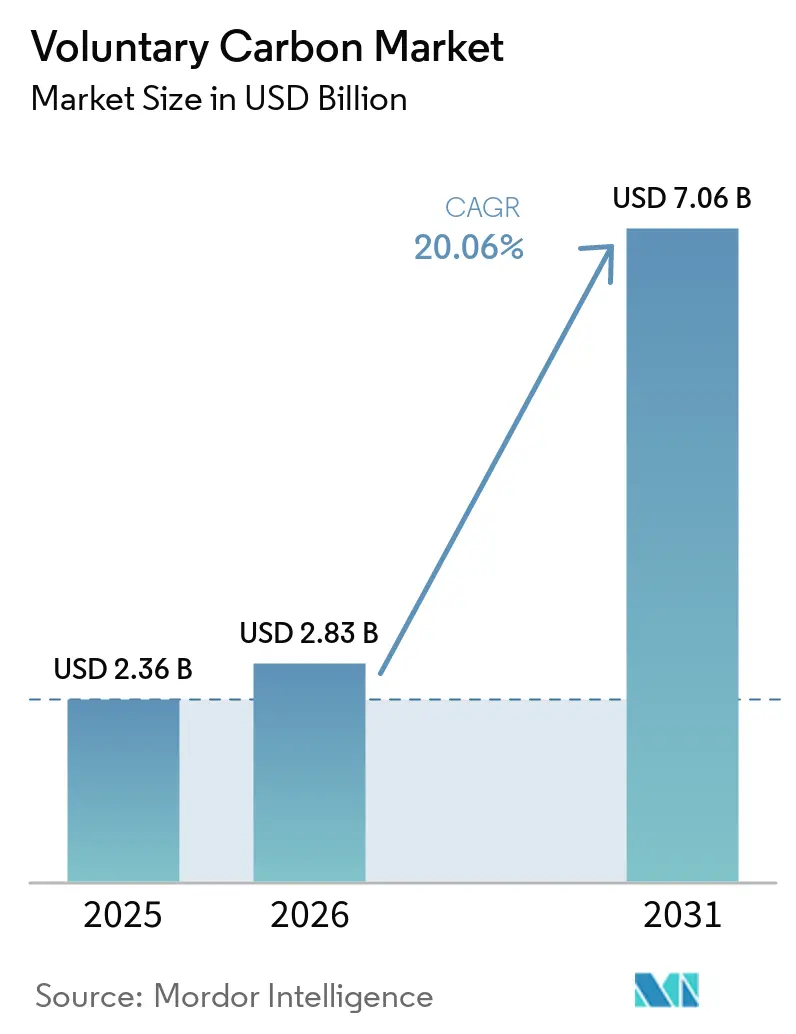
| Market Size (2026) | USD 2.83 Billion |
| Market Size (2031) | USD 7.06 Billion |
| Growth Rate (2026 - 2031) | 20.06% CAGR |
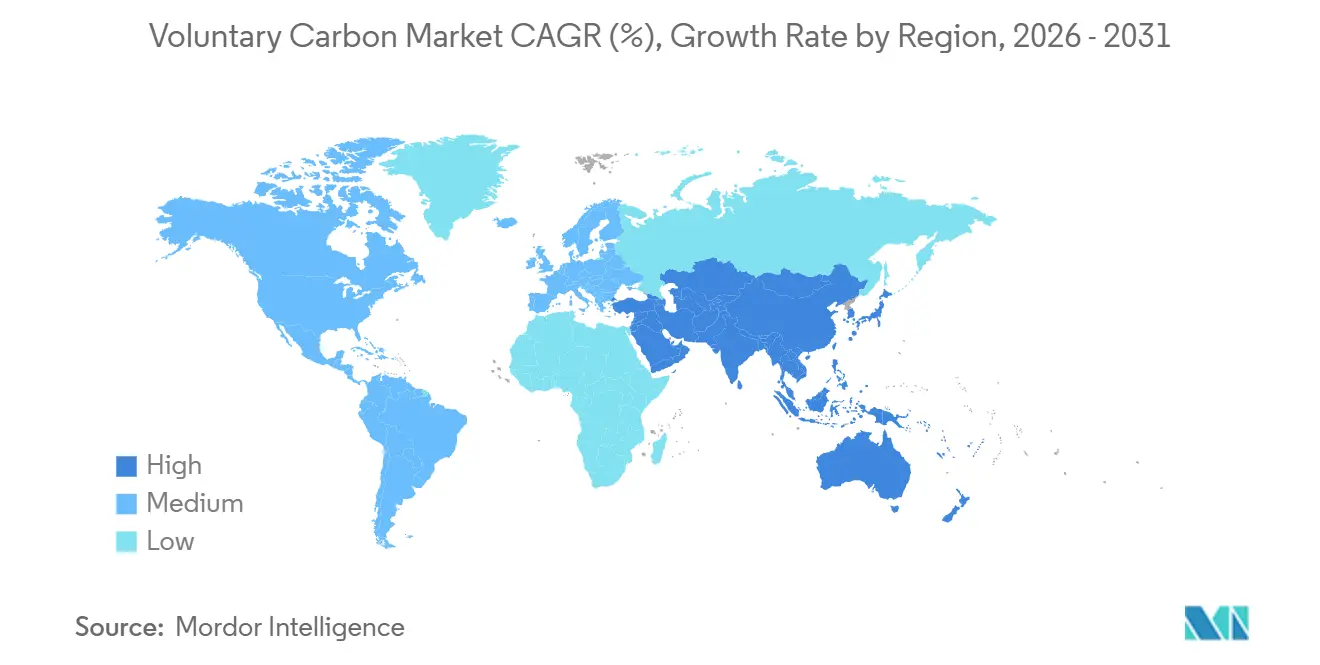
| Fastest Growing Market | Asia-Pacific |
| Largest Market | North America |
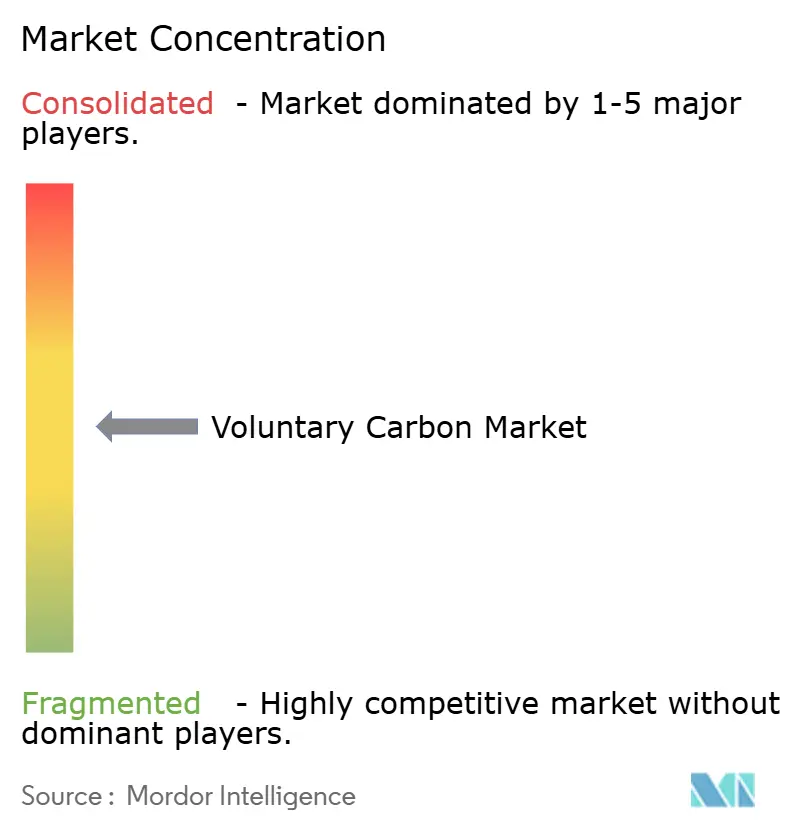
| Market Concentration | Medium |
Major Players *Disclaimer: Major Players sorted in no particular order Image © Mordor Intelligence. Reuse requires attribution under CC BY 4.0. | |
Voluntary Carbon Market Analysis by Mordor Intelligence
The voluntary carbon market was valued at USD 2.36 billion in 2025 and is estimated to grow from USD 2.83 billion in 2026 to USD 7.06 billion by 2031, at a CAGR of 20.06% during the forecast period 2026-2031. The voluntary carbon market is moving into a more formal phase as corporate climate spending shifts from annual offset purchases to longer procurement plans tied to net-zero targets. Demand is becoming more selective as buyers place greater weight on credit quality, durability, and legal defensibility in public claims. This is creating a wider commercial gap between older avoidance credits and premium removal credits, especially where supply remains limited. The voluntary carbon market also remains uneven across the value chain, with fragmented project development and intermediation sitting alongside more concentrated registry and exchange infrastructure. Near-term growth still depends less on headline demand and more on whether verified high-quality supply can scale fast enough to meet contracts already in place.
Key Report Takeaways
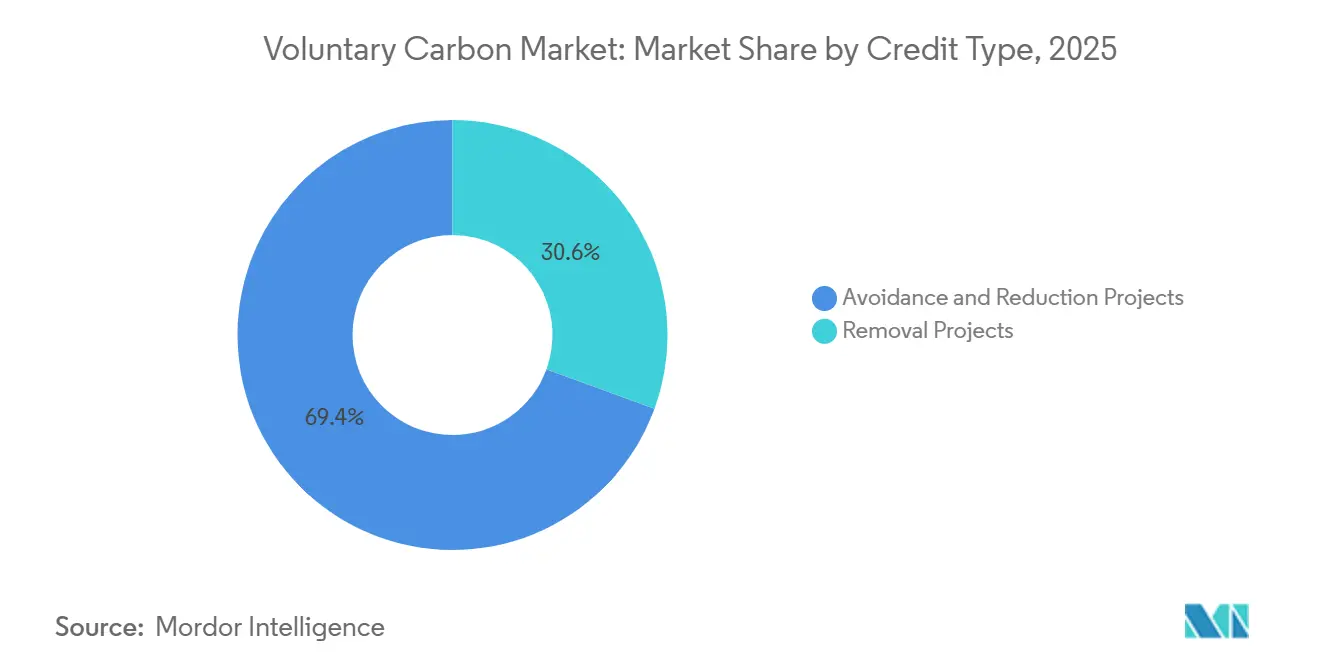
- By credit type, avoidance and reduction projects held 69.43% share in the voluntary carbon market in 2025, while removal projects are projected to expand at a 23.71% CAGR through 2031.
- By project category, renewable energy projects accounted for 39.72% share in 2025, while waste management and methane avoidance projects are projected to grow at a 21.83% CAGR through 2031.
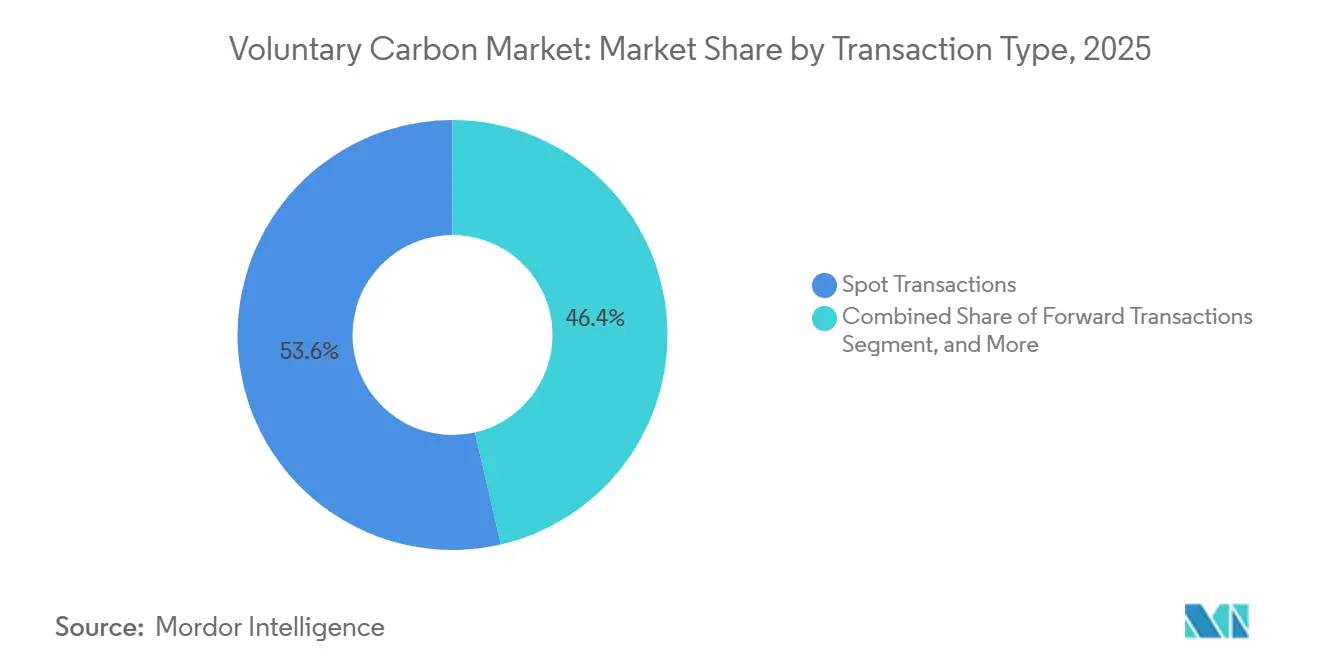
- By transaction type, spot transactions represented 53.61% share in 2026, while forward transactions are projected to grow at a 24.76% CAGR through 2031.
- By end user, energy and utilities held 32.14% share in 2025, while consumer goods and retail are projected to expand at a 25.48% CAGR through 2031.
- By geography, North America held 37.61% of the voluntary carbon market share in 2025, while Asia-Pacific is projected to grow at a 22.19% CAGR through 2031.
Note: Market size and forecast figures in this report are generated using Mordor Intelligence’s proprietary estimation framework, updated with the latest available data and insights as of January 2026.
Global Voluntary Carbon Market Trends and Insights
Drivers Impact Analysis*
| DRIVER | (~) % IMPACT ON CAGR FORECAST | GEOGRAPHIC RELEVANCE | IMPACT TIMELINE |
|---|---|---|---|
| Corporate Net-Zero Commitments and Scope 3 Targets | +7.0% | Global, with concentration in North America and EU | Medium term (2-4 years) |
| Shift Toward High-Integrity Credits and Buyer Scrutiny | +3.5% | Global, early adoption in North America and EU | Short term (≤ 2 years) |
| Demand for Durable Carbon Removal for Hard-to-Abate Sectors | +3.0% | North America, EU, emerging in APAC | Long term (≥ 4 years) |
| Expansion of Digital MRV, Registry Interoperability, and Traceability Tools | +2.5% | Global, with emerging markets catching up | Medium term (2-4 years) |
| Structured Finance for Forward Offtake and Credit Inventory | +2.0% | North America and EU | Medium term (2-4 years) |
| Emerging Cross-Border Recognition of High-Integrity Carbon Units | +1.5% | APAC core, spill-over to Middle East and Africa | Long term (≥ 4 years) |
| Source: Mordor Intelligence | |||
Corporate Net-Zero Commitments and Scope 3 Targets
More than 12,000 companies had SBTi-approved targets in 2025, which gives the voluntary carbon market a broad and durable demand base tied to formal decarbonization plans rather than discretionary spending. As 2030 milestones approach, these commitments are pushing carbon credit procurement into operational decisions involving supply chains, product claims, and investor communication.[1]Science Based Targets initiative, “SBTi Progress Report 2025,” Science Based Targets initiative, sciencebasedtargets.org The pressure is greater for Scope 3 emissions because disclosure expectations now reach beyond direct operations and force buyers to look at residual emissions across upstream and downstream activities. This is why the voluntary carbon market is seeing more interest in multi-year purchasing structures instead of one-time retirements linked only to annual reporting cycles. It also helps explain why buyers are treating access to credible future supply as a strategic issue rather than a short-term sustainability expense.
Shift Toward High-Integrity Credits and Buyer Scrutiny
The voluntary carbon market is separating into a premium tier of credits that can support public claims and a lower-priced tier that faces rising scrutiny on additionality and permanence. VCMI required CCP-approved or Article 6.4 credits for climate claims from January 2026, which raised the practical procurement threshold for institutional buyers. ICVCM had approved 9 carbon-crediting programs and covered around 107 million CCP-eligible credits by April 2026, which is expanding the addressable pool of credits that meet stronger integrity screens. ICVCM also reported that CCP-labeled credits were earning an average premium of around 25%, which shows that quality is influencing price formation in a more visible way.[2]Integrity Council for the Voluntary Carbon Market, “Integrity Council Announces New Batch of Assessment Decisions,” Integrity Council for the Voluntary Carbon Market, icvcm.org In the voluntary carbon market, this raises pressure on legacy avoidance developers while strengthening the position of suppliers with auditable and higher-durability portfolios.
Demand for Durable Carbon Removal for Hard-to-Abate Sectors
The voluntary carbon market is seeing a stronger long-term pull for durable removal because sectors such as aviation, steel, cement, and shipping still face limits on direct decarbonization. SWISS signed a multi-year agreement with Neustark for permanent CO₂ storage through mineralization, which showed that aviation buyers are beginning to contract for permanent removal rather than rely only on conventional offsets. Carbon Direct stated in early 2026 that fewer than 10% of the CDR projects it reviewed met high-quality thresholds, which means demand is rising faster than verified supply. The same report noted that over 90 million tonnes of future CDR demand were already contracted, which is creating a visible delivery gap after 2028 if project execution falls behind. In the voluntary carbon market, that imbalance favors suppliers that can prove delivery timelines, financing readiness, and durable storage outcomes.
Expansion of Digital MRV, Registry Interoperability, and Traceability Tools
The voluntary carbon market is investing more heavily in digital monitoring, reporting, and verification because buyers want faster issuance and clearer audit trails. The World Bank called for harmonized data systems in late 2025, with a focus on interoperability that can support transparent tracking across jurisdictions and registry environments. Research published through IOP Science also pointed to digital MRV as a way to lower verification friction and make industrial capture and removal credits more scalable. This matters because the voluntary carbon market still operates across many standards and data structures, which slows due diligence and makes cross-platform verification harder. Over time, platforms that combine traceability, documentation, and cleaner data flows are likely to reduce the transaction burden for institutional buyers.
Restraints Impact Analysis*
| RESTRAINT | (~) % IMPACT ON CAGR FORECAST | GEOGRAPHIC RELEVANCE | IMPACT TIMELINE |
|---|---|---|---|
| Credit Quality, Additionality, and Permanence Controversies | -4.5% | Global | Short term (≤ 2 years) |
| Fragmented Standards, Registry Rules, and Legal Recognition | -2.5% | Global, most acute in APAC and South America | Medium term (2-4 years) |
| Volatile Prices and Weak Forward Visibility for Avoidance Credits | -1.5% | Global, most acute in avoidance credit markets | Medium term (2-4 years) |
| Counterparty and Delivery Risk in Long-Dated Offtake Contracts | -1.0% | Global, higher exposure in emerging markets | Long term (≥ 4 years) |
| Source: Mordor Intelligence | |||
Credit Quality, Additionality, and Permanence Controversies
The voluntary carbon market continues to face trust issues because academic and regulatory scrutiny is now directly affecting buyer behavior and procurement rules. A 2026 Nature Communications study highlighted systematic over-crediting risks in forest carbon credits and showed how baseline inflation can weaken the real climate effect of issued units. Nature Climate Change also warned in January 2026 that unresolved flaws in UNFCCC carbon trading design could undermine climate action, including cases where independent analysis pointed to major over-crediting risk. Under VCMI rules, companies making public climate claims now face greater legal and reputational exposure if retired credits later fail integrity tests. In the voluntary carbon market, that risk is suppressing weaker avoidance demand while shifting buyer preference toward credits with stronger permanence buffers and more transparent verification.
Fragmented Standards, Registry Rules, and Legal Recognition
The voluntary carbon market still lacks a common ruleset for offset eligibility, ownership treatment, and registry interoperability across major jurisdictions. Brookings identified independent registry systems as a structural weakness because credits created in one system cannot always be checked or recognized efficiently in another. UNFCCC documentation also shows that the Article 6.4 mechanism still operates without a full international legal framework on ownership rights, which complicates control and transfer architecture. ICVCM flagged the lack of consistent legal and accounting treatment as a barrier for institutions that want to treat carbon credits as financial assets with clearer infrastructure and reporting standards. This leaves the voluntary carbon market with higher transaction costs and slower capital formation than its demand profile would otherwise support.
*Our forecasts treat driver/restraint impacts as directional, not additive. The impact forecasts reflect baseline growth, mix effects, and variable interactions.
Segment Analysis
By Credit Type: Removal Gains Momentum While Avoidance Still Anchors Current Scale
Avoidance and Reduction Projects captured 69.43% of the voluntary carbon market share in 2025, which shows how strongly current trading volumes still depend on renewable energy, forestry, waste, and industrial efficiency credits. The voluntary carbon market continues to rely on this broad supply base because these credits remain more available, easier to source, and more familiar to buyers with immediate retirement needs. Even so, the pricing environment is changing as stronger integrity screens narrow the pool of legacy credits that can support public claims.[3]Voluntary Carbon Markets Integrity Initiative, “Carbon Integrity Claims, Claims Code of Practice,” Voluntary Carbon Markets Integrity Initiative, vcmintegrity.org That is making avoidance suppliers more exposed to quality reviews, methodology changes, and margin pressure in the voluntary carbon market.
Removal Projects are projected to grow at a 23.71% CAGR from 2026 to 2031, which makes them the most differentiated expansion track in the voluntary carbon industry. Buyers are moving in this direction because durable removal is becoming more important for residual emissions that cannot be reduced quickly enough through direct abatement. Carbon Direct stated that the current CDR market stood at 8 million tonnes, which remains far below the scale required for long-term decarbonization pathways. In Q1 2026, 95% of retired CDR credits came from nature-based solutions while high-durability engineered approaches made up only 5% of supply, which underlines how constrained verified durable supply still is. The voluntary carbon market is therefore shifting in favor of removal, but scale-up remains the main constraint rather than demand formation.


By Project Category: Renewable Energy Leads While Methane-Oriented Projects Accelerate
Renewable Energy Projects accounted for 39.72% of the voluntary carbon market size in 2025, which kept them in the leading project category because of large credit volumes and broad registry familiarity. These projects still support current liquidity in the voluntary carbon market, especially where issuance costs are lower, and buyers need an accessible supply for ongoing retirement programs. Their medium-term position is less secure because additionality arguments weaken in markets where solar and wind projects are already commercially viable without subsidy. That is starting to reshape project selection toward categories that can show clearer climate impact and stronger verification logic.
Waste Management and Methane Avoidance Projects are projected to grow at a 21.83% CAGR from 2026 to 2031, making them the fastest-growing project category in the voluntary carbon market. Their appeal is rising because methane destruction delivers a more immediate climate effect and is easier for buyers to explain in impact terms than some older project types. Landfill methane credits reached their highest-ever retirement share at 10% of total retirements in Q1 2026, which points to stronger buyer traction for this category. Agriculture and Blue Carbon remained smaller categories, but regenerative agriculture credits surpassed 5 million annualized credits in Q1 2026 and marine and mangrove carbon credits reached 5.3 million. CORSIA-eligible credits also represented nearly 50% of new issuances in Q1 2026, which suggests that aviation-linked quality filters are influencing project category demand more broadly.
By Transaction Type: Spot Liquidity Remains Important While Forward Contracting Expands
Spot Transactions represented 53.61% share in 2026, so the voluntary carbon market still relied on the spot channel for immediate retirements and annual sustainability reporting. This format remains useful for buyers who need near-term flexibility and do not want to commit capital years before delivery. Even with that, the structure of the voluntary carbon market is changing because more buyers are securing future supply well before credits are issued or retired. This is especially visible in categories where quality supply is limited, and buyers fear tighter future availability.
The voluntary carbon market size for Forward Transactions is projected to expand at a 24.76% CAGR through 2031, which reflects the move toward early contracting for scarce high-integrity supply. Long-term offtake agreements are also becoming financing tools because many new removal projects need signed buyers before they can raise construction capital.

By End User: Energy and Utilities Lead Current Demand, While Consumer Goods and Retail Grow Fastest
Energy and Utilities held 32.14% share in 2025, which made it the largest end-user segment in the voluntary carbon market. This segment leads because utilities, power producers, and related operators face direct pressure from carbon pricing, investor scrutiny, and residual emissions that cannot be removed quickly through operational change alone. Manufacturing and industrial buyers also remain important because process emissions in sectors such as steel, cement, and chemicals are harder to abate fully in the near term. Financial services and technology buyers add demand from a different angle, with large firms using higher-quality credits to support formal climate commitments and public disclosure programs.
Consumer Goods and Retail is projected to grow at a 25.48% CAGR from 2026 to 2031, which puts it ahead of every other end-user group in the voluntary carbon market. Product-level carbon neutrality claims matter more in this segment because end consumers can see, compare, and challenge them more directly than in business-to-business settings. VCMI's tiered claims framework is also increasing the need for stronger credit selection when companies want to make public statements tied to offsetting residual emissions. Retail brands also face higher exposure to greenwashing disputes, which makes the quality premium easier to justify in procurement decisions. Transportation and logistics is another structurally growing buyer group, as aviation and shipping participants move closer to compliance-adjacent purchasing needs.
Geography Analysis
North America retained 37.61% market share in 2025, and the region remained the deepest and most liquid voluntary carbon market in current trading conditions. North American project developers supplied 57% of global investment-grade BBB+ issuances, which shows the region's strength in higher-rated credit generation as well as demand. The United States remains the main demand engine because corporate buyers there are active across removal offtake, structured finance, and large retirement programs. CO280 and JPMorganChase agreed in May 2025 on a 450,000 metric tonne CDR offtake over 13 years at under USD 200 per tonne, which helped establish a more concrete benchmark for engineered removals from the pulp and paper pathway. Canada is also gaining visibility as a production hub for engineered removal, supported by Alberta's storage base and new direct air capture collaboration efforts.[4]TKMS Group, “TKMS, Heirloom Carbon Technologies and thyssenkrupp Calvion Explore Commercialization of Direct Air Capture in Canada,” TKMS Group, tkmsgroup.com
Europe accounted for a large share of quality-sensitive demand in 2026, with EU and EEA buyers holding 51% of high-rated retirements. This signals that the voluntary carbon market in Europe is shaped less by raw volume and more by stronger screening of claims, ratings, and disclosure risks. The region is also building more supply-side depth in engineered removal, as shown by Metsä Group's planning work for a commercial wood-based carbon capture plant in Rauma, Finland. That development suggests Europe is starting to align local demand preferences with a more credible domestic removal pipeline.
Asia-Pacific is projected to grow at a 22.19% CAGR through 2031, which gives it the fastest regional expansion rate in the voluntary carbon market. The region is increasingly relevant because it combines rising demand centers with project origination opportunities and a greater role in future cross-border recognition of high-integrity units. South America remains essential on the supply side, especially for REDD+ and ARR pathways, and Sylvera noted that South American REDD+ retirements were already outpacing new supply issuance. Middle East and Africa also remain important supply regions, with Africa contributing more high-rated cookstove and waste credits while Gulf buyers are becoming more active through sovereign climate commitments and bilateral carbon arrangements.

Competitive Landscape
The voluntary carbon market is moderately concentrated in registries and exchange infrastructure, but it remains fragmented across project development, intermediation, and buyer procurement. Xpansiv's CBL platform handled more than 90% of exchange-traded spot voluntary credit volume and connected more than 17 environmental registries, which gave it a leading infrastructure role in price discovery and settlement flows. At the registry layer, the largest programs still control most verified issuances, although ICVCM's approval of 9 programs by April 2026 widened the set of providers that can compete for higher-integrity demand. This leaves the voluntary carbon market with a mixed structure where trading rails are more consolidated than the underlying project supply base. It also means scale advantages are strongest in infrastructure, while competition stays intense in origination and portfolio curation.
A clear competitive pattern in the voluntary carbon market is vertical integration from project sourcing through delivery, especially for firms that want more control over quality and buyer access. Another pattern is specialization around digitally native registries, ratings, and carbon data, where providers differentiate through faster verification cycles and clearer due diligence support.[5]IOP Science, “Can Digital Monitoring, Reporting, and Verification Unlock Industrial CO2 Capture and Removal in Carbon Markets,” Environmental Research Letters, iopscience.iop.org A third pattern is the rise of institutional offtake management, where firms compete not only to sell credits but also to structure long-dated supply relationships with large corporate buyers. Rubicon Carbon's May 2025 framework agreement with Microsoft for 18 million tonnes of high-quality removal credits showed that carbon management firms can compete directly for strategic buyer relationships at very large scale. In the voluntary carbon market, that pushes competition beyond brokerage and into capital access, contract design, and long-term portfolio control.
Voluntary Carbon Industry Leaders
Verra
Gold Standard Foundation
Climate Action Reserve
South Pole
Climate Impact Partners
- *Disclaimer: Major Players sorted in no particular order

Recent Industry Developments
- June 2026: TKMS, Heirloom Carbon Technologies, and thyssenkrupp Calvion signed two Memorandums of Understanding to collaborate on large-scale direct air capture in Alberta, Canada, leveraging the province's geological storage infrastructure to position Canada as a globally competitive exporter of engineered removal credits.
- April 2026: ICVCM updated its assessment status to 9 approved CCP-eligible carbon crediting programs, covering approximately 107 million CCP-approved credits, with the newest additions including ART TREES, Equitable Earth, Isometric, and Puro.Earth, expanding the addressable high-integrity credit pool materially ahead of CORSIA Phase 1.
- March 2026: Inherit Carbon Solutions, in collaboration with HoopCO2 and Northern Lights JV, launched the world's first carbon removal project from biogas in Norway, transporting biogenic CO₂ from a facility in Slemmestad to permanent geological storage below the seabed, with credits certified through the Puro.earth registry.
- May 2025: Rubicon Carbon and Microsoft signed a framework agreement for 18 million tonnes of high-quality carbon removal credits, structured as 15-year to 20-year offtakes supporting an ARR project pipeline, representing one of the largest single-buyer removal commitments globally.


Global Voluntary Carbon Market Report Scope
Voluntary Carbon refers to carbon credits or offsets that are bought and traded outside of government-regulated compliance programs. Businesses, organizations, and individuals typically purchase these credits to reduce their carbon footprint or achieve net-zero goals. These credits are created through initiatives such as renewable energy, forestry, land use, agriculture, or carbon removal projects. They allow buyers to voluntarily offset their greenhouse gas emissions while contributing to climate mitigation efforts.
The Voluntary Carbon Market Report is Segmented by Credit Type (Avoidance and Reduction Projects, and Removal Projects), Project Category (Renewable Energy Projects, Forestry and Land Use Projects, Waste Management and Methane Avoidance Projects, Agriculture Projects, Blue Carbon Projects, and Other Project Categories), Transaction Type (Spot Transactions, Forward Transactions, and Long-Term Offtake Transactions), End-User Industry (Energy and Utilities, Manufacturing and Industrial, Consumer Goods and Retail, Transportation and Logistics, Financial Services, Technology and Telecommunications, Government Agencies, Non-Governmental Organizations, Individuals, and Other End-User Industries), and Geography (North America, South America, Europe, Asia-Pacific, and Middle East and Africa). The Market Forecasts are Provided in Terms of Value (USD).
| Avoidance and Reduction Projects |
| Removal Projects |
| Renewable Energy Projects |
| Forestry and Land Use Projects |
| Waste Management and Methane Avoidance Projects |
| Agriculture Projects |
| Blue Carbon Projects |
| Other Project Categories |
| Spot Transactions |
| Forward Transactions |
| Long-Term Offtake Agreements |
| Energy and Utilities |
| Manufacturing and Industrial |
| Consumer Goods and Retail |
| Transportation and Logistics |
| Financial Services |
| Technology and Telecommunications |
| Government Agencies |
| Non-Governmental Organizations |
| Individuals |
| Other End User Industries |
| North America | United States |
| Canada | |
| Mexico | |
| South America | Brazil |
| Argentina | |
| Chile | |
| Rest of South America | |
| Europe | Germany |
| United Kingdom | |
| France | |
| Italy | |
| Spain | |
| Rest of Europe | |
| Asia-pacific | China |
| Japan | |
| India | |
| Australia | |
| South Korea | |
| Singapore | |
| Rest of Asia-pacific | |
| Middle East | Saudi Arabia |
| United Arab Emirates | |
| Turkey | |
| Rest of Middle East | |
| Africa | South Africa |
| Egypt | |
| Nigeria | |
| Rest of Africa |
| By Credit Type | Avoidance and Reduction Projects | |
| Removal Projects | ||
| By Project Category | Renewable Energy Projects | |
| Forestry and Land Use Projects | ||
| Waste Management and Methane Avoidance Projects | ||
| Agriculture Projects | ||
| Blue Carbon Projects | ||
| Other Project Categories | ||
| By Transaction Type | Spot Transactions | |
| Forward Transactions | ||
| Long-Term Offtake Agreements | ||
| By End User Industry | Energy and Utilities | |
| Manufacturing and Industrial | ||
| Consumer Goods and Retail | ||
| Transportation and Logistics | ||
| Financial Services | ||
| Technology and Telecommunications | ||
| Government Agencies | ||
| Non-Governmental Organizations | ||
| Individuals | ||
| Other End User Industries | ||
| By Geography | North America | United States |
| Canada | ||
| Mexico | ||
| South America | Brazil | |
| Argentina | ||
| Chile | ||
| Rest of South America | ||
| Europe | Germany | |
| United Kingdom | ||
| France | ||
| Italy | ||
| Spain | ||
| Rest of Europe | ||
| Asia-pacific | China | |
| Japan | ||
| India | ||
| Australia | ||
| South Korea | ||
| Singapore | ||
| Rest of Asia-pacific | ||
| Middle East | Saudi Arabia | |
| United Arab Emirates | ||
| Turkey | ||
| Rest of Middle East | ||
| Africa | South Africa | |
| Egypt | ||
| Nigeria | ||
| Rest of Africa | ||


Key Questions Answered in the Report
What is the current size and 2031 outlook for the voluntary carbon market?
The voluntary carbon market was valued at USD 2.36 billion in 2025, reached USD 2.83 billion in 2026, and is projected to reach USD 7.06 billion by 2031 at a 20.06% CAGR.
Which credit type is growing fastest in carbon credits?
Removal Projects are the fastest-growing credit type, with a projected 23.71% CAGR from 2026 to 2031, even though Avoidance and Reduction Projects still held the largest 2025 share.
Why are buyers shifting toward higher-integrity carbon credits?
Buyers face more scrutiny over climate claims, and VCMI rules from 2026 increased the need for CCP-approved or Article 6.4 credits when companies make public claims.
Which end-user group is expanding the quickest?
Consumer Goods and Retail is projected to grow at a 25.48% CAGR through 2031 because product claims, Scope 3 pressure, and litigation exposure are raising demand for credible credits.
Which region leads voluntary carbon credit activity today?
North America led with a 37.61% share in 2025 because it has deeper institutional demand, more structured transactions, and stronger participation from energy, finance, and technology buyers.
What is changing the way projects get financed in this space?
Long-term offtake agreements are increasingly used to support project finance, as shown by J.P. Morgan's USD 210 million facility for Chestnut Carbon backed by a 25-year Microsoft agreement.
Page last updated on:


